

Weighted Gene Co-expression Network Analysis Identifies CALD1 as a Biomarker Related to M2 Macrophages Infiltration in Stage III and IV Mismatch Repair-Proficient Colorectal Carcinoma
- PMID: 33996905
- PMCID: PMC8116739
- DOI: 10.3389/fmolb.2021.649363
Weighted Gene Co-expression Network Analysis Identifies CALD1 as a Biomarker Related to M2 Macrophages Infiltration in Stage III and IV Mismatch Repair-Proficient Colorectal Carcinoma
Abstract
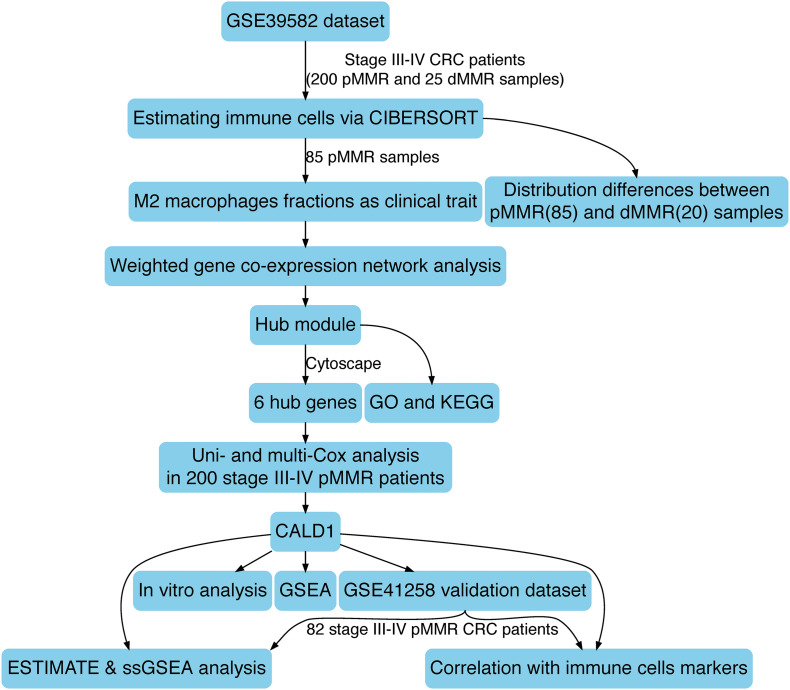
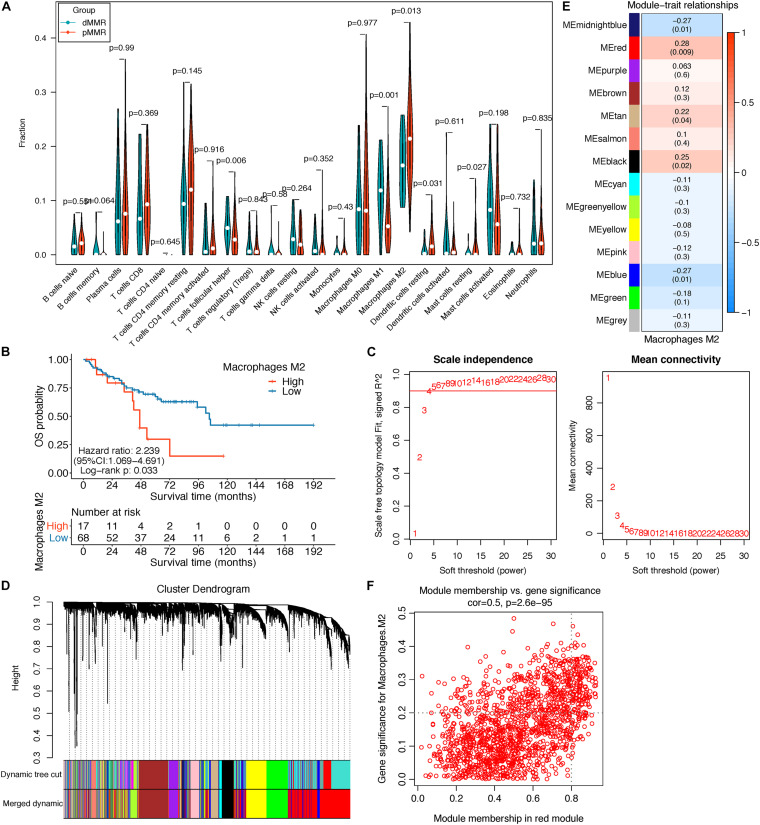
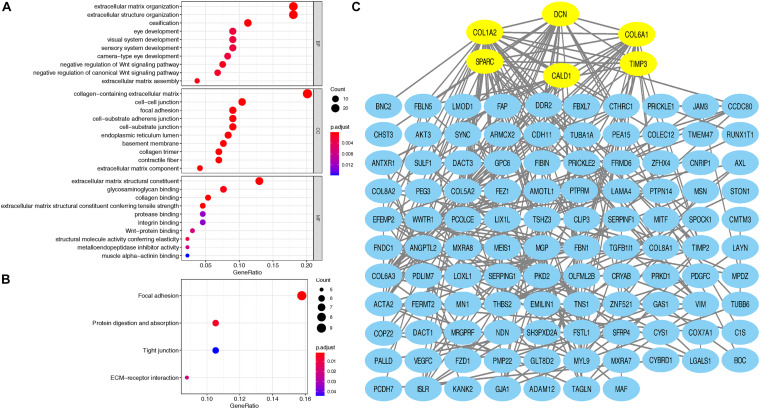
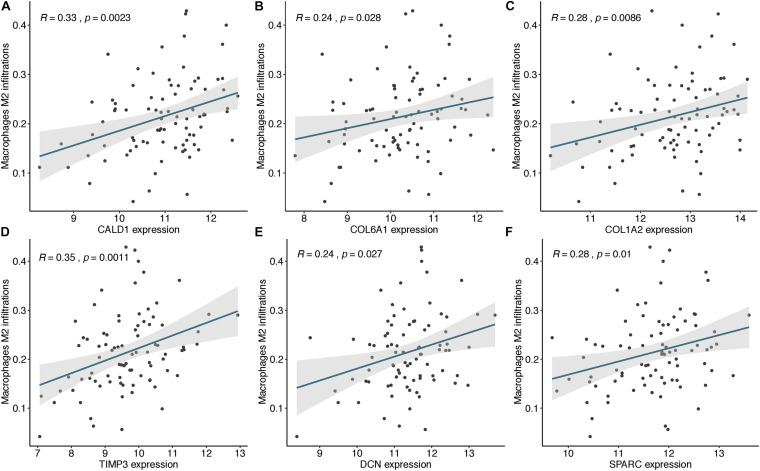
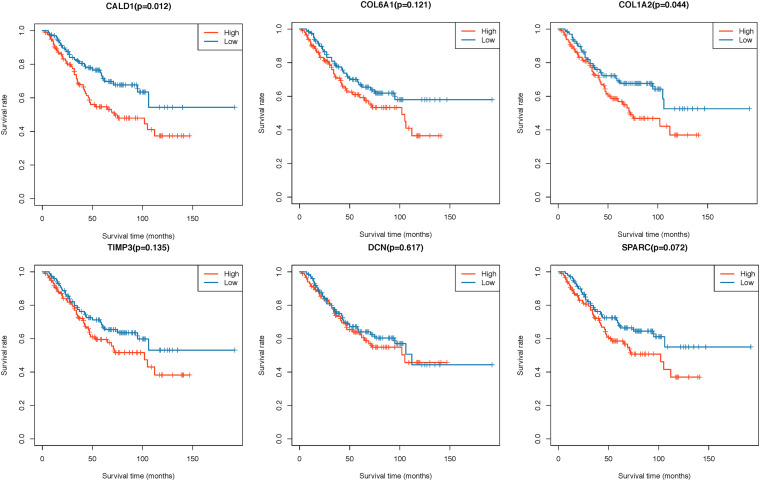
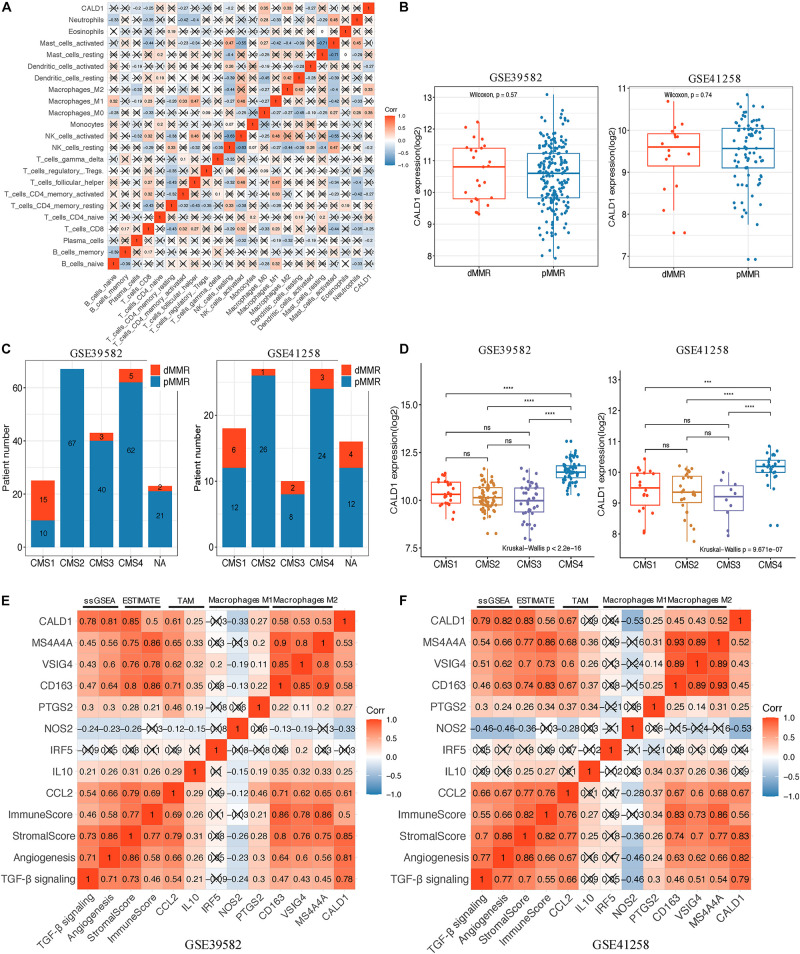
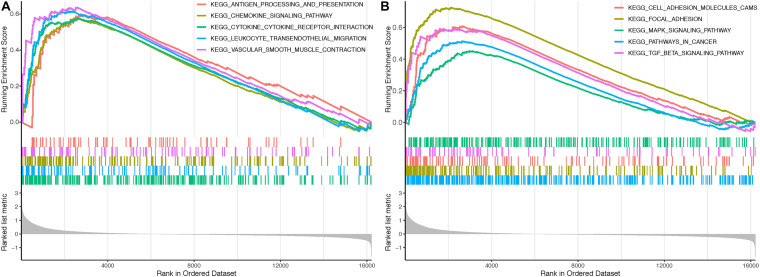
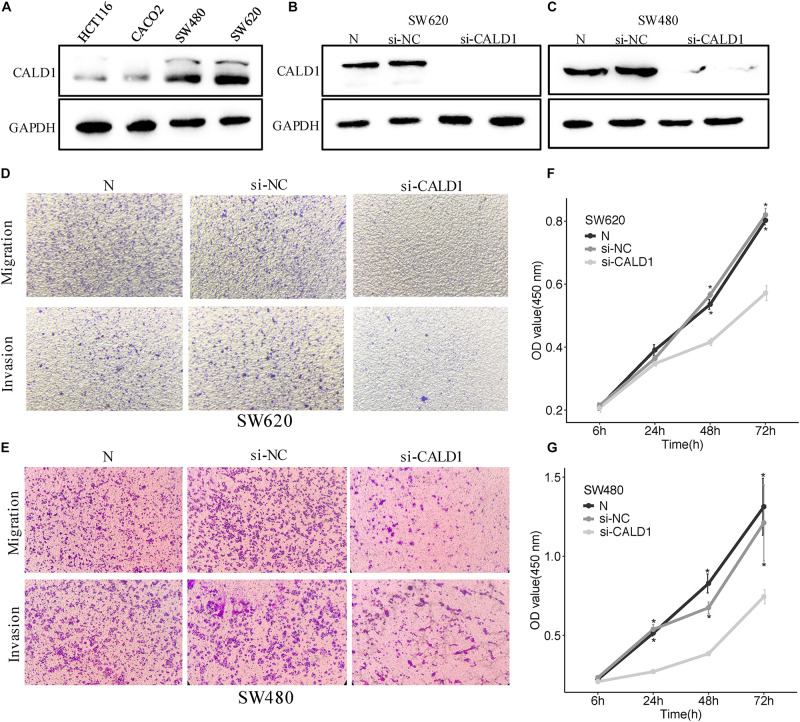
Immunotherapy has achieved efficacy for advanced colorectal cancer (CRC) patients with a mismatch-repair-deficient (dMMR) subtype. However, little immunotherapy efficacy was observed in patients with the mismatch repair-proficient (pMMR) subtype, and hence, identifying new immune therapeutic targets is imperative for those patients. In this study, transcriptome data of stage III/IV CRC patients were retrieved from the Gene Expression Omnibus database. The CIBERSORT algorithm was used to quantify immune cellular compositions, and the results revealed that M2 macrophage fractions were higher in pMMR patients as compared with those with the dMMR subtype; moreover, pMMR patients with higher M2 macrophage fractions experienced shorter overall survival (OS). Subsequently, weighted gene co-expression network analysis and protein-protein interaction network analysis identified six hub genes related to M2 macrophage infiltrations in pMMR CRC patients: CALD1, COL6A1, COL1A2, TIMP3, DCN, and SPARC. Univariate and multivariate Cox regression analyses then determined CALD1 as the independent prognostic biomarker for OS. CALD1 was upregulated specifically the in CMS4 CRC subtype, and single-sample Gene Set Enrichment Analysis (ssGSEA) revealed that CALD1 was significantly correlated with angiogenesis and TGF-β signaling gene sets enrichment scores in stage III/IV pMMR CRC samples. The Estimation of STromal and Immune cells in MAlignant Tumor tissues using Expression data (ESTIMATE) algorithm and correlation analysis revealed that CALD1 was significantly associated with multiple immune and stromal components in a tumor microenvironment. In addition, GSEA demonstrated that high expression of CALD1 was significantly correlated with antigen processing and presentation, chemokine signaling, leukocyte transendothelial migration, vascular smooth muscle contraction, cytokine-cytokine receptor interaction, cell adhesion molecules, focal adhesion, MAPK, and TGF-beta signaling pathways. Furthermore, the proliferation, invasion, and migration abilities of cancer cells were suppressed after reducing CALD1 expression in CRC cell lines. Taken together, multiple bioinformatics analyses and cell-level assays demonstrated that CALD1 could serve as a prognostic biomarker and a prospective therapeutic target for stage III/IV pMMR CRCs.
Keywords: M2 macrophages; bioinformatics; colorectal cancer; microsatellite instability; prognosis; tumor microenvironment.
Copyright © 2021 Zheng, Bai, Wang, Chen, Zhang, Zhu, Liu and Wang.
Conflict of interest statement
The authors declare that the research was conducted in the absence of any commercial or financial relationships that could be construed as a potential conflict of interest.
Figures
Similar articles
-
Identification of genes and cellular response factors related to immunotherapy response in mismatch repair-proficient colorectal cancer: a bioinformatics analysis.J Gastrointest Oncol. 2022 Dec;13(6):3038-3055. doi: 10.21037/jgo-22-1070. J Gastrointest Oncol. 2022. PMID: 36636048 Free PMC article.
-
Loss of survival advantage for deficient mismatch repair in patients with advanced colorectal cancer may be caused by changes in prognostic value of CD8+T cell.World J Surg Oncol. 2020 Aug 7;18(1):196. doi: 10.1186/s12957-020-01970-0. World J Surg Oncol. 2020. PMID: 32767974 Free PMC article.
-
CMTM6 expression in M2 macrophages is a potential predictor of PD-1/PD-L1 inhibitor response in colorectal cancer.Cancer Immunol Immunother. 2021 Nov;70(11):3235-3248. doi: 10.1007/s00262-021-02931-6. Epub 2021 Apr 5. Cancer Immunol Immunother. 2021. PMID: 33818637 Free PMC article.
-
Prognostic and predictive role of DNA mismatch repair status in stage II-III colorectal cancer: A systematic review and meta-analysis.Clin Genet. 2020 Jan;97(1):25-38. doi: 10.1111/cge.13628. Epub 2019 Sep 4. Clin Genet. 2020. PMID: 31432497
-
Cell-based immunotherapy approaches for colorectal cancer: main achievements and challenges.Future Oncol. 2021 Aug;17(24):3253-3270. doi: 10.2217/fon-2020-1218. Epub 2021 Jun 22. Future Oncol. 2021. PMID: 34156258 Review.
Cited by
-
MiR-1278 targets CALD1 and suppresses the progression of gastric cancer via the MAPK pathway.Open Med (Wars). 2023 Nov 18;18(1):20230776. doi: 10.1515/med-2023-0776. eCollection 2023. Open Med (Wars). 2023. PMID: 38025524 Free PMC article.
-
Inferring spatial transcriptomics markers from whole slide images to characterize metastasis-related spatial heterogeneity of colorectal tumors: A pilot study.J Pathol Inform. 2023 Mar 29;14:100308. doi: 10.1016/j.jpi.2023.100308. eCollection 2023. J Pathol Inform. 2023. PMID: 37114077 Free PMC article.
-
Development of novel models for predicting mismatch repair protein deficiency and relevant disease-free survival in colorectal cancer patients.Int J Colorectal Dis. 2022 Jun;37(6):1449-1464. doi: 10.1007/s00384-022-04150-6. Epub 2022 Apr 28. Int J Colorectal Dis. 2022. PMID: 35482069
-
mRNAsi-related metabolic risk score model identifies poor prognosis, immunoevasive contexture, and low chemotherapy response in colorectal cancer patients through machine learning.Front Immunol. 2022 Aug 23;13:950782. doi: 10.3389/fimmu.2022.950782. eCollection 2022. Front Immunol. 2022. PMID: 36081499 Free PMC article.
-
Immunohistochemical Expression Analysis of Caldesmon Isoforms in Colorectal Carcinoma Reveals Interesting Correlations with Tumor Characteristics.Int J Mol Sci. 2023 Jan 23;24(3):2275. doi: 10.3390/ijms24032275. Int J Mol Sci. 2023. PMID: 36768598 Free PMC article.
References
-
- Bernal M., Concha A., Sáenz-López P., Rodríguez A. I., Cabrera T., Garrido F., et al. (2011). Leukocyte infiltrate in gastrointestinal adenocarcinomas is strongly associated with tumor microsatellite instability but not with tumor immunogenicity. Cancer Immunol. Immunother. 60 869–882. 10.1007/s00262-011-0999-1 - DOI - PMC - PubMed
-
- Boland C. R., Thibodeau S. N., Hamilton S. R., Sidransky D., Eshleman J. R., Burt R. W., et al. (1998). A National Cancer Institute Workshop on microsatellite instability for cancer detection and familial predisposition: development of international criteria for the determination of microsatellite instability in colorectal cancer. Cancer Res. 58 5248–5257. - PubMed
LinkOut - more resources
Full Text Sources
Other Literature Sources
Miscellaneous