Deep Insight Into Long Non-coding RNA and mRNA Transcriptome Profiling in HepG2 Cells Expressing Genotype IV Swine Hepatitis E Virus ORF3
- PMID: 33996960
- PMCID: PMC8116512
- DOI: 10.3389/fvets.2021.625609
Deep Insight Into Long Non-coding RNA and mRNA Transcriptome Profiling in HepG2 Cells Expressing Genotype IV Swine Hepatitis E Virus ORF3
Abstract
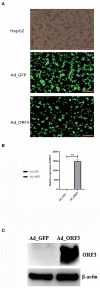
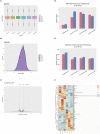
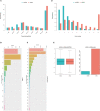
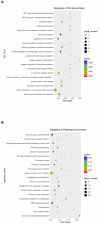
Swine hepatitis E (swine HE) is a new type of zoonotic infectious disease caused by the swine hepatitis E virus (swine HEV). Open reading frame 3 (ORF3) is an important virulent protein of swine HEV, but its function still is mainly unclear. In this study, we generated adenoviruses ADV4-ORF3 and ADV4 negative control (ADV4-NC), which successfully mediated overexpression of enhanced green fluorescent protein (EGFP)-ORF3 and EGFP, respectively, in HepG2 cells. High-throughput sequencing was used to screen for differentially expressed long non-coding RNAs (lncRNAs) and messenger RNAs (mRNAs). The cis-target genes of lncRNAs were predicted, functional enrichment (Gene Ontology [GO] and Kyoto Encyclopedia of Genes and Genomes [KEGG]) was performed, and 12 lncRNAs with statistically significant different expressions (p ≤ 0.05 and q ≤ 1) were selected for further quantitative real-time reverse transcription (qRT-PCR) validation. In HepG2 cells, we identified 62 significantly differentially expressed genes (DEGs) (6,564 transcripts) and 319 lncRNAs (124 known lncRNAs and 195 novel lncRNAs) that were affected by ORF3, which were involved in systemic lupus erythematosus, Staphylococcus aureus infection, signaling pathways pluripotency regulation of stem cells, the peroxisome proliferator-activated receptor (PPAR) signaling pathway, and platinum drug resistance pathways. Cis-target gene prediction identified 45 lncRNAs corresponding to candidate mRNAs, among which eight were validated by qRT-PCR: LINC02476 (two transcripts), RAP2C-AS1, AC016526, AL139099, and ZNF337-AS1 (3 transcripts). Our results revealed that the lncRNA profile in host cells affected by ORF3, swine HEV ORF3, might affect the pentose and glucuronate interconversions and mediate the formation of obstructive jaundice by influencing bile secretion, which will help to determine the function of ORF3 and the infection mechanism and treatment of swine HE.
Keywords: HepG2; ORF3; lncRNA; swine HE; swine HEV.
Copyright © 2021 Jiao, Shuai, Luo, Zhou, Zhao, Li, Gu, Li, Li, Zeng, Guo, Xiao, Song, Gan and Huang.
Conflict of interest statement
The authors declare that the research was conducted in the absence of any commercial or financial relationships that could be construed as a potential conflict of interest.
Figures


Similar articles
-
Identifying Circular RNAs in HepG2 Expressing Genotype IV Swine Hepatitis E Virus ORF3 Via Whole Genome Sequencing.Cell Transplant. 2021 Jan-Dec;30:9636897211055042. doi: 10.1177/09636897211055042. Cell Transplant. 2021. PMID: 34699255 Free PMC article.
-
Descriptive Comparative Transcriptomic Analysis of Genotype IV SHEV ORF3-Expressing HepG2 Cells.Microorganisms. 2025 Feb 13;13(2):412. doi: 10.3390/microorganisms13020412. Microorganisms. 2025. PMID: 40005777 Free PMC article.
-
Transcriptome Analysis of HepG2 Cells Expressing ORF3 from Swine Hepatitis E Virus to Determine the Effects of ORF3 on Host Cells.Biomed Res Int. 2016;2016:1648030. doi: 10.1155/2016/1648030. Epub 2016 Aug 28. Biomed Res Int. 2016. PMID: 27648443 Free PMC article.
-
Genome-wide identification and characterization of long non-coding RNAs during postnatal development of rabbit adipose tissue.Lipids Health Dis. 2018 Nov 28;17(1):271. doi: 10.1186/s12944-018-0915-1. Lipids Health Dis. 2018. PMID: 30486837 Free PMC article.
-
Multiple Functions of Hepatitis E Virus ORF3.Microorganisms. 2024 Jul 11;12(7):1405. doi: 10.3390/microorganisms12071405. Microorganisms. 2024. PMID: 39065173 Free PMC article. Review.
Cited by
-
Identifying Circular RNAs in HepG2 Expressing Genotype IV Swine Hepatitis E Virus ORF3 Via Whole Genome Sequencing.Cell Transplant. 2021 Jan-Dec;30:9636897211055042. doi: 10.1177/09636897211055042. Cell Transplant. 2021. PMID: 34699255 Free PMC article.
-
Descriptive Comparative Transcriptomic Analysis of Genotype IV SHEV ORF3-Expressing HepG2 Cells.Microorganisms. 2025 Feb 13;13(2):412. doi: 10.3390/microorganisms13020412. Microorganisms. 2025. PMID: 40005777 Free PMC article.
-
Integrative Analysis of Transcriptome and Metabolome Reveals the Pivotal Role of the NAM Family Genes in Oncidium hybridum Lodd. Pseudobulb Growth.Int J Mol Sci. 2024 Sep 26;25(19):10355. doi: 10.3390/ijms251910355. Int J Mol Sci. 2024. PMID: 39408686 Free PMC article.
References
LinkOut - more resources
Full Text Sources
Other Literature Sources

