

Dimensions of Migrant Integration in Western Europe
- PMID: 33996988
- PMCID: PMC8116888
- DOI: 10.3389/fsoc.2021.510987
Dimensions of Migrant Integration in Western Europe
Abstract
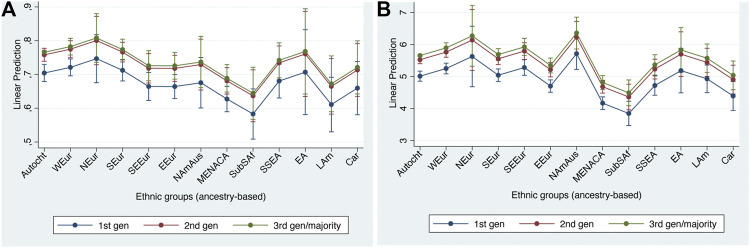
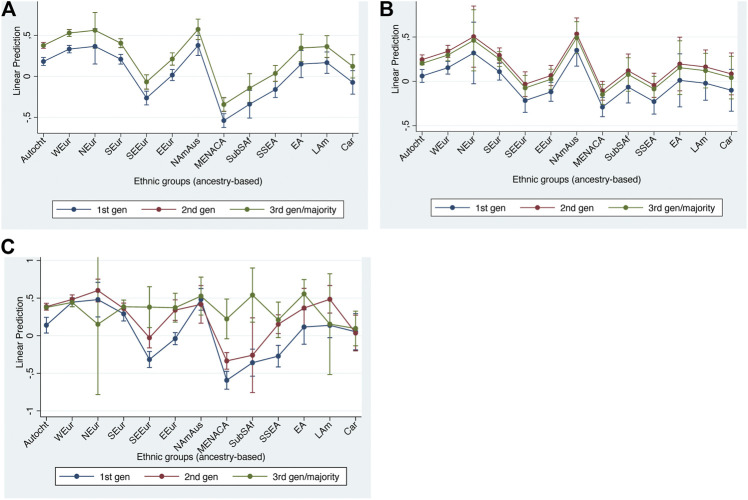
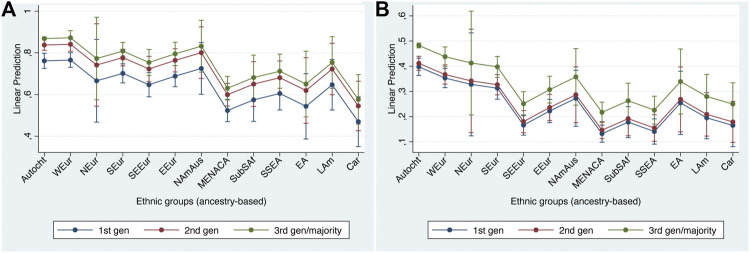
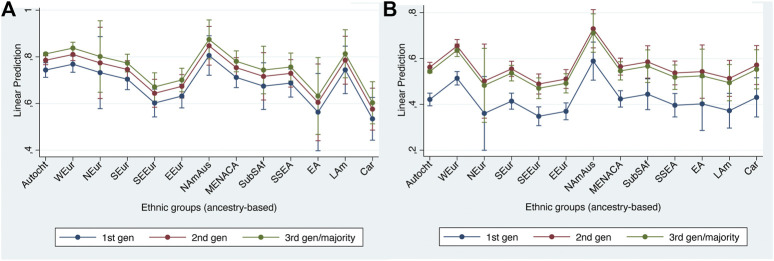
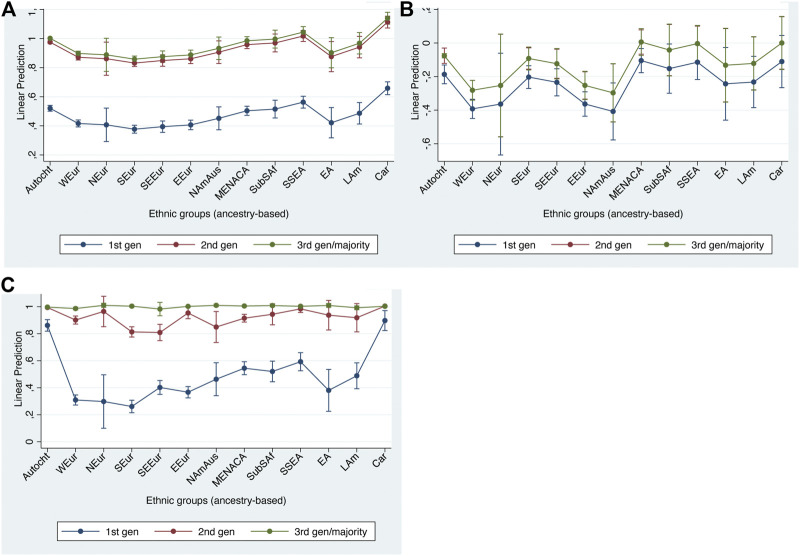
The integration of immigrant minorities is a major concern for diverse societies-with major implications for the well-being of those affected, social cohesion and group relations, and economic and social progress. In this paper, we give a comprehensive description of long-term migrant integration in Western Europe to investigate theories of migrant assimilation and integration. We take a multidimensional approach, looking at 10 indicators measuring social, structural, political, civic and cultural integration. We take an innovative approach to measuring minority background by using two complementary measures: generational status, distinguishing first and second-generation migrants from the third and higher up 'natives,' and self-reported ancestry, separating those with autochthonous-only ancestry from those with various kinds of allochthonous ancestry. Using interaction effects between these measures, we can test whether generational change is faster or slower for some ethnic groups than for others, i.e. whether different groups integrate at differing speeds. Using the pooled samples of all Western European countries included in the European Social Survey rounds 7 and 8, we run multivariate regression analyses to estimate the effects of migrant background on the 10 indicators of integration. Compared to migrants with autochthonous ancestry, respondents of Middle Eastern, North African & Central Asian as well as Sub-Saharan African ancestry are less integrated on all dimensions of integration except the political and civic ones. The South & South-East Asian group is also substantially less assimilated socially and culturally, but not so much structurally. They are closely followed by the South East and East European groups, following the same pattern except that the latter are less integrated politically as well. We only find substantial interaction effects between ethnic group and migrant generation for two integration indicators, namely citizenship and homophobia, for which speed of integration thus appears to differ across ethnic groups. For all other indicators, integration speed does not appear to differ across ethnic groups, supporting straight line assimilation theory, with social integration in terms of interethnic friendship potentially rather following a 'bumpy-line' pattern.
Keywords: Western Europe; assimilation; civic integration; cultural integration; migrant integration; political integration; social integration; structural integration.
Copyright © 2021 Heath and Schneider.
Conflict of interest statement
The authors declare that the research was conducted in the absence of any commercial or financial relationships that could be construed as a potential conflict of interest.
Figures
Similar articles
-
Trends in fertility and intermarriage among immigrant populations in Western Europe as measures of integration.J Biosoc Sci. 1994 Jan;26(1):107-36. doi: 10.1017/s0021932000021106. J Biosoc Sci. 1994. PMID: 8200876
-
Depression in Europe: does migrant integration have mental health payoffs? A cross-national comparison of 20 European countries.Ethn Health. 2015;20(1):49-65. doi: 10.1080/13557858.2014.883369. Epub 2014 Feb 11. Ethn Health. 2015. PMID: 24517205
-
Assimilation process and group integration of migrant families.Int Migr. 1989 Mar;27(1):27-48. doi: 10.1111/j.1468-2435.1989.tb00345.x. Int Migr. 1989. PMID: 12281961
-
Migration and health: exploring the role of migrant status through register-based studies.Dan Med J. 2015 Apr;62(4):B5068. Dan Med J. 2015. PMID: 25872539 Review.
-
How effective are approaches to migrant screening for infectious diseases in Europe? A systematic review.Lancet Infect Dis. 2018 Sep;18(9):e259-e271. doi: 10.1016/S1473-3099(18)30117-8. Epub 2018 May 16. Lancet Infect Dis. 2018. PMID: 29778396
Cited by
-
Integration gaps persist despite immigrants' value assimilation: evidence from the European Social Survey.Front Sociol. 2025 Apr 1;10:1504127. doi: 10.3389/fsoc.2025.1504127. eCollection 2025. Front Sociol. 2025. PMID: 40236759 Free PMC article.
References
-
- Atkinson A. B., Hasell J., Morelli S., Roser M. (2017). The chartbook of economic inequality. Oxford: Institute for New Economic Thinking at the Oxford Martin School.
-
- Bloemraad I., Wright M. (2014). “Utter failure” or unity out of diversity? Debating and evaluating policies of multiculturalism. Int. Migr. Rev. 48 (1_Suppl. l), 292–334. 10.1111/imre.12135 - DOI
-
- Breen R., Karlson K. B., Holm A. (2018). Interpreting and understanding logits, probits, and other nonlinear probability models. Annu. Rev. Sociol. 44 (1), 39–54. 10.1146/annurev-soc-073117-041429 - DOI
-
- Casey L. (2016). The Casey Review: a review into opportunity and integration. London: Department for Communities and Local Government.
LinkOut - more resources
Full Text Sources
Other Literature Sources