. 2021 Apr 26:2021:5511841.
doi: 10.1155/2021/5511841. eCollection 2021.

Robust Plasma Cell Response to Skin-Inoculated Dengue Virus in Mice

Affiliations

Robust Plasma Cell Response to Skin-Inoculated Dengue Virus in Mice

Raúl A Maqueda-Alfaro et al. J Immunol Res. .

Abstract

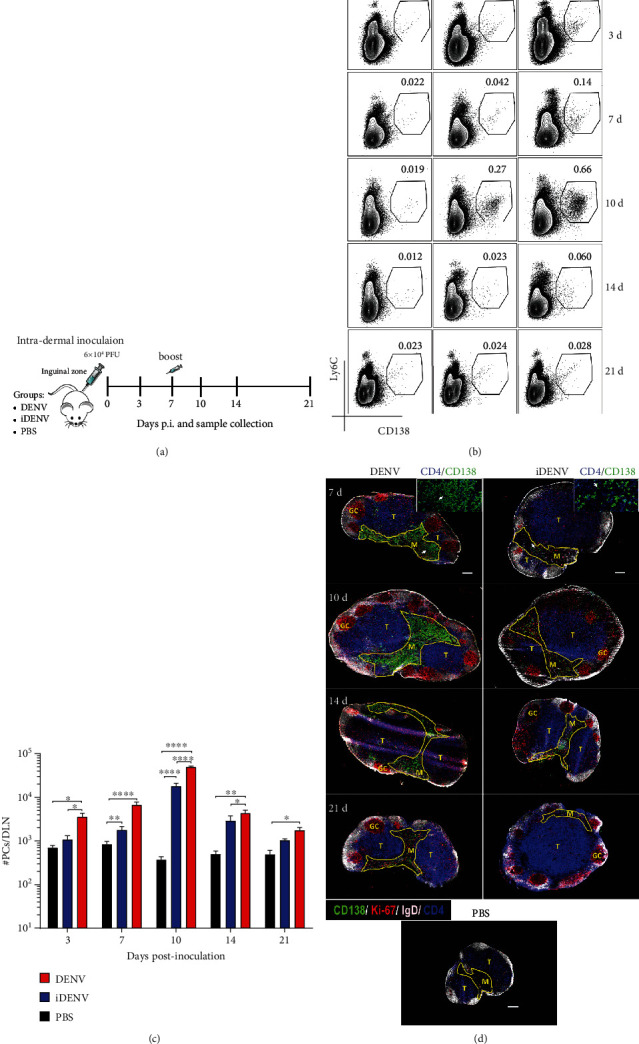
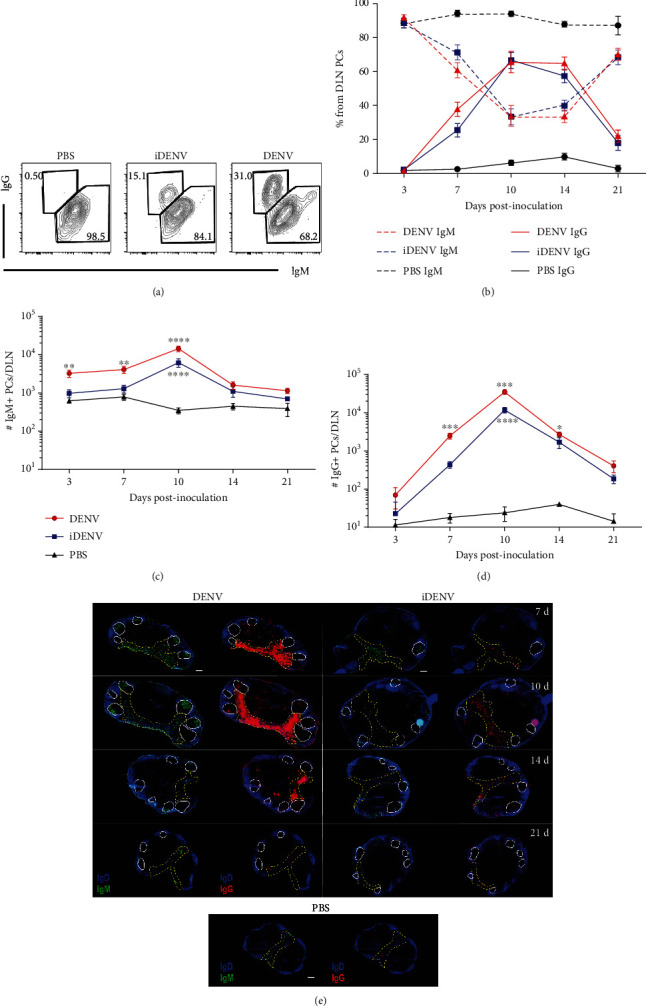
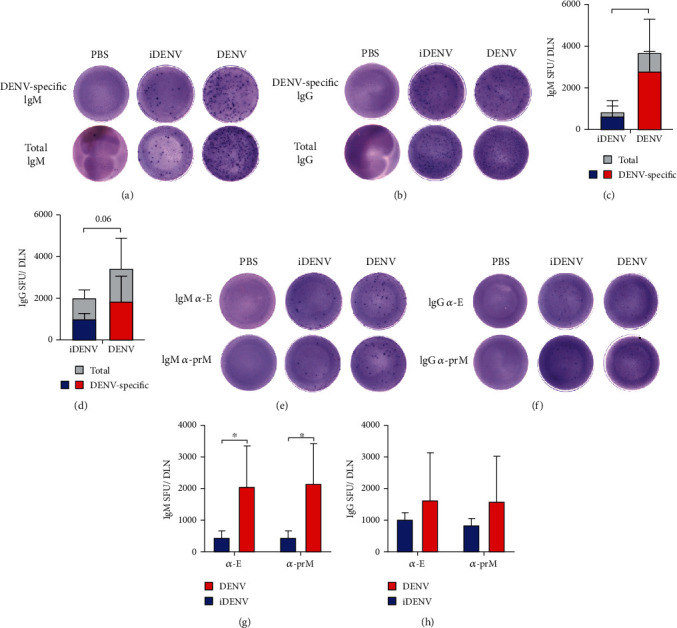
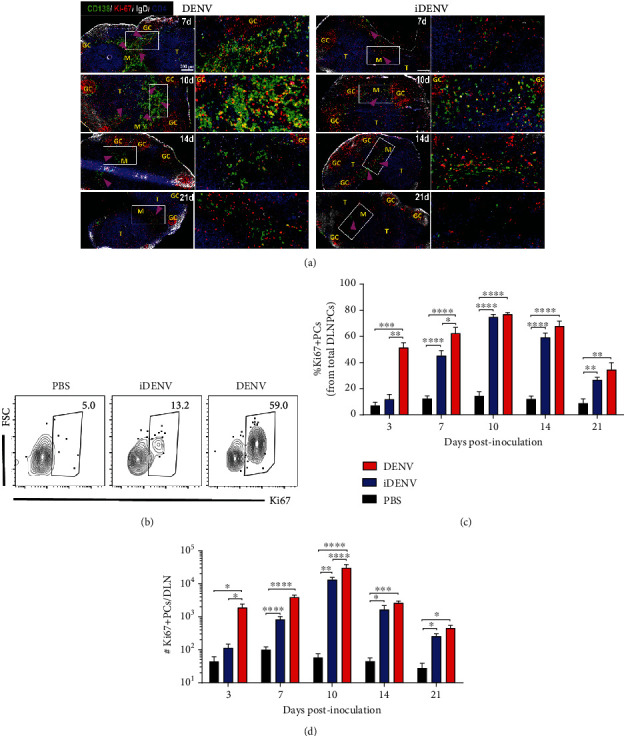
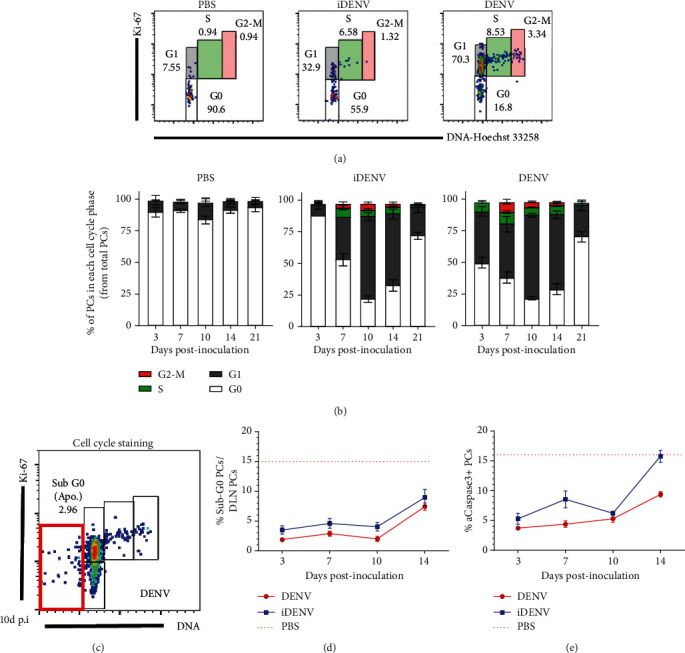
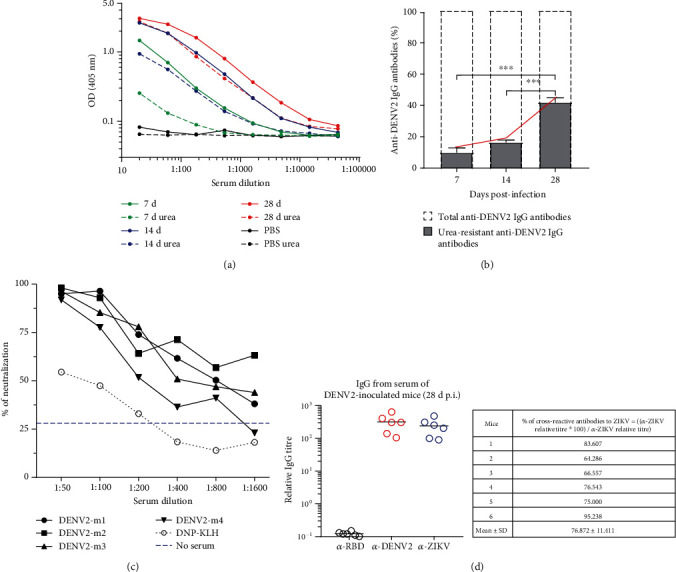
Dengue is a worldwide expanding threat caused by dengue virus (DENV) infection. To date, no specific treatment or effective vaccine is available. Antibodies produced by plasma cells (PCs) might be involved concomitantly in protection and severe dengue immunopathology. Although a massive appearance of PCs has been reported during acute DENV infection in humans, this response has been poorly characterized. Here, we show the dynamic of PC generation in immune-competent mice cutaneously inoculated with DENV compared with two control experimental groups: mice inoculated with inactivated DENV or with PBS. We found that PC numbers increased significantly in the skin-draining lymph node (DLN), peaking at day 10 and abruptly decreasing by day 14 after DENV inoculation. Class-switched IgG+ PCs appeared from day 7 and dominated the response, while in contrast, the frequency of IgM+ PCs decreased from day 7 onwards. Even though the kinetic of the response was similar between DENV- and iDENV-inoculated mice, the intensity of the response was significantly different. Interestingly, we demonstrated a similar PC response to virus antigens (E and prM) by ELISPOT. In situ characterization showed that PCs were distributed in the medullary cords and in close proximity to germinal centers (GCs), suggesting both an extrafollicular and a GC origin. Proliferating PCs (Ki-67+) were found as early as 3-day postinoculation, and in-depth analysis showed that these PCs were in active phases of cell cycle during the kinetic. Finally, we found a progressive appearance of high-affinity neutralizing DENV-specific IgG further supporting GC involvement. Of note, these antibodies seem to be highly cross-reactive, as a large proportion recognizes Zika virus (ZIKV). The strong PC response to skin-inoculated DENV in this work resembles the findings already described in humans. We consider that this study contributes to the understanding of the in vivo biology of the humoral immune response to DENV in an immunocompetent murine model.


Conflict of interest statement

The authors declare that there is no conflict of interest regarding the publication of this paper.

Figures

Figure 1
Figure 1
Dynamic of PCs in the draining lymph node (DLN) of immune-competent mice induced by cutaneous DENV inoculation. (a) Mice were inoculated intradermally (i.d.). with 6 × 10⁴ PFU of DENV, UV-inactivated DENV (iDENV), or endotoxin-free PBS at day 0, boosted at day 7, and samples were collected at the indicated days. PCs in the DLN were analyzed by flow cytometry, gating on single/live cells/CD138+Ly6C+ (Figure S1). (b) Representative contour plots during the kinetic p.i. shows the proportion of PCs with the different conditions. Numbers indicate the proportion of PCs among total single/live cells. (c) Absolute numbers of PCs at days 3, 7, 10, 14, and 21 p.i. (d) DLN cryosections labelled for CD138 (green), CD4 (blue) to identify the T zone (T), IgD for follicular B cells (white), and the proliferation marker Ki-67 (red). GCs are Ki-67+ cells inside IgD-negative areas. The medulla (M) is depicted in yellow solid line. Left and right panels show DLNs from DENV- and iDENV-inoculated mice, respectively, whereas the bottom panel shows a representative DLN from noninfected PBS-inoculated mice. A higher magnification of medulla CD138+ and CD4+ cells is shown for day 7 (white arrow) to illustrate specific staining of CD138+ PCs. Scale bars represent 200 μm. Flow cytometry data shown represent the mean ± SEM from at least four independent experiments with two mice per group per time point and histology results from two experiments with four mice per group per time point. Two-way ANOVA with Bonferroni posttest were used for the statistical analysis. P < 0.05, ∗∗P < 0.01, ∗∗∗P < 0.001, and ∗∗∗∗P < 0.0001.
Figure 2
Figure 2
PCs response induced by DENV is largely dominated by IgG+ class-switched cells. Class-switched PCs were analyzed by intracellular staining of IgM and IgG by flow cytometry in the DLN of mice at different times postcutaneous inoculation. (a) Representative flow cytometry contour plots of IgM+ vs. IgG+ PCs (CD138+Ly6C+) at day 7 post-DENV inoculation. Numbers represent the proportion of IgM+ or IgG+ cells from PCs. (b) Percentage of IgM+ and IgG+ PCs during the kinetic. Dotted lines represent IgM+ PCs, and solid lines IgG+ PCs among the groups. Number of IgM (c) and IgG (d) PCs at days 3, 7, 10, 14, and 21 p.i. (e) DLN cryosections from mice inoculated with DENV (left panel), iDENV (right panel), or PBS (bottom panel) show the distribution of IgM- (green, left) and IgG-expressing cells (red, right). GC zones and the medulla are indicated with white solid lines and yellow dotted lines, respectively. Scale bars represent 200 μm. Data shown represent the mean ± SEM and are representative of four independent experiments with two mice per group per time point and histology results from two experiments with four mice per group per time point. Two-way ANOVA with the Bonferroni post hoc test were used for the statistical analysis. P < 0.05, ∗∗P < 0.01, ∗∗∗P < 0.001, and ∗∗∗P < 0.0001. Asterisks above the DENV line (solid red line) represent statistical differences against iDENV, and asterisks below the iDENV line (solid blue line) represent statistical differences against the PBS control group.
Figure 3
Figure 3
PCs specific to DENV and structural E and prM proteins. ELISPOT assays of DENV-, E-, and prM-IgM and -IgG PCs were performed at day 10 postinoculation. Representative pictures of wells for the detection of total or DENV-specific IgM (a) and IgG SFU (b). Graphs showing the number of total and DENV-specific IgM (c) or IgG SFU (d) per DLN. Representative pictures of wells detecting E- and prM-specific IgM (e) or IgG SFU (f). Graphs showing the number of E- and prM-specific IgM (g) or IgG SFU (h). Data shown represent the mean ± SD of one experiment with 4 mice per group. Data were analyzed with the Mann–Whitney U test. P < 0.05.
Figure 4
Figure 4
PC distribution and proliferative state during DENV infection. (a) DLN cryosections analyzed at days 7, 10, 14, and 21 postcutaneous inoculation with DENV (left panel) or iDENV (right panel). CD138 (green) antibody-labelled PCs, antibodies for IgD (white), and Ki-67 (red) depict GC zones and CD4 (blue) for T zone (T). Panels on the right of each group correspond to the white squares indicated on the left. PC main location is indicated with purple arrowheads for each time point. Cell suspensions from DLNs were colabelled with antibodies to surface CD138 and Ly6C and intracellularly for Ki-67. (b) Representative flow cytometry contour plots of proliferating Ki-67+ PCs at day 3 p.i. Kinetic of the proportion (c) and numbers (d) of Ki-67+ PCs in the DLN during the kinetic. Data shown represent the mean ± SEM and are representative of four independent experiments with two mice per group per time point and histology results from two experiments with four mice per group per time point. Two-way ANOVA with the Bonferroni post hoc test were used for the statistical analysis. P < 0.05, ∗∗P < 0.01, ∗∗∗P < 0.001, and ∗∗∗∗P < 0.0001.
Figure 5
Figure 5
DENV cutaneous infection induces a rapid entrance of PCs to cell cycle and a low apoptosis ratio. For cell cycle analysis by flow cytometry, cell suspensions from DLNs were colabelled with antibodies to surface CD138 and Ly6C and intranuclearly for Ki-67. The DNA was stained with Hoechst 33258. (a) Representative cell cycle gating analysis on PCs from DLN of mice 7 d p.i. with DENV or controls. (b) Percentage of PCs in each cell cycle phase during the kinetic in the DLN of mice postcutaneous inoculation with DENV, iDENV, or endotoxin-free PBS. (c) Representative cell cycle gating strategy on PCs (CD138+Ly6C+) from a DLN of mice cutaneously inoculated with DENV emphasizing the sub-G0/apoptotic population (red box). (d) Proportion of sub-G0/apoptotic PCs during the kinetic. (e) Proportion of apoptotic PCs expressing the active form of caspase-3 during the kinetic. Red dotted lines in (d) and (e) represent the mean levels in the PBS group. Data shown represent the mean ± SEM and are representative of four independent experiments with two mice per group per time point.
Figure 6
Figure 6
The affinity of IgG antibodies to DENV increases with time after infection, has neutralizing activity, and can be broadly cross-reactive. Sera of mice inoculated with DENV were obtained at days 7, 14, and 28 p.i. and analyzed by ELISA in the presence or absence of urea 7 M. (a) Graph showing the dilution curve of one representative sample per time point. Dashed lines represent the samples with urea 7 M wash. (b) At each time point, the proportion of urea-resistant anti-DENV2 IgG antibodies (high affinity, showed in grey bars) from the total anti-DENV2 IgG antibodies (indicated with dotted bars) is represented. Continuous red line represents the progressive increase in the affinity of the IgG anti-DENV2 antibodies. (c) Percent of neutralization of DENV2 with serum from DENV-inoculated mice (mice 1 to 4, m1-m4) or serum from DNP-KLH-inoculated mice as negative control of neutralization. (d) Relative serum antibody titers for SARS-CoV-2 RBD-, DENV2-, and ZIKV-specific IgG (left panel) and proportion of cross-reactive antibodies to ZIKV from sera of mice 28 d p.i. with DENV2. Data shown represent the mean ± SEM of one experiment with 4 mice per time point (a–c) and two independent experiments with 3 mice per experiment (d) (b, one-way ANOVA test with Bonferroni posttest ∗∗∗P < 0.001).

Similar articles

References

    1. Bhatt S., Gething P. W., Brady O. J., et al. The global distribution and burden of dengue. Nature. 2013;496(7446):504–507. doi: 10.1038/nature12060. - DOI - PMC - PubMed
    1. World Health Organization. Dengue and Severe Dengue. 2019. https://www.who.int/news-room/fact-sheets/detail/dengue-and-severe-dengue.
    1. Sangkawibha N., Rojanasuphot S., Ahandrik S., et al. Risk factors in dengue shock syndrome: a prospective epidemiologic study in Rayong, Thailand. I. The 1980 outbreak. American Journal of Epidemiology. 1984;120(5):653–669. doi: 10.1093/oxfordjournals.aje.a113932. - DOI - PubMed
    1. The Lancet Infectious Diseases. The dengue vaccine dilemma. The Lancet Infectious Diseases. 2018;18(2):p. 123. doi: 10.1016/S1473-3099(18)30023-9. - DOI - PubMed
    1. Aguiar M. Dengue vaccination: a more ethical approach is needed. Lancet. 2018;391(10132):1769–1770. doi: 10.1016/S0140-6736(18)30865-1. - DOI - PubMed

MeSH terms