

Resting-state brain networks in neonatal hypoxic-ischemic brain damage: a functional near-infrared spectroscopy study
- PMID: 33997105
- PMCID: PMC8119736
- DOI: 10.1117/1.NPh.8.2.025007
Resting-state brain networks in neonatal hypoxic-ischemic brain damage: a functional near-infrared spectroscopy study
Abstract
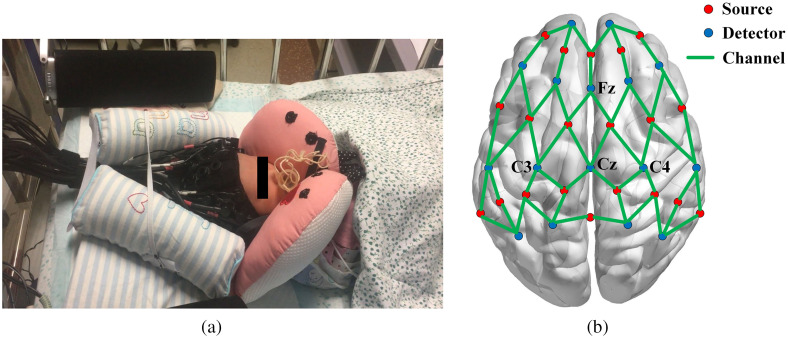
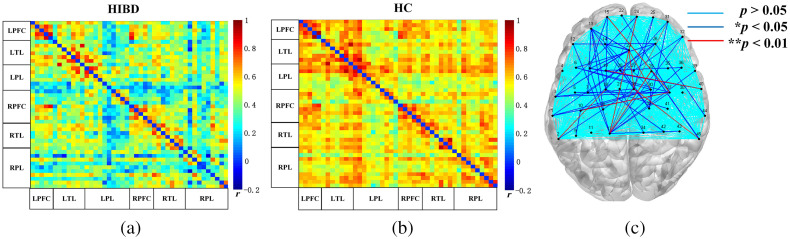
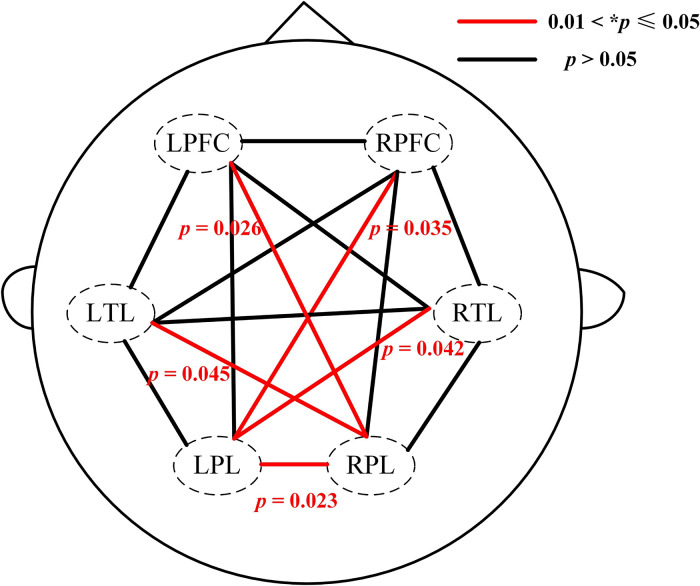
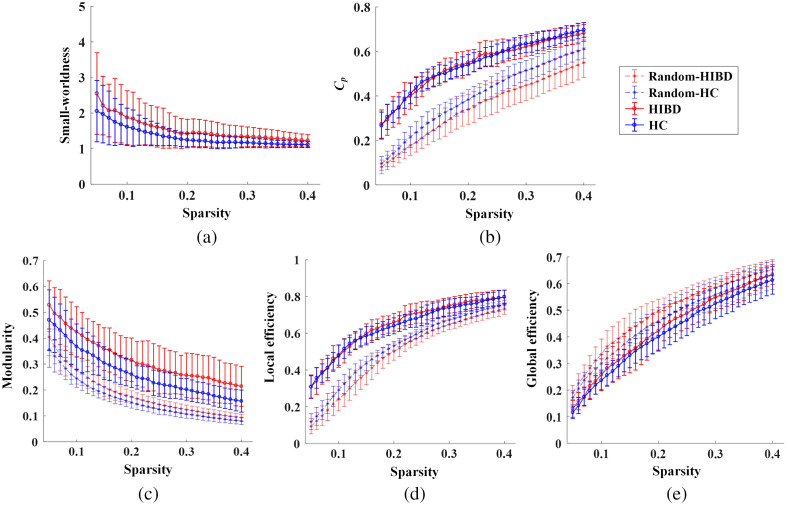
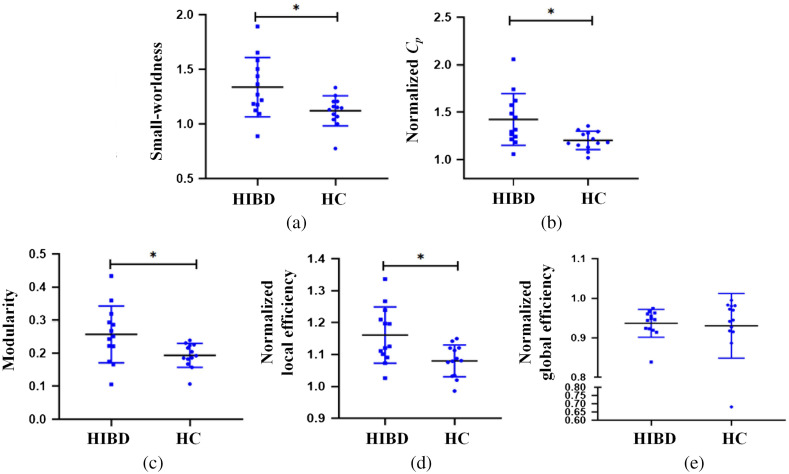
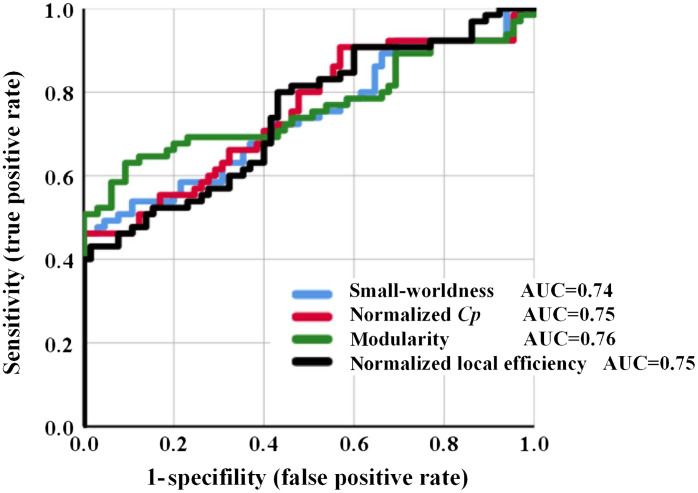
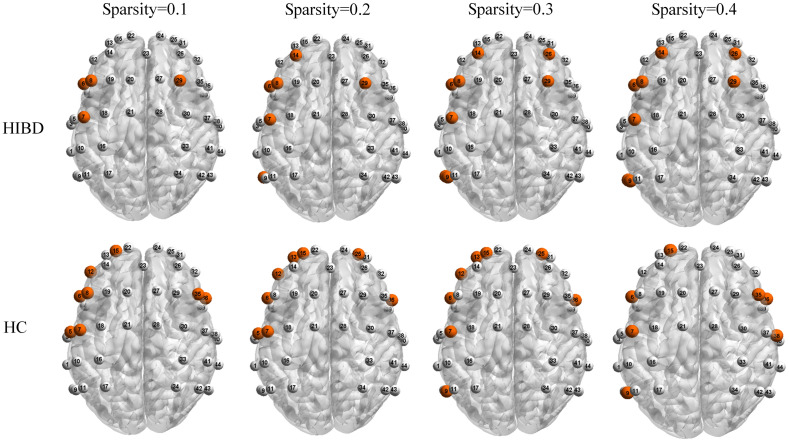
Significance: There is an emerging need for convenient and continuous bedside monitoring of full-term newborns with hypoxic-ischemic brain damage (HIBD) to determine whether early intervention is required. Functional near-infrared spectroscopy (fNIRS)-based resting-state brain network analysis, which could provide an effective evaluation method, remains to be extensively studied. Aim: Our study aims to verify the feasibility of fNIRS-based resting-state brain networks for evaluating brain function in infants with HIBD to provide a new and effective means for clinical research in neonatal HIBD. Approach: Thirteen neonates with HIBD were scanned using fNIRS in the resting state. The brain network properties were explored to attempt to extract effective features as recognition indicators. Results: Compared with healthy controls, newborns with HIBD showed decreased brain functional connectivity. Specifically, there were severe losses of long-range functional connectivity of the contralateral parietal-temporal lobe, contralateral parietal-frontal lobe, and contralateral parietal lobe. The node degree showed a widespread decrease in the left frontal middle gyrus, left superior frontal gyrus dorsal, and right central posterior gyrus. However, newborns with HIBD showed a significantly higher local network efficiency (* ). Subsequently, network indicators based on small-worldness, local efficiency, modularity, and normalized clustering coefficient were extracted for HIBD identification with the accuracy observed as 79.17%. Conclusions: Our findings indicate that fNIRS-based resting-state brain network analysis could support early HIBD diagnosis.
Keywords: brain network; functional near-infrared spectroscopy; hypoxic-ischemic brain damage; infants; resting state.
© 2021 The Authors.
Figures
Similar articles
-
[Research progress on brain functional near-infrared spectroscopy technology in the field of neonates].Zhongguo Dang Dai Er Ke Za Zhi. 2024 Jan 15;26(1):86-91. doi: 10.7499/j.issn.1008-8830.2309002. Zhongguo Dang Dai Er Ke Za Zhi. 2024. PMID: 38269465 Free PMC article. Review. Chinese.
-
Associations between maternal prenatal depression and neonatal behavior and brain function - Evidence from the functional near-infrared spectroscopy.Psychoneuroendocrinology. 2022 Dec;146:105896. doi: 10.1016/j.psyneuen.2022.105896. Epub 2022 Aug 23. Psychoneuroendocrinology. 2022. PMID: 36037574
-
Altered resting-state functional connectivity in newborns with hypoxic ischemic encephalopathy assessed using high-density functional near-infrared spectroscopy.Sci Rep. 2024 Feb 7;14(1):3176. doi: 10.1038/s41598-024-53256-0. Sci Rep. 2024. PMID: 38326455 Free PMC article.
-
Early screening model for mild cognitive impairment based on resting-state functional connectivity: a functional near-infrared spectroscopy study.Neurophotonics. 2022 Oct;9(4):045010. doi: 10.1117/1.NPh.9.4.045010. Epub 2022 Dec 6. Neurophotonics. 2022. PMID: 36483024 Free PMC article.
-
Resting-state functional brain connectivity: lessons from functional near-infrared spectroscopy.Neuroscientist. 2014 Apr;20(2):173-88. doi: 10.1177/1073858413502707. Epub 2013 Sep 10. Neuroscientist. 2014. PMID: 24022325 Review.
Cited by
-
[Research progress on brain functional near-infrared spectroscopy technology in the field of neonates].Zhongguo Dang Dai Er Ke Za Zhi. 2024 Jan 15;26(1):86-91. doi: 10.7499/j.issn.1008-8830.2309002. Zhongguo Dang Dai Er Ke Za Zhi. 2024. PMID: 38269465 Free PMC article. Review. Chinese.
-
Functional brain network alterations in the co-occurrence of autism spectrum disorder and attention deficit hyperactivity disorder.Eur Child Adolesc Psychiatry. 2024 Feb;33(2):369-380. doi: 10.1007/s00787-023-02165-0. Epub 2023 Feb 17. Eur Child Adolesc Psychiatry. 2024. PMID: 36800038
-
Effectiveness of Tai Chi Yunshou motor imagery training for hemiplegic upper extremity motor function in poststroke patients: study protocol for a randomized clinical trial.Trials. 2022 Apr 21;23(1):329. doi: 10.1186/s13063-022-06283-z. Trials. 2022. PMID: 35449109 Free PMC article.
-
Motion artifact correction for resting-state neonatal functional near-infrared spectroscopy through adaptive estimation of physiological oscillation denoising.Neurophotonics. 2022 Oct;9(4):045002. doi: 10.1117/1.NPh.9.4.045002. Epub 2022 Oct 22. Neurophotonics. 2022. PMID: 36284541 Free PMC article.
-
The functional near infrared spectroscopy applications in children with developmental diseases: a review.Front Neurol. 2025 Jun 17;16:1495138. doi: 10.3389/fneur.2025.1495138. eCollection 2025. Front Neurol. 2025. PMID: 40599736 Free PMC article. Review.
References
LinkOut - more resources
Full Text Sources
Other Literature Sources
