

Microbiome data analysis with applications to pre-clinical studies using QIIME2: Statistical considerations
- PMID: 33997168
- PMCID: PMC8099687
- DOI: 10.1016/j.gendis.2019.12.005
Microbiome data analysis with applications to pre-clinical studies using QIIME2: Statistical considerations
Abstract
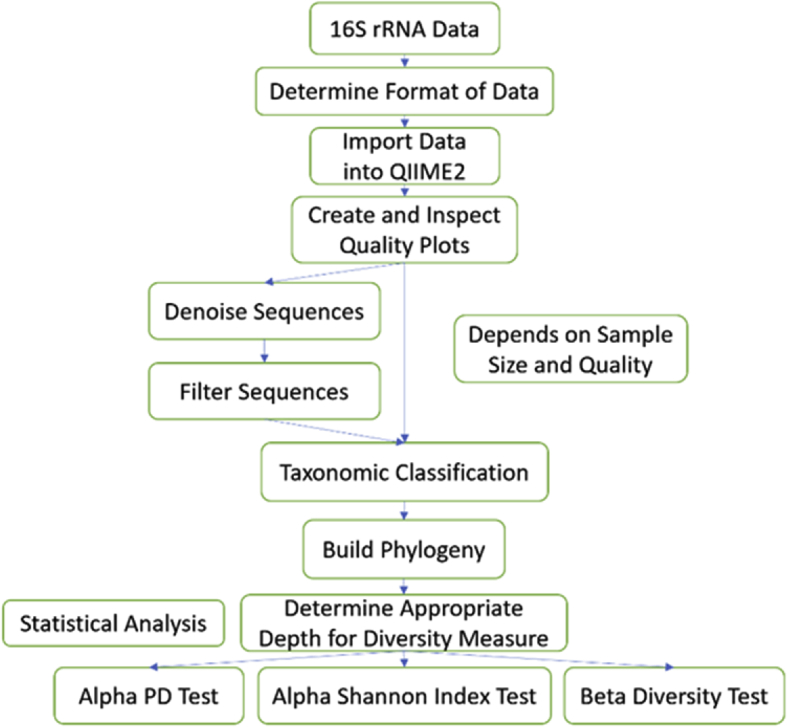
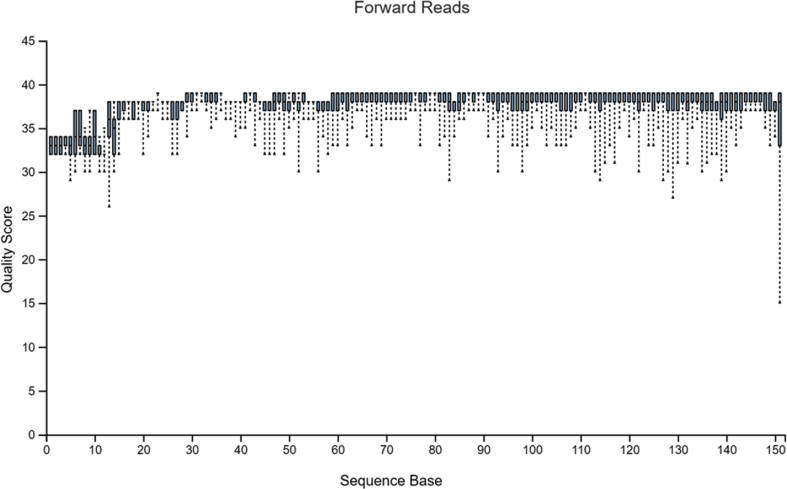
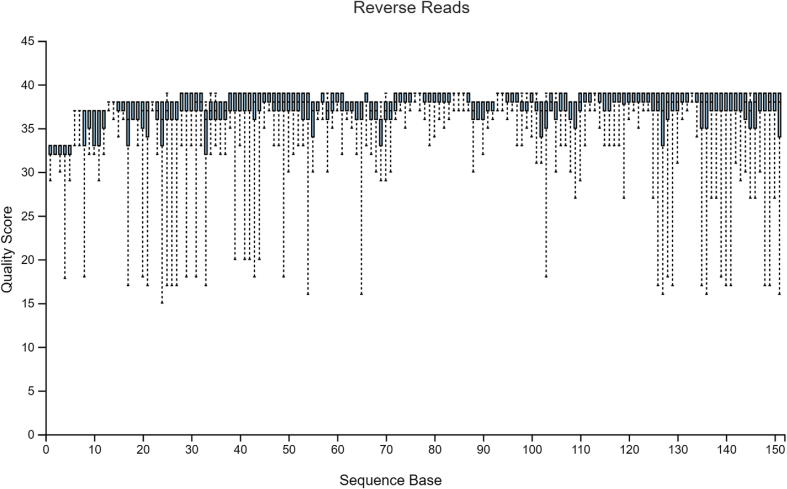
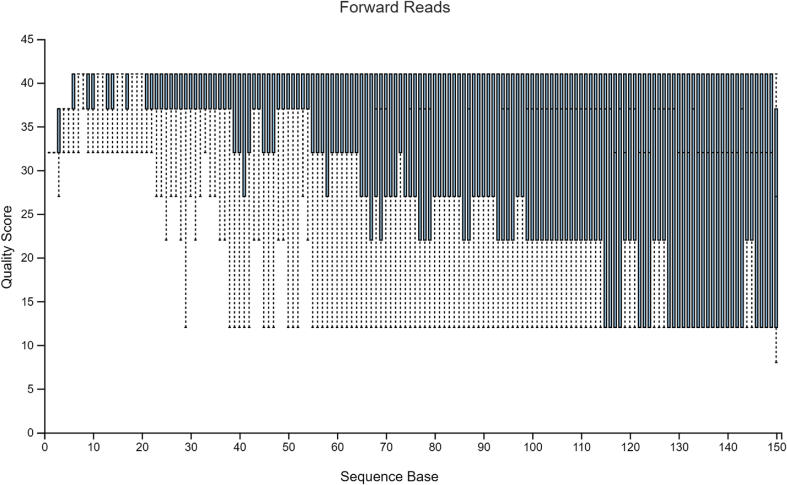
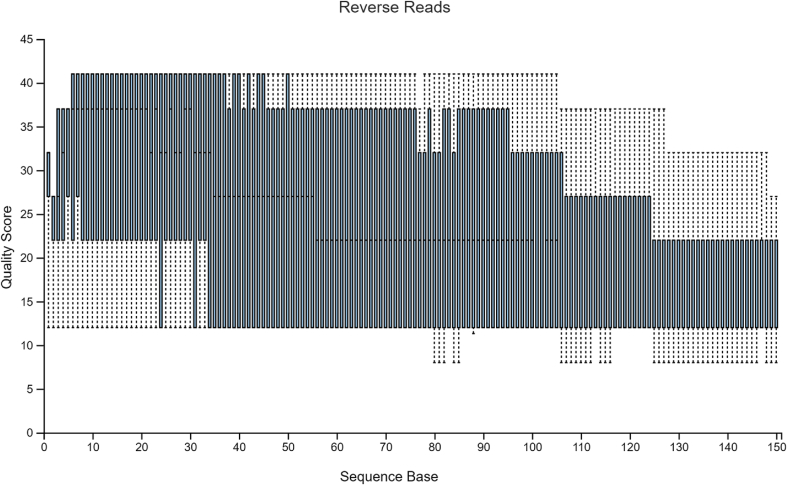
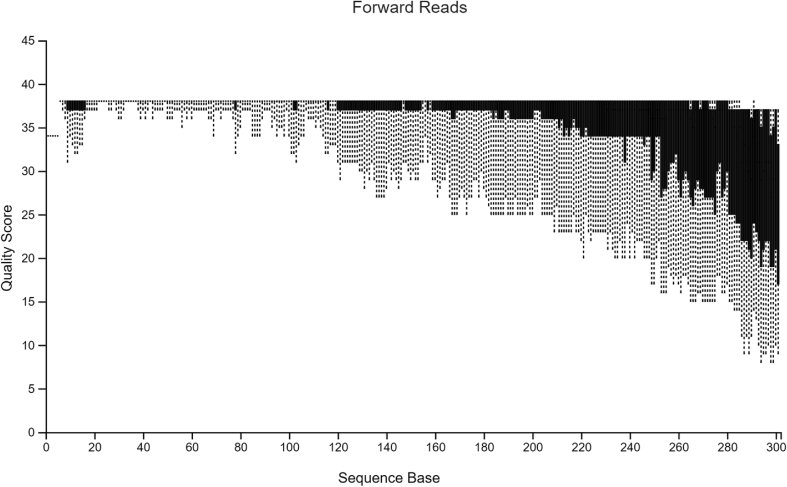
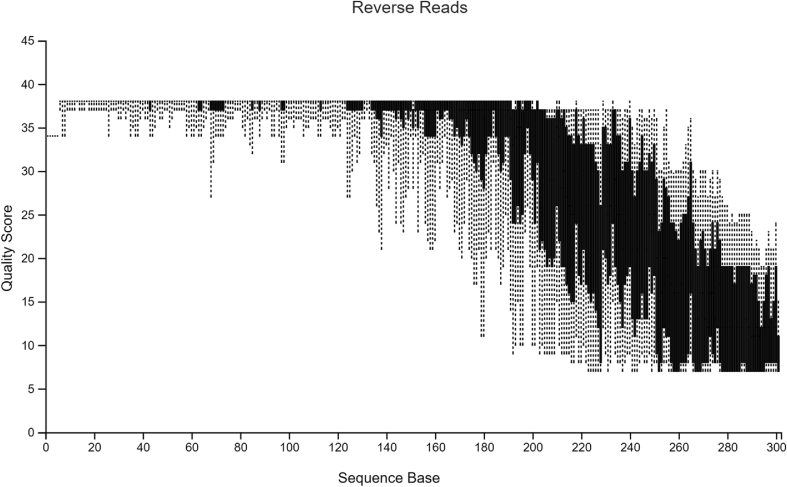
Diversity analysis and taxonomic profiles can be generated from marker-gene sequence data with the help of many available computational tools. The Quantitative Insights into Microbial Ecology Version 2 (QIIME2) has been widely used for 16S rRNA data analysis. While many articles have demonstrated the use of QIIME2 with suitable datasets, the application to pre-clinical data has rarely been talked about. The issues involved in the pre-clinical data include the low-quality score and small sample size that should be addressed properly during analysis. In addition, there are few articles that discuss the detailed statistical methods behind those alpha and beta diversity significance tests that researchers are eager to find. Running the program without knowing the logic behind it is extremely risky. In this article, we first provide a guideline for analyzing 16S rRNA data using QIIME2. Then we will talk about issues in pre-clinical data, and how they could impact the outcome. Finally, we provide brief explanations of statistical methods such as group significance tests and sample size calculation.
Keywords: 16S rRNA gene; ANOVA; Alpha diversity; Beta diversity; Bioinformatics; Microbiome data; QIIME; Sample size calculation.
© 2020 Chongqing Medical University. Production and hosting by Elsevier B.V.
Figures
References
-
- Hall M., Beiko R.G. 16S rRNA gene analysis with QIIME2. Methods in Molecular Biology. 2018;1849:113–129. - PubMed
LinkOut - more resources
Full Text Sources
