Review
. 2021 Apr 27;6(11):4209-4242.
doi: 10.1016/j.bioactmat.2021.04.021. eCollection 2021 Nov.

MoS2-based nanocomposites for cancer diagnosis and therapy

Affiliations
Review

MoS2-based nanocomposites for cancer diagnosis and therapy

Jianling Wang et al. Bioact Mater. .

Abstract

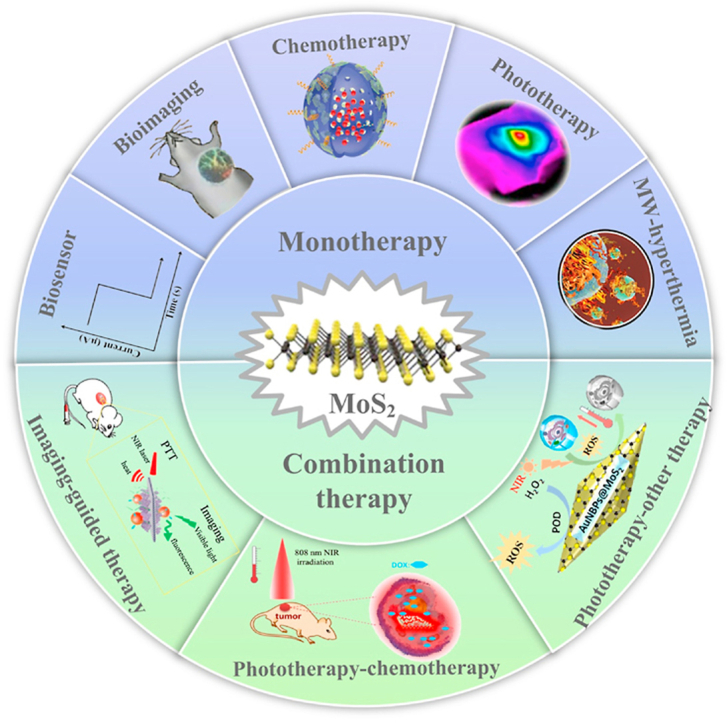
Molybdenum is a trace dietary element necessary for the survival of humans. Some molybdenum-bearing enzymes are involved in key metabolic activities in the human body (such as xanthine oxidase, aldehyde oxidase and sulfite oxidase). Many molybdenum-based compounds have been widely used in biomedical research. Especially, MoS2-nanomaterials have attracted more attention in cancer diagnosis and treatment recently because of their unique physical and chemical properties. MoS2 can adsorb various biomolecules and drug molecules via covalent or non-covalent interactions because it is easy to modify and possess a high specific surface area, improving its tumor targeting and colloidal stability, as well as accuracy and sensitivity for detecting specific biomarkers. At the same time, in the near-infrared (NIR) window, MoS2 has excellent optical absorption and prominent photothermal conversion efficiency, which can achieve NIR-based phototherapy and NIR-responsive controlled drug-release. Significantly, the modified MoS2-nanocomposite can specifically respond to the tumor microenvironment, leading to drug accumulation in the tumor site increased, reducing its side effects on non-cancerous tissues, and improved therapeutic effect. In this review, we introduced the latest developments of MoS2-nanocomposites in cancer diagnosis and therapy, mainly focusing on biosensors, bioimaging, chemotherapy, phototherapy, microwave hyperthermia, and combination therapy. Furthermore, we also discuss the current challenges and prospects of MoS2-nanocomposites in cancer treatment.

Keywords: Bioimaging; Biosensor; Cancer; Chemotherapy; Combination therapy; Microwave hyperthermia; MoS2; Phototherapy.


Conflict of interest statement

The authors declare no conflict of interest, financial or otherwise.

Figures

Image 1
Graphical abstract
Fig. 1
Fig. 1
(a) Structure of a single molybdenum disulphide molecule and an elemental unit of molybdenum disulphide film. Reprinted with permission from Ref. [13]. Copyright 2019, Journal of Physics D: Applied Physics. (b) Three dimensional representation of the structure of MoS2. Reprinted with permission from Ref. [14]. Copyright 2011, Nature Nanotechnology. (c) Schematics of the structural polytypes: 1T (tetragonal symmetry, one layer per repeat unit, octahedral coordination), 2H (hexagonal symmetry, two layers per repeat unit, trigonal prismatic coordination) and 3R (rhombohedral symmetry, three layers per repeat unit, trigonal prismatic coordination). Reprinted with permission from Ref. [15]. Copyright 2012, Nature Nanotechnology.
Fig. 2
Fig. 2
(a) The pseudo-double-gate structure of a MoS2 biosensor. (b) Optical image of the MoS2 bio-FET with insets representing a tapping-mode AFM image and its thickness profile. Shifts in the transfer curves for the MoS2 bio-FET immobilized with (c) anti-PSA of 100 μg/mL, (d) PSA of 100 ng/mL and, (e) casein of 1% (w/v). (f) Transfer characteristics with PSA concentrations from 100 fg/mL to 1 ng/mL on the anti-PSA-immobilized MoS2 bio-FET. (g) Plot of VTH against PSA concentrations. Reprinted with permission from Ref. [42]. Copyright 2017, ACS Applied Materials & Interfaces.
Fig. 3
Fig. 3
(a) Schematic of ssDNA-MoS2-PEG-FA probe-based FRET platform for intracellular miRNA-21 detection. (b) Photoluminescence spectra of FAM-labeled miRNA-21 probes incubated with MoS2 nanosheets with a series of concentrations. Reprinted with permission from Ref. [59]. Copyright 2018, ACS Applied Materials & Interfaces. (c) Schematic illustration showing the construction of the F–MoS2 NSs and pH-dependent FRET, which is mediated by a conformation change of poly (DEA-r-BMA). (d) PL spectra of F–MoS2 NSs at three different pH values of 7.4, 7.0, and 6.0. Insets are the corresponding confocal microscopy images of the solution. Scale bars are 100 μm. (e) Series of overlaid bright-field and fluorescence confocal microscopy images (top) and confocal microscopy images (bottom) showing the progressive enhancement of fluorescence intensity in the microcapsules during the growth of A549 tumor cells. Scale bars are 200 μm. Reprinted with permission from Ref. [63]. Copyright 2018, ACS Applied Materials & Interfaces.
Fig. 4
Fig. 4
(a) The fabrication of AuE/SC/FA for CTC capture. (b) Schematic model of HeLa cell binding with FA and repelling NC on a negatively charged AuE/SC/FA electrode surface. (c) The corresponding impedance curves. SC: Semiconductor; AuE: gold electrode; BSA: albumin from bovine serum; CTC: circulating tumor cells; FA: folic acid; NC: normal cells with low folic receptor expression. (d) Relative impedance at 10 Hz with time for AuE/MoS2/FA electrodes scanned while being immersed in HeLa cell with different concentrations in PBS. The grey solid lines indicate fittings using exponential association. (e) Calibration plots of relative impedance at 10 min for determining HeLa cells at AuE/MoS2/FA electrodes while changing the concentration of HeLa cell in PBS. (f) Relative impedance at 10 min at AuE/MoS2/FA electrodes for PBS, 10% FBS solution, MC3T3-E1 cell suspension, HeLa cell suspension and the mixture of all, indicating a good selectivity of AuE/MoS2/FA electrodes. (g) Relative impedance at 10 min at AuE/MoS2/FA electrodes for HeLa, MCF-7, MG-63 and SMMC-7721 cancer cell suspensions. Three replicates were performed. Reprinted with permission from Ref. [111]. Copyright 2019, Biosensors & Bioelectronics.
Fig. 5
Fig. 5
(a) Effective attenuation coefficient of various biological components, including oxygenated blood, deoxygenated blood, skin, and fatty tissue. Reprinted with permission from Ref. [135]. Copyright 2019, Trends in Chemistry. (b) The optical penetration depth of light into skin over the wavelength range from 400 to 2000 nm. Reprinted with permission from Ref. [136]. Copyright 2005, Journal of Physics D: Applied Physics. The penetration depth of (c) common FL imaging (d) NIRF imaging (e) TPF imaging (f) PA imaging, respectively.
Fig. 6
Fig. 6
(a) The preparation of RGD-QD-MoS2 NSs. (b) Ultravioletvisible-near infrared (UV–Vis–NIR) absorption spectra of MoS2 NSs, BPM NSs, and RGD-QD-MoS2 NSs. (c) Normalized photoluminescence spectra of RGD-QD-MoS2 NSs. (d) Fluorescence images of HeLa tumor-bearing Balb/c nude mice at different times after i. v. injection of RGD-QD655-MoS2 NSs. Reprinted with permission from Ref. [139]. Copyright 2017, Nanoscale. (e) The multiphoton luminescence image of HeLa and HaCaT cells with internalized MoS2 QDs. Excitation wavelength was 700 nm and detection wavelength in the 420–460 nm range. Reprinted with permission from Ref. [140] Copyright 2015, Small. (f) TPL intensity of the MoS2 QDs at 1064 nm excitation. (g) Variation in the TPL intensity with time, indicating that anti-PSMA antibody-attached MoS2 QDs exhibit very good photostability. For this experiment, we used a laser power density of 40 W/cm2. Reprinted with permission from Ref. [141] Copyright 2017, ACS omega.
Fig. 7
Fig. 7
(a) In vitro PA images of DMNFPPL with different concentrations. (b) Real-time PA images of 4T1 tumor-bearing mice at different time points after intravenous administration of DMNFPP and DMNFPPL. (c) The curves of PA signal rate changed with administration time periods. Reprinted with permission from Ref. [167]. Copyright 2020, International journal of pharmaceutics. (d) Schematic illustration of the synthesis procedure of MoS2 nanosheets with various layered nanostructures. (e) The PA signals produced by S–MoS2, F–MoS2, and M − MoS2 and (f) their quantitative results. (g) PA images of S–MoS2, F–MoS2, and M − MoS2 in subcutaneous tissue of mice and (h) their quantitative results. 1: Control group, 2: M − MoS2 treated group, 3: F–MoS2 treated group, 4: S–MoS2 treated group. Reprinted with permission from Ref. [170]. Copyright 2016, Advanced functional materials.
Fig. 8
Fig. 8
(a) In vivo CT images of 4T1 tumor-bearing mice before and 6 h after intravenous injection with PEG-MoS2-Au-Ce6 nanocomposites, tumor (T) and liver (L). (b) In vivo CT images of tumors on mice before and 6 h after intravenous injection with PEG-MoS2-Au-Ce6 nanocomposites. (c) Corresponding HU value of PEG-MoS2-Au-Ce6 nanocomposites in the tumor before injection and 6 h after injection. Reprinted with permission from Ref. [175]. Copyright 2017, Journal of materials chemistry. (d) Scheme presenting the 64Cu labeling on MoS2-IO-(d)PEG via a chelator-free manner. (e) PET images of 4T1 tumor-bearing mice taken at various time points post iv injection of 64Cu-MoS2-IO-(d)PEG. The blue dot circles highlight the 4T1 tumor site of mice. (f) Quantification of 64Cu-MoS2-IO-(d)PEG uptake in the tumor and muscle, as well as the tumor/muscle (T/M) ratio at various time points pi. Reprinted with permission from Ref. [177]. Copyright 2015, ACS nano. (g) In vivo T1-weighted MR images of Balb/c mice after injection at different time points (pre-injection, 1 h, 2 h, 4 h, 8 h). Reprinted with permission from Ref. [178]. Copyright 2018, Journal of materials chemistry.
Fig. 9
Fig. 9
(a) Fluorescence images of nude mice at different time points after administration of free Ce6 and MSNR@MoS2-HSA/Ce6; the right panel shows the ex vivo images examined at 24 h. (b) Average fluorescence signals of Ce6 in major organs examined at 24 h. (c) MSOT images of 4T1 tumor-bearing mice after being intravenously injected with MSNR@MoS2-HSA/Ce6. (d) Photoacoustic intensity linearly fit to the concentration of MSNR@MoS2-HSA/Ce6 aqueous solutions; inset: the corresponding PA images. (e) CT images of tumor site before and after intratumor injection with MSNR@MoS2-HSA/Ce6. (f) Corresponding HU value of MSNR@MoS2-HSA/Ce6 nanocomposites in the tumor before injection and 12 h after injection. Reprinted with permission from Ref. [193]. Copyright 2019, Theranostics.
Fig. 10
Fig. 10
(a) Schematic illustration of single-layered MoS2-based nanoplate as a NIR-responsive system. NIR-induced cytotoxicity of DOX-PSMS-PEG or PSMS-PEG against (b) HeLa and (c) HCT-8 cell line (**p < 0.01, ***p < 0.001). (d) Confocal microscopic images of DOX-PSMS-PEG treated HeLa cells which were further irradiated or not irradiated by 808 nm laser (5 W/cm2). Nucleus was stained by DAPI (blue) and DOX was false-imaged as red (scale bar = 50 μm). (e) Photoresponsive drug release of DOX from DOX-PSMS-PEG in vitro. Reprinted with permission from Ref. [206]. Copyright 2016, Chemistry of Materials.
Fig. 11
Fig. 11
(a) Schematic illustration of PTT, mouse was intravenously injected with MD80-PEG dispersion and irradiated with NIR laser. (b) Cell viability assay of 4T1 cells after treated with or without 808 nm NIR laser (5 min, 1 W/cm2), cells were pre-incubated with MD80-PEG (0.5 mg/mL) for 4 h before laser irradiating (mean ± SD, n = 3). Reprinted with permission from Ref. [240]. Copyright 2015, Biomaterials. (c) The temperature elevation of LMHSs with different concentrations under the NIR laser irradiation. (d) The photothermal response of the LMHSs aqueous solution with NIR laser irradiation and then the laser was shut off. Reprinted with permission from Ref. [242]. Copyright 2016, Small.
Fig. 12
Fig. 12
(a) Schematic illustration of the fabrication of p-MoS2/n-rGO-MnO2-PEG nanosheets. While the hybrid nanosheets generate ROS via electron-hole separation under 980 nm laser irradiation, the MnO2 NPs trigger the decomposition of endogenous H2O2 into O2, simultaneously enhancing the PDT effect. (b) Merged epifluorescence microscopy images of HeLa cells co-stained with fluorescein diacetate (green emission for live cells) and PI (red emission for dead cells) under 0.4 W/cm2 laser irradiation for 5 min. Reprinted with permission from Ref. [262]. Copyright 2018, Chemical Science.
Fig. 13
Fig. 13
(a) Schematic illustration of the MSMC used for the microwave ablation and the TAC therapy. (b) Near-infrared thermography images with different MW susceptible agents. (c) Infrared thermal imaging of mice bearing H22 cells after the intratumoral injection of MSMC, MoS2 nanosheets, and saline at 50 mg/kg under the MW irradiation for 5 min at 5 W. (d) The changes of tumor volume and (e) body weight of the mice in different groups. (f) Tumor tissues removed from the mice and (g) tumor inhibition rate of different groups at 23 day. **p < 0.01. Reprinted with permission from Ref. [280]. Copyright 2017, Nanoscale.
Fig. 14
Fig. 14
In vivo fluorescence and PA imaging of HA-MoS2 conjugates. (a) IVIS imaging of PBS and HA-MoS2 conjugates after intradermal injection into the tumor (red circle) region. (b) Quantitative fluorescence analysis of PEG-MoS2 and HA-MoS2 conjugates in the organs for the assessment of tumor targeting affinity (**p < 0.01, PEG-MoS2 vs HA-MoS2 conjugates). (c) The PA amplitude enhancement of HA-MoS2 conjugates compared to the control (PBS) image at both 680 and 850 nm wavelengths with the depth profile of the highest signals for 240 min. (d) A photo-image and PA MAP image of mouse in respect to depth (left) and amplitude (right) before injection of HA-MoS2 conjugates. The PA signals at 30 and 240 min after intratumoral injection of HA-MoS2 conjugates at (e) 680 and (f) 850 nm wavelengths in respect to depth (upper) and intensity (bottom). Reprinted with permission from Ref. [293]. Copyright 2019, Advanced Healthcare Materials. g) ATPMCD (ATPMC nanoplatform loaded with DOX) for multimodality bioimaging and NIR-laser irradiation-induced chemotherapy. Reprinted with permission from Ref. [295]. Copyright 2017, Advanced Functional Materials.
Fig. 15
Fig. 15
(a) Schematic illustration of the fabrication process of IOMS-PEG(DOX)-2DG NCs for MRI-guided chemo-photothermal therapy of cancer. (b1) and (b2) SEM and TEM images of IO clusters. (c1) and (c2) SEM and TEM images of IOMS NCs. (d1) and (d2) SEM and TEM images of IOMS-PEG NCs. Reprinted with permission from Ref. [303]. Copyright 2018, Nano Research.
Fig. 16
Fig. 16
(a) Schematic illustration of MoS2/HSA-DOX nanocapsules targeting a cancer cell surface receptor (gp60) and their transcytosis into the cytoplasm. After irradiation, MoS2 generates heat, and free DOX is released, achieving synergistic photothermal-chemotherapeutic efficacy. Reprinted with permission from Ref. [328]. Copyright 2018, Advanced Functional Materials. (b) Relative viabilities of KB cells after various treatments indicated. In this experiment, KB cells were incubated with MoS2-PEG, MoS2-PEG-FA, free DOX, MoS2-PEG/DOX and MoS2-PEG-FA/DOX for 1 h, and then irradiated with the 808-nm laser at different power densities for 5 min or kept dark as controls. Afterwards cells were washed with PBS, placed into fresh cell medium, re-incubated for additional 24 h before the MTT assay. Error bars were based on four parallel samples. (c) Scheme of combination therapy based on intratumorally injected MoS2-PEG/DOX. (d) IR thermal images of 4T1 tumor-bearing mice recorded by an IR camera. The doses of DOX and MoS2-PEG were 5 mg/kg and 3.4 mg/kg, respectively, in this experiment. Laser irradiation was conduced by using 808-nm NIR laser at the power density of 0.56 W/cm2 for 20 min on the tumors. (e) Temperature change of tumors monitored by the IR thermal camera in different groups during laser. (f) Tumor volume growth curves of different groups of mice after various treatments (5 mice for each group). Reprinted with permission from Ref. [68]. Copyright 2014, Advanced Materials.
Fig. 17
Fig. 17
(a) Scheme of MoS2@PANI nanohybrids used for dual modal imaging and combined PTT and RT therapy. (b) Tumor growth in different groups of mice after various treatments. Reprinted with permission from Ref. [189]. Copyright 2016, ACS Applied Materials & Interfaces. (c) Schematic illustrations of the bifunctions of tumor therapy and tissue regeneration of MoS2 nanosheets grew on 3D-printed bioceramic scaffolds. Micro-CT analysis for the bone regeneration after implanting with MoS2-modified akermanite (MS-AKT) (d), (e) and AKT (f), (g) scaffolds in the critical-sized femoral defects of rabbits for 8 weeks. Red color stands for the formation of new bone (e), (g). Histological analysis of MS-AKT (h), (i) and AKT (j), (k) scaffolds by Van Gieson staining after implanting for 8 weeks. Reprinted with permission from Ref. [346]. Copyright 2017, NPG Asia Materials. (l) Schematic illustrations of G5-MoS2/Bcl-2 siRNA used for the gene therapy and PTT. (m) Survival rate of the tumor-bearing mice after different treatments at different time periods and (n) relative tumor volume. Reprinted with permission from Ref. [363]. Copyright 2017, ACS Applied Materials & Interfaces.
Fig. 18
Fig. 18
(a) The fabrication process of FPMF nanocomposites and the mechanism of anti-tumor immune responses by FPMF@CpG ODN nanocomposites by combining immunotherapy, CDT, and PTT for anticancer therapeutic applications. (b) Fluorescence microscopy images of DCFH-DA labeled 4T1, HeLa, MCF-7 and L02 cells incubated with FPMF NPs for 6 h at the Fe concentration of 80 mg/mL. (c) Viabilities of 4T1 and L02 cells treated with different times at the same Fe concentration of 80 mg/mL. (d) The volume of tumors in tumor-bearing mice during different treatments. (Group: A: PBS, B: PBS + laser, C: MoS2-FA, D: MoS2-FA + laser, E: FePt-FA, F: FePt-FA + laser, G: FePt/MoS2-FA, and H: FePt/MoS2-FA + laser, n = 5). Reprinted with permission from Ref. [374]. Copyright 2019, Nanoscale.

Similar articles

Cited by

References

    1. Bray F., Ferlay J., Soerjomataram I., Siegel R.L., Torre L.A., Jemal A. Global cancer statistics 2018: GLOBOCAN estimates of incidence and mortality worldwide for 36 cancers in 185 countries. CA A Cancer J. Clin. 2018;68(6):394–424. - PubMed
    1. Lu Z., Peng Z., Liu C., Wang Z., Wang Y., Jiao X., Li J., Shen L. Current status and future perspective of immunotherapy in gastrointestinal cancers. Innovation. 2020;1(2):100041. - PMC - PubMed
    1. Ferlay J., Colombet M., Soerjomataram I., Mathers C., Parkin D.M. Vol. 144. 2019. pp. 1941–1953. (Estimating the global cancer incidence and mortality in 2018: GLOBOCAN sources and methods). 8. - PubMed
    1. Hu Y., Mignani S., Majoral J.P., Shen M., Shi X. Construction of iron oxide nanoparticle-based hybrid platforms for tumor imaging and therapy. Chem. Soc. Rev. 2018;47(5):1874–1900. - PubMed
    1. Wang Z., Qiao R., Tang N., Lu Z., Wang H., Zhang Z., Xue X., Huang Z., Zhang S., Zhang G., Li Y. Active targeting theranostic iron oxide nanoparticles for MRI and magnetic resonance-guided focused ultrasound ablation of lung cancer. Biomaterials. 2017;127:25–35. - PMC - PubMed

LinkOut - more resources