. 2021 Mar 17;6(4):365-380.
doi: 10.1016/j.jacbts.2021.01.001. eCollection 2021 Apr.

FYCO1 Regulates Cardiomyocyte Autophagy and Prevents Heart Failure Due to Pressure Overload In Vivo

Affiliations

FYCO1 Regulates Cardiomyocyte Autophagy and Prevents Heart Failure Due to Pressure Overload In Vivo

Christian Kuhn et al. JACC Basic Transl Sci. .

Abstract

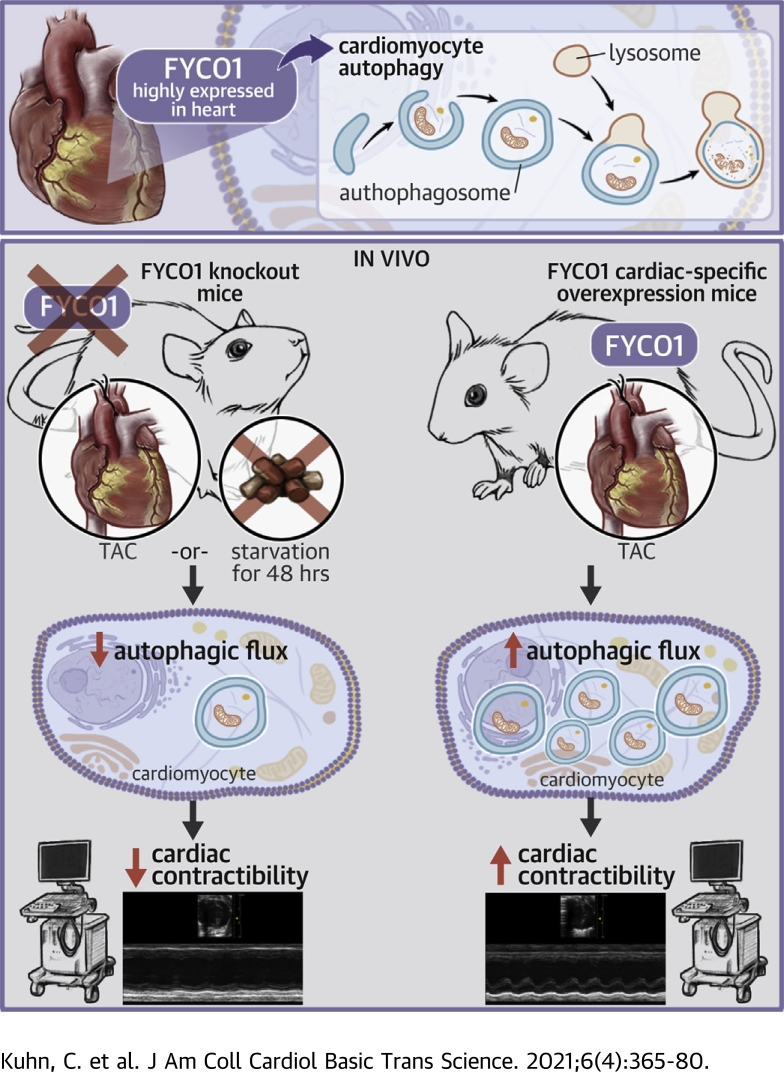
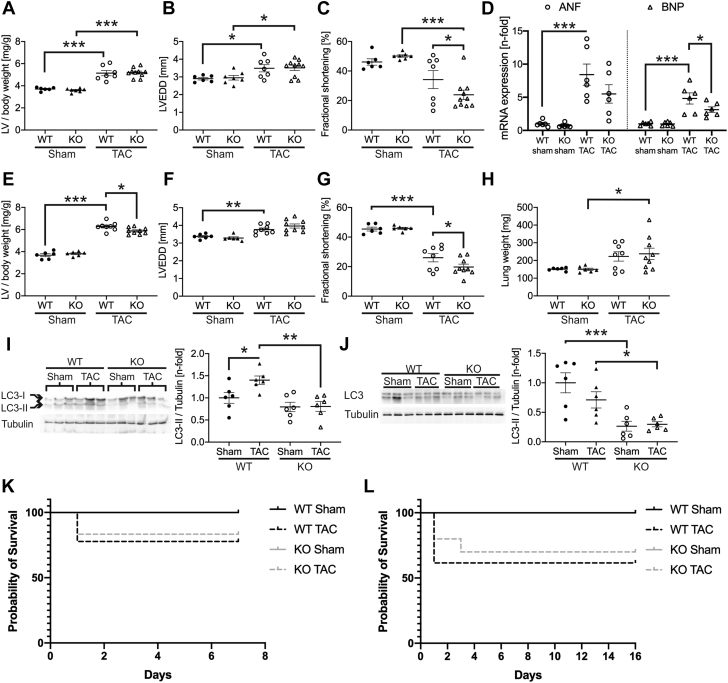
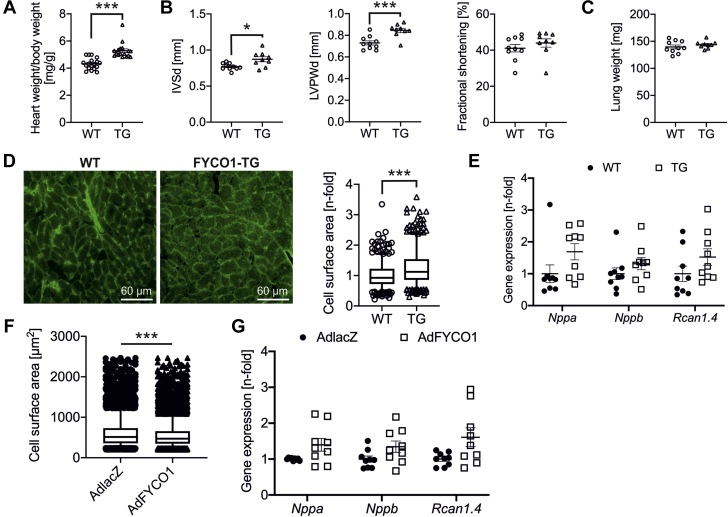
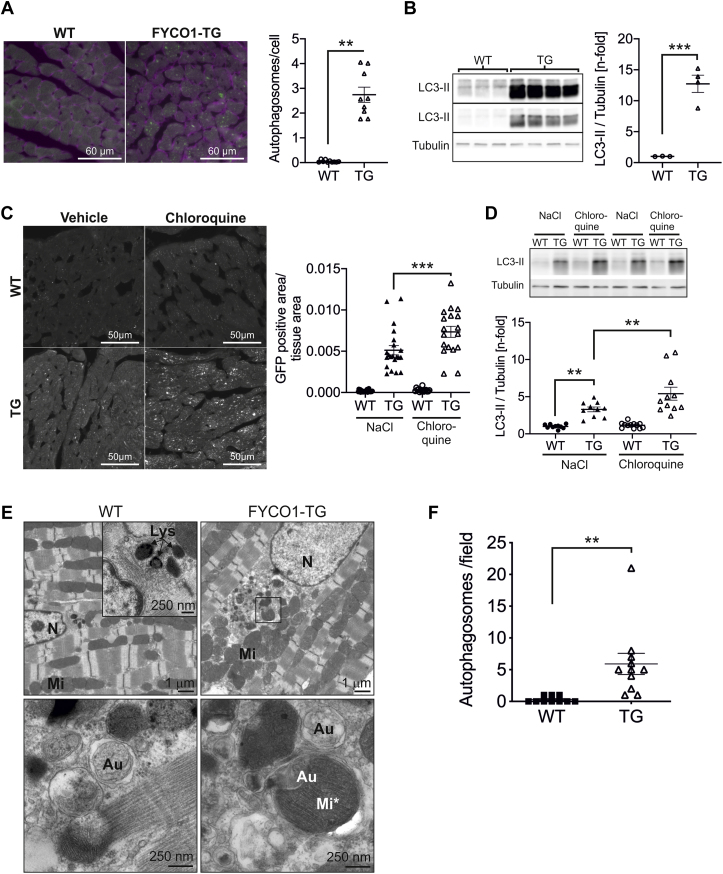
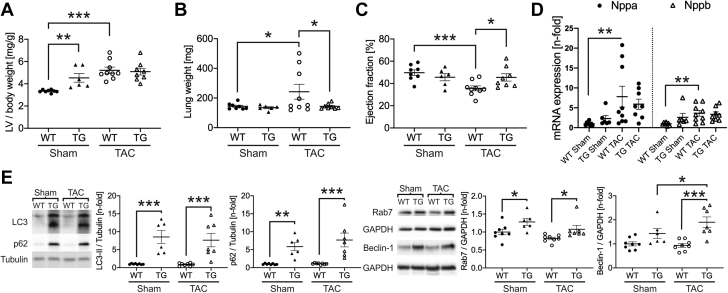
Autophagy is a cellular degradation process that has been implicated in diverse disease processes. The authors provide evidence that FYCO1, a component of the autophagic machinery, is essential for adaptation to cardiac stress. Although the absence of FYCO1 does not affect basal autophagy in isolated cardiomyocytes, it abolishes induction of autophagy after glucose deprivation. Likewise, Fyco1-deficient mice subjected to starvation or pressure overload are unable to respond with induction of autophagy and develop impaired cardiac function. FYCO1 overexpression leads to induction of autophagy in isolated cardiomyocytes and transgenic mouse hearts, thereby rescuing cardiac dysfunction in response to biomechanical stress.

Keywords: BFA, bafilomycin A1; CSA, cell surface area; FYCO1; GFP, green fluorescent protein; KO, knockout; MHC, myosin heavy chain; NRCM, neonatal rat cardiomyocytes; RFP, red fluorescent protein; TAC, transverse aortic constriction; TG, transgenic; WT, wild-type; autophagy; heart failure; mRNA, messenger ribonucleic acid; microRNA, micro–ribonucleic acid.


Conflict of interest statement

The authors have reported that they have no relationships relevant to the contents of this paper to disclose.

Figures

None
Graphical abstract
Figure 1
Figure 1
Overexpression of FYCO1 Induces Autophagy In Vitro (A) FYCO1 (FYVE and coiled-coil domain-containing protein 1) messenger RNA (mRNA) (data are presented as dot plots with median and 25th and 75th percentiles; Mann-Whitney rank sum test) and (B) protein (data are presented as dot plots with mean ± SEM; 2-sided Student’s t-test) are induced in hearts of muscle LIM protein (MLP)–knockout (KO) mice, a model of dilated cardiomyopathy (DCM), as indicated by quantitative polymerase chain reaction and immunoblotting. (C) FYCO1 mRNA expression in human DCM and ischemic cardiomyopathy (ICM) using nCounter technology (NanoString, Seattle, Washington). (D) Immunoblots for autophagic proteins after adenoviral overexpression of FYCO1 (multiplicity of infection [MOI] = 25) in neonatal rat cardiomyocytes (NRCMs). An adenovirus (AdV) encoding β-galactosidase (lacZ, MOI = 25) serves as control. (E) Immunocytochemistry of NRCMs that overexpress FYCO1. Immunostaining was performed with green fluorescent protein (GFP)–fused LC3 (green) and antibodies against FYCO1 or α-actinin (red). (F) LC3-II expression in NRCMs that overexpress FYCO1 and have been starved by glucose deprivation for 24 h. (G) LC3-II expression in NRCMs that overexpress FYCO1 and have been treated with bafilomycin A1 (BFA) for 4 h. Data are presented as dot plots with mean ± SEM (2-way analysis of variance [ANOVA] followed by Student-Newman-Keuls post hoc tests). (H,I) Quantification of autophagosomes/autolysosomes in C2C12 myoblasts labeled by a tandem fluorescent (red fluorescent protein [RFP], GFP) LC3. C2C12 cells overexpress FYCO1 simultaneously (data are presented as dot plots with median and 25th and 75th percentiles; Mann-Whitney rank sum test). (J) Quantification of autophagosomes/autolysosomes in C2C12 myoblasts labeled by a tandem fluorescent (RFP, GFP) LC3. C2C12 cells overexpress FYCO1 simultaneously and are treated with BFA. Data are presented as box plots with median and 5th and 95th percentile whiskers (Kruskal-Wallis ANOVA on ranks followed by Dunn’s post hoc tests). ∗p < 0.05, ∗∗p < 0.01, and ∗∗∗p < 0.001. Scale bar, 10 μm. DMSO = dimethyl sulfoxide; GAPDH = glyceraldehyde 3-phosphate dehydrogenase; NF = non-failing hearts; WT = wild-type.
Figure 2
Figure 2
Knockdown of FYCO1 Inhibits Cardiomyocyte Autophagy (A) FYCO1 mRNA and protein expression in NRCMs after adenoviral transduction (MOI = 25) with 2 different synthetic micro–ribonucleic acids (microRNAs) that target FYCO1. Data are presented as dot plots with mean ± SEM (2-sided Student’s t-test). (B) LC3-II expression in NRCMs transduced with synthetic microRNA against FYCO1 and treated with glucose deprivation for 24 h. Data are presented as dot plots with mean ± SEM (2-way ANOVA followed by Student-Newman-Keuls post hoc tests). (C) Quantification of autophagosomes labeled by GFP-LC3 in NRCMs that overexpress a microRNA against FYCO1 and have been starved by glucose deprivation for 24 h. Data are presented as box plots with median and 5th and 95th percentile whiskers (Kruskal-Wallis ANOVA on ranks followed by Wilcoxon rank sum tests). ∗p < 0.05, ∗∗p < 0.01, and ∗∗∗ p < 0.001. Scale bar, 10 μm. Abbreviations as in Figure 1.
Figure 3
Figure 3
Fyco1 Deficiency Prevents Induction of Autophagy Upon Starvation In Vivo (A) Targeting strategy of FYCO1. (B) Fyco1 expression in hearts from homozygous Fyco1-KO mice. Body weight, heart mass, and echocardiographic analysis of fractional shortening in female KO mice at the age of 1 year. Data are presented as dot plots with mean ± SEM (2-sided Student’s t-test). (C) Echocardiographic analysis of fractional shortening in Fyco1-KO mice that have been starved for 48 h. (D) Heatmap of the expression profile of autophagic genes of fed and starved WT and Fyco1-KO mice, which was assessed using real-time polymerase chain reaction arrays (n-fold regulation on the basis of fed WT: black, 50th percentile; green, 10th percentile; red, 90th percentile). (E) LC3-II expression in hearts from Fyco1-KO mice after starvation for 48 h. (F) LC3-II expression in hearts from Fyco1-KO mice after starvation for 48 h and treatment with chloroquine (50 mg/kg intraperitoneally for 4 h). Data are presented as dot plots with mean ± SEM (2-way ANOVA followed by Student-Newman-Keuls post hoc tests). ∗∗p < 0.01 and ∗∗∗p < 0.001. Neo = neomycin; Puro = puromycin; other abbreviations as in Figure 1.
Figure 4
Figure 4
Fyco1-Deficient Mice Are Resistant to Autophagy Induced by Pressure Overload Fyco1-KO mice and WT littermates were subjected to transverse aortic constriction (TAC). Ratio of left ventricular (LV) mass to body weight (A) and echocardiographic analyses of LV end-diastolic diameter (LVEDD) (B) and fractional shortening (C) after 1 week of TAC. (D) Quantification of Nppa/ANF (atrial natriuretic factor) and Nppb/BNP (brain natriuretic peptide) expression after 1 week of TAC. (E) LV mass/body weight and echocardiographic analyses of (F) LVEDD and (G) fractional shortening after 2 weeks of TAC. (H) Lung weight after 2 weeks of TAC. LC3-II protein expression in the left ventricle after 1 week (I) and after 2 weeks (J) of severe TAC. All datasets are presented as dot plots with mean ± SEM (2-way ANOVA followed by Student-Newman-Keuls post hoc tests). Kaplan-Meier survival curves of WT and KO mice during (K) 1 week and during (L) 2 weeks of TAC. ∗p < 0.05, ∗∗p < 0.01, and ∗∗∗p < 0.001. Abbreviations as in Figure 1.
Figure 5
Figure 5
FYCO1-TG Mice Reveal Mild Cardiac Hypertrophy Without Induction of Maladaptive Hypertrophic Genes (A) Heart/body weight ratios of transgenic (TG) mice with cardiac-specific overexpression of FYCO1 (TG) and their WT littermates. (B) Echocardiographic analyses of interventricular septal thickness in diastole (IVSd), left ventricular posterior wall thickness in diastole (LVPWd), and fractional shortening. (C) Lung weight of TG and WT mice. Data are presented as dot plots with mean ± SEM (2-sided Student’s t test). (D) Quantification of cardiomyocyte CSAs by staining of TG and WT heart sections with wheat germ agglutinin lectin. Data are presented as box plots with median and 5th and 95th percentile whiskers (2-tailed Mann-Whitney rank sum test). (E) Gene expression of Nppa, Nppb, and Rcan1.4 by quantitative polymerase chain reaction (qPCR). Data are presented as dot plots with mean ± SEM (2-sided Student’s t-test). (F) Quantification of CSA in isolated NRCMs that overexpress FYCO1. Data are presented as box plots with median and 5th and 95th percentile whiskers (2-tailed Mann-Whitney rank sum test). (G) Expression of hypertrophic genes Nppa, Nppb, and Rcan1.4 by qPCR in NRCMs after overexpression of FYCO1 (MOI = 50). Data are presented as dot plots with mean ± SEM (2-sided Student’s t-test). ∗p < 0.05 and ∗∗∗p < 0.001. Abbreviations as in Figure 1.
Figure 6
Figure 6
FYCO1 Overexpression Causes Induction of Autophagy In Vivo (A) Quantification of cardiac autophagosomes per cell in double-TG mice that overexpress FYCO1 and GFP-LC3. Mice that overexpress GFP-LC3 only served as control (3 animals per group, 2-sided Student’s t-test). Cell surface area was determined by wheat germ agglutinin lectin. (B) LC3-II protein expression in FYCO1 transgenic mice (LC3-II with shorter and longer exposure time). (C) Quantification of autophagosomes labeled by GFP-LC3 in heart sections of TG mice that have been starved for 48 h and treated with either chloroquine (50 mg/kg) or vehicle alone (NaCl 0.9%) intraperitoneally for 4 h (3 animals per group, 18–25 images per animal). (D) LC3-II protein expression in starved TG mice after chloroquine treatment. Data are presented as dot plots with mean ± SEM (2-way ANOVA followed by Student-Newman-Keuls post hoc tests). (E) Analysis of papillary muscles by electron microscopy. Scale bar as indicated. (F) Quantification of autophagosomes/autolysosomes per visual field at 3,000× magnification. Organelles were validated at 12,000× and 20,000× magnification (WT: 10 fields from 3 mice; TG: 11 fields from 2 mice). Data are presented as dot plots with mean ± SEM (2-sided Student’s t-test). ∗∗p < 0.01 and ∗∗∗p < 0.001. Au = autophagosome; Lys = lysosome; Mi = mitochondria; Mi∗ = mitochondrium in autophagsome; N = nucleus; other abbreviations as in Figure 1.
Figure 7
Figure 7
FYCO1 Overexpression Blunts Cardiac Dysfunction Due to Pressure Overload FYCO1 TG and WT mice were subjected to transverse aortic constriction (TAC) for 2 weeks. (A) LV mass/body weight and (B) lung weight as a marker of congestive heart failure after TAC. (C) Echocardiographic analysis of ejection fraction after TAC. (D) Expression of Nppa/ANF and Nppb/BNP by qPCR in left ventricles of banded TG and WT mice. (E) Expression of autophagic proteins LC3-II, p62, Rab7, and beclin-1 in left ventricles of banded TG and WT animals. All datasets are presented as dot plots with mean ± SEM (2-way ANOVA followed by Student-Newman-Keuls post hoc tests). ∗p < 0.05, ∗∗p < 0.01, and ∗∗∗p < 0.001. Abbreviations as in Figures 1, 4, and 5.

Comment in

  • A Novel Inducer of Autophagy in the Heart.
    Mukai R, Sadoshima J. Mukai R, et al. JACC Basic Transl Sci. 2021 Apr 27;6(4):381-383. doi: 10.1016/j.jacbts.2021.02.007. eCollection 2021 Apr. JACC Basic Transl Sci. 2021. PMID: 33999043 Free PMC article.

Similar articles

Cited by

References

    1. Roger V.L. Epidemiology of heart failure. Circ Res. 2013;113:646–659. - PMC - PubMed
    1. Kehat I., Molkentin J.D. Molecular pathways underlying cardiac remodeling during pathophysiological stimulation. Circulation. 2010;122:2727–2735. - PMC - PubMed
    1. Mizushima N., Klionsky D.J. Protein turnover via autophagy: implications for metabolism. Annu Rev Nutr. 2007;27:19–40. - PubMed
    1. Mizushima N., Komatsu M. Autophagy: renovation of cells and tissues. Cell. 2011;147:728–741. - PubMed
    1. Will R.D., Eden M., Just S. Myomasp/LRRC39, a heart- and muscle-specific protein, is a novel component of the sarcomeric M-band and is involved in stretch sensing. Circ Res. 2010;107:1253–1264. - PubMed

LinkOut - more resources