. 2021 Jan 13;5(2):241-252.
doi: 10.1016/j.mayocpiqo.2020.09.007. eCollection 2021 Apr.

A Digital Filter-Based Method for Diagnosing Speech Comprehension Deficits

Affiliations

A Digital Filter-Based Method for Diagnosing Speech Comprehension Deficits

Gisele V H Koury et al. Mayo Clin Proc Innov Qual Outcomes. .

Abstract

Objective: To improve the diagnostic efficiency of current tests for auditory processing disorders (APDs) by creating new test signals using digital filtering methods.

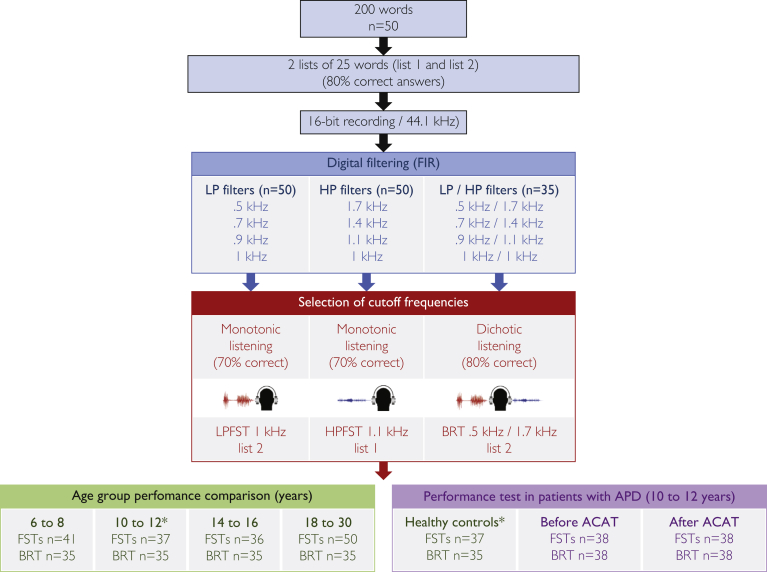
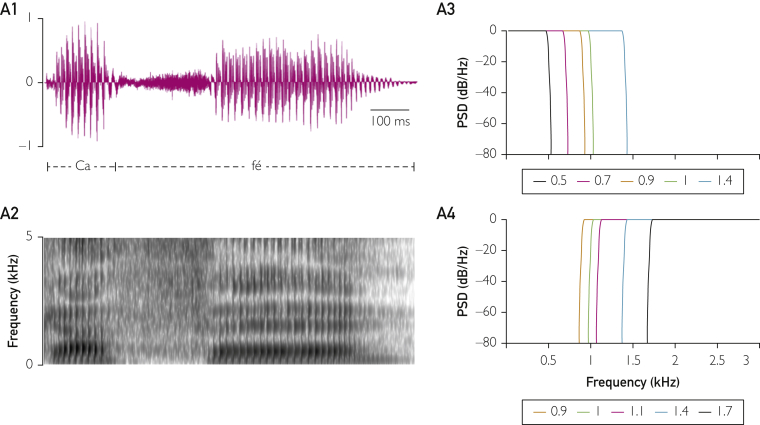
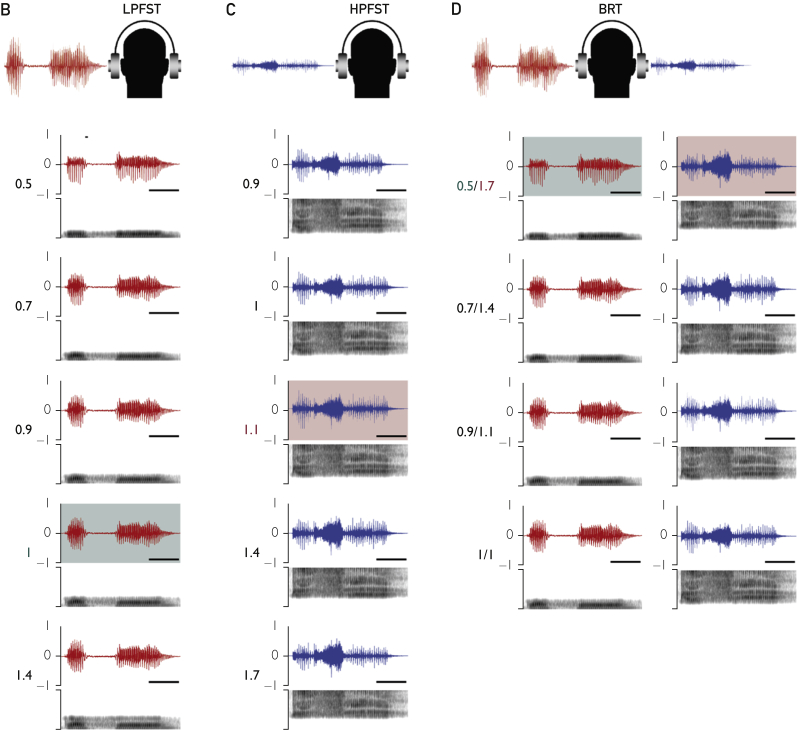
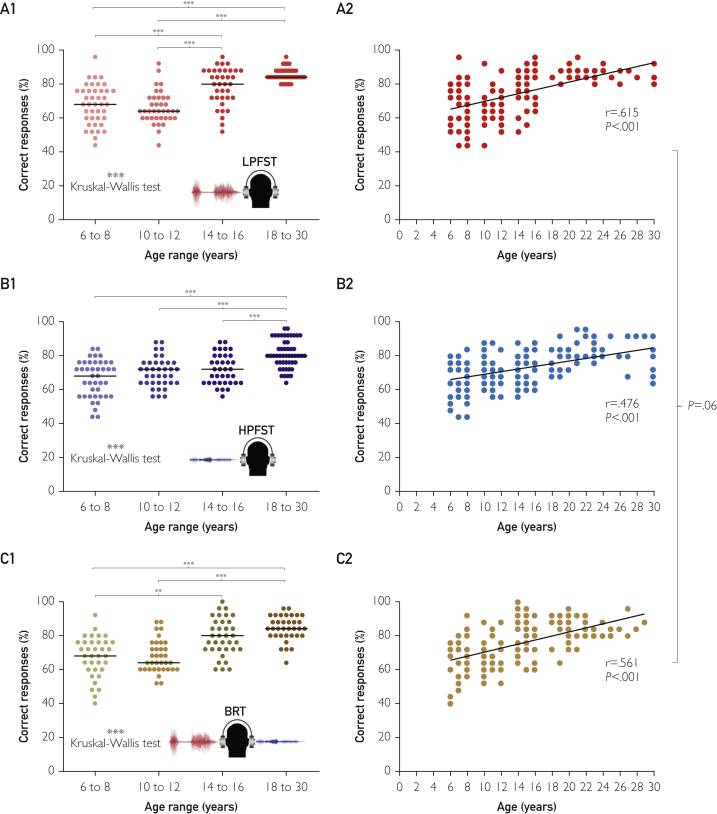
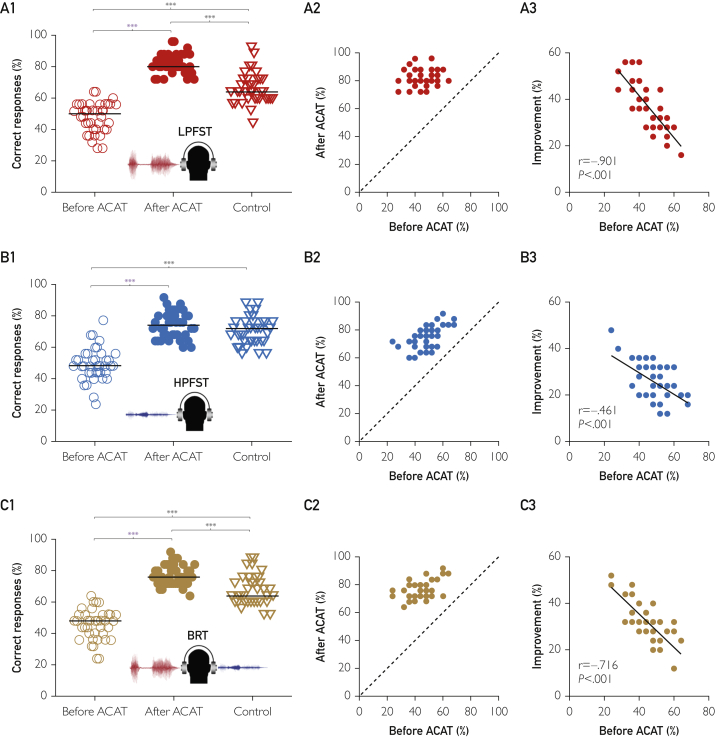
Methods: We conducted a prospective study from August 1, 2014, to August 31, 2019, using 3 low speech redundancy tests with novel test signals that we created with specially designed digital filters: the binaural resynthesis test and the low pass and high pass filtered speech tests. We validated and optimized these new tests, then applied them to healthy individuals across different age groups to examine how age affected performance and to children with APD before and after acoustically controlled auditory training (ACAT) to assess clinical improvement after treatment.

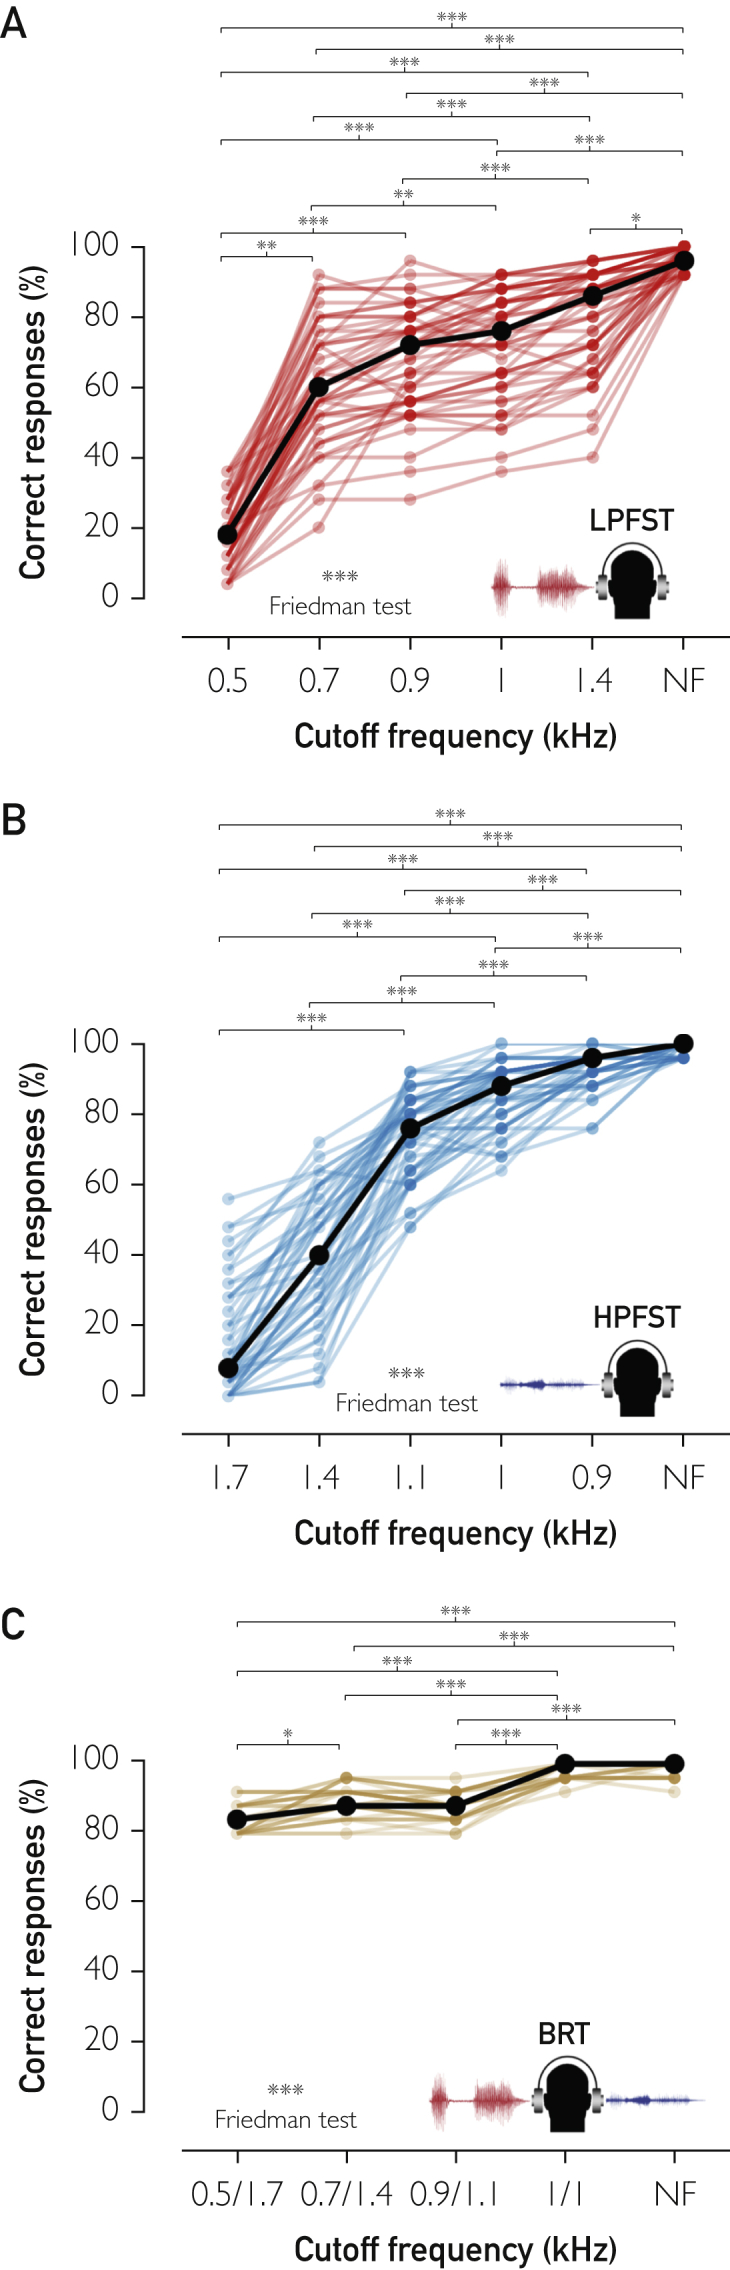
Results: We found a progressive increase in performance accuracy with less restrictive filters (P<.001) and with increasing age for all tests (P<.001). Our results suggest that binaural resynthesis and auditory closure mature at similar rates. We also demonstrate that the new tests can be used for the diagnosis of APD and for the monitoring of ACAT effects. Interestingly, we found that patients having the most severe deficits also benefited the most from ACAT (P<.001).

Conclusion: We introduce a method that substantially improves current diagnostic tools for APD. In addition, we provide information on auditory processing maturation in normal development and validate that our method can detect APD-related deficits and ACAT-induced improvements in auditory processing.

Keywords: AC, auditory closure; ACAT, acoustically controlled auditory training; APD, auditory processing disorder; BR, binaural resynthesis; BRT, binaural resynthesis test; FST, filtered speech test; HP, high pass; HPFST, high pass filtered speech test; L1, list 1; L2, list 2; LP, low pass; LPFST, low pass filtered speech test.


Figures

Figure 1
Figure 1
Schematic of the study’s workflow, including choice of speech material (in black), digital filtering (in blue), and selection of cutoff frequency to be used for testing (in red). After establishing the optimal cutoff frequency for each test, we tested how performance varied with age in healthy participants (in green) and in patients with auditory processing disorder (APD) before and after acoustically controlled auditory training (ACAT; in purple). Groups marked with an asterisk show the performance of healthy children aged 10 to 12 years who were used in this study as a healthy control. BRT = binaural resynthesis test; FIR = finite impulse response; FSTs = filtered speech tests (LPFST and HPFST); HP = high pass; HPFST = high pass filtered speech test; LP = low pass; LPFST = low pass filtered speech test.
Figure 2
Figure 2
A, Representative unfiltered sound waveform (A1) and spectrogram (A2) of a word (café, “coffee” in English) used as a test stimulus in the auditory tests and the word attenuation profile of the low pass (A3) and high pass (A4) finite impulse response digital filters used to reduce information redundancy of the speech material. Note the sharp −80 dB attenuation achieved in all cutoff frequencies. B, Waveform and spectrogram of the word café digitally filtered at all the low pass cutoff frequencies used in the validation tests. The green highlight indicates the cutoff (1 kHz) chosen as the standard for the subsequent low pass filtered speech test (LPFST). C, Similar to B but for high pass cutoff frequencies. The pink highlight indicates the cutoff (1.1 kHz) chosen as the standard for the subsequent high pass filtered speech test (HPFST). D, Similar to B and C but representing the combination of low and high pass filtered speech signals (presented dichotically) used for validating the binaural resynthesis test (BRT). Highlighted in green is the 0.5 kHz cutoff frequency chosen for low pass filtered speech and in pink, the 1.7 kHz cutoff frequency chosen for high pass filtered speech. Note the abrupt cutoff of the speech signal, with few auditory residues above (B and D) and below (C and D) the cutoff frequencies. PSD = power spectral density.
Figure 2
Figure 2
A, Representative unfiltered sound waveform (A1) and spectrogram (A2) of a word (café, “coffee” in English) used as a test stimulus in the auditory tests and the word attenuation profile of the low pass (A3) and high pass (A4) finite impulse response digital filters used to reduce information redundancy of the speech material. Note the sharp −80 dB attenuation achieved in all cutoff frequencies. B, Waveform and spectrogram of the word café digitally filtered at all the low pass cutoff frequencies used in the validation tests. The green highlight indicates the cutoff (1 kHz) chosen as the standard for the subsequent low pass filtered speech test (LPFST). C, Similar to B but for high pass cutoff frequencies. The pink highlight indicates the cutoff (1.1 kHz) chosen as the standard for the subsequent high pass filtered speech test (HPFST). D, Similar to B and C but representing the combination of low and high pass filtered speech signals (presented dichotically) used for validating the binaural resynthesis test (BRT). Highlighted in green is the 0.5 kHz cutoff frequency chosen for low pass filtered speech and in pink, the 1.7 kHz cutoff frequency chosen for high pass filtered speech. Note the abrupt cutoff of the speech signal, with few auditory residues above (B and D) and below (C and D) the cutoff frequencies. PSD = power spectral density.
Figure 3
Figure 3
Proportion of correct responses (ie, answers that accurately identified the presented stimuli) given by healthy adults presented with digitally filtered spoken words. Black dots indicate the median value of each group; individual data points are represented by colored symbols. A, Performance in the low pass filtered speech test (LPFST) with several cutoff frequencies. Note the decrease in performance with lower cutoffs and that the 1 kHz cutoff results in a median response accuracy of around 70%. B, Performance in the high pass filtered speech test (HPFST) with several cutoff frequencies; the 1.1 kHz cutoff results in a median response accuracy of around 70%. Note the decrease in performance with higher cutoffs. C, Performance in the binaural resynthesis test (BRT) with several combinations of low pass and high pass filter cutoff frequencies, presented dichotically. Note the decrease in performance with more restrictive cutoff ranges and that the 0.5/1.1 kHz combination results in a median response accuracy of around 80%. Also note that the low pass and high pass filter cutoffs, when applied monotically in the LPFST and the HPFST, result in median accuracy levels of less than 20%. NF = not filtered. Friedman test: ∗P=.05; ∗∗P=.01; ∗∗∗P<.001.
Figure 4
Figure 4
Proportion of correct responses in the filtered speech tests given by participants of different ages. Black lines indicate the median value of each group; individual data points are represented by colored symbols. Note that performance improved with age in all tests. A, Results on the low pass filtered speech test (LPFST) across separate age groups (A1) and the correlation between age and performance (A2). Note that when different age groups are segregated (A1), there is no significant difference between the 14- to 16-year and the 18- to 30-year age groups (P=.06). Also, there is a significant correlation between age and performance (A2). B, Results on the high pass filtered speech test (HPFST) across separate age groups (B1) and the correlation between age and performance (B2). Note the significant correlation between age and performance (B2). C, Results on the binaural resynthesis test (BRT) across separate age groups (C1) and the correlation between age and performance (C2). Note that as with the LPFST, when different age groups are segregated (C1), there is no significant difference between the 14- to 16-year and the 18- to 30-year age groups (P=.23). Also, there is a significant correlation between age and performance (C2). Importantly, there was no significant difference in the slopes of the linear regression curves between age and performance for all three tests (P=.06), that is, the correlation between age and performance was similar for all tests. Kruskal-Wallis test: ∗∗P=.01; ∗∗∗P<.001.
Figure 5
Figure 5
Proportion of correct responses in the filtered speech tests given by patients diagnosed with auditory processing disorder (APD) before and after acoustically controlled auditory training (ACAT) and age-matched healthy controls. Black lines indicate the median value of each group; individual data points are represented by colored symbols. A, Performance in the low pass filtered speech test (LPFST). A1 shows the data for patients with APD before (empty circles) and after (full circles) ACAT and for the controls (empty triangles). Note that patients with APD scored significantly lower than controls before ACAT but then scored significantly higher after the treatment. A2 shows the identity plot for each patient before and after treatment. A3 shows the correlation between performance before ACAT and improvement (performance after ACAT – performance before ACAT). B, Similar to A but for the high pass filtered speech test (HPFST). Note that unlike for the LPFST and binaural resynthesis test (BRT), patients did not score higher than the controls after ACAT, even though they were worse before the treatment. Nevertheless, there still was no significant difference between performance after ACAT and controls (P=.06), indicating that the patients achieved normal levels of performance. C, Similar to A and B but for the BRT. As for the LPFST, patients scored significantly lower than controls before ACAT but then scored significantly higher after the treatment. Importantly, note that every single patient falls above the identity line for every filtered speech test applied, indicating that performance improved across all tested auditory skills after ACAT treatment. Also note that there was a significant inverse correlation between initial performance and improvement, demonstrating that patients with the worse initial symptoms benefited disproportionately more from ACAT. Wilcoxon matched pairs signed rank test (paired, in purple): ∗∗∗P<.001. Mann-Whitney test (unpaired, in black): ∗∗∗P<.001).

Similar articles

References

    1. American Academy of Audiology Clinical Practice Guidelines Diagnosis, Treatment and Management of Children and Adults With Central Auditory Processing Disorder. August 2010. http://psha.org/pdfs/toolbox/CAPD-Guidelines_8-2010.pdf Accessed January 21, 2020.
    1. de Wit E., Visser-Bochane M.I., Steenbergen B., van Dijk P., van der Schans C.P., Luinge M.R. Characteristics of auditory processing disorders: a systematic review. J Speech Lang Hear Res. 2016;59(2):384–413. - PubMed
    1. Pereira L.D., Schochat E. Pró-Fono; Barueri, SP, Brazil: 2015. Testes Auditivos Comportamentais para Avaliação do Processamento Auditivo Central.
    1. Ahmmed A.U. Intelligibility of degraded speech and the relationship between symptoms of inattention, hyperactivity/impulsivity and language impairment in children with suspected auditory processing disorder. Int J Pediatr Otorhinolaryngol. 2017;101:178–185. - PubMed
    1. Obuchi C., Ogane S., Sato Y., Kaga K. Auditory symptoms and psychological characteristics in adults with auditory processing disorders. J Otol. 2017;12(3):132–137. - PMC - PubMed