. 2021 Apr 3;24(5):102396.
doi: 10.1016/j.isci.2021.102396. eCollection 2021 May 21.

Dynamic intracellular mechanical cues facilitate collective signaling responses

Affiliations

Dynamic intracellular mechanical cues facilitate collective signaling responses

Bingchen Che et al. iScience. .

Abstract

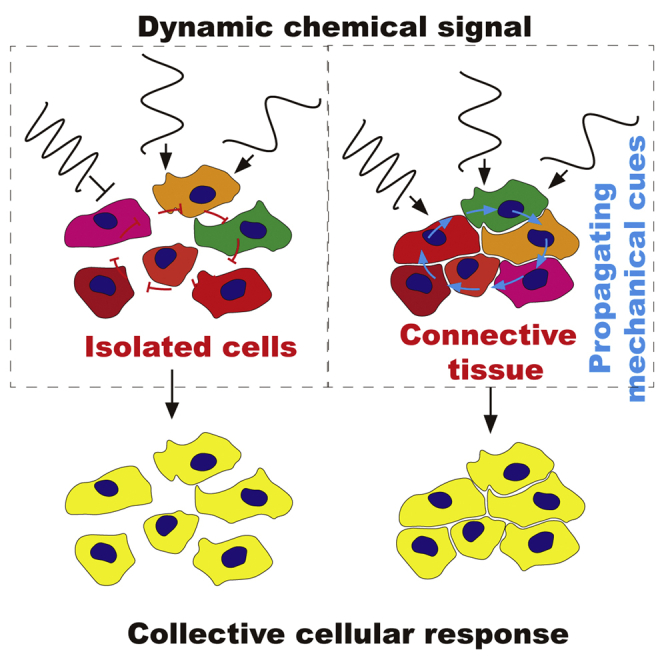
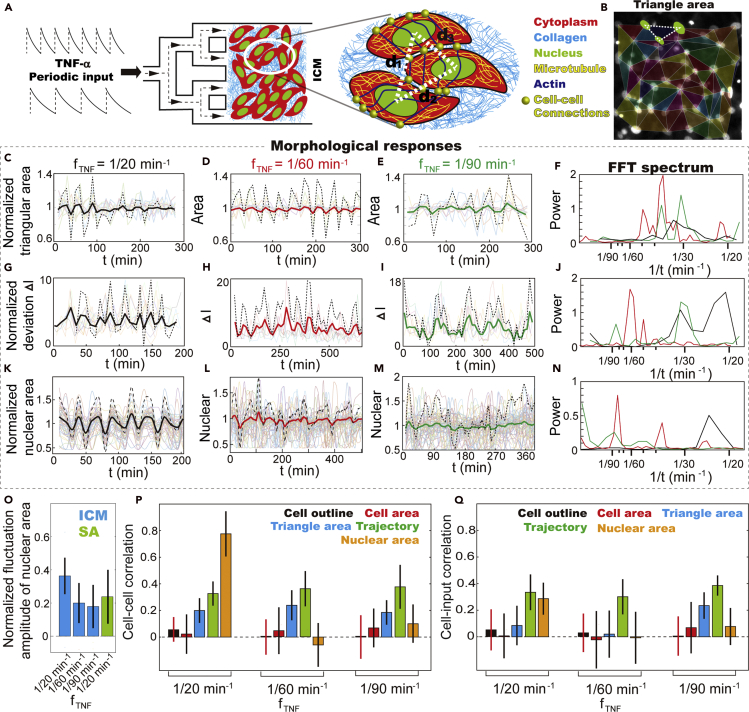
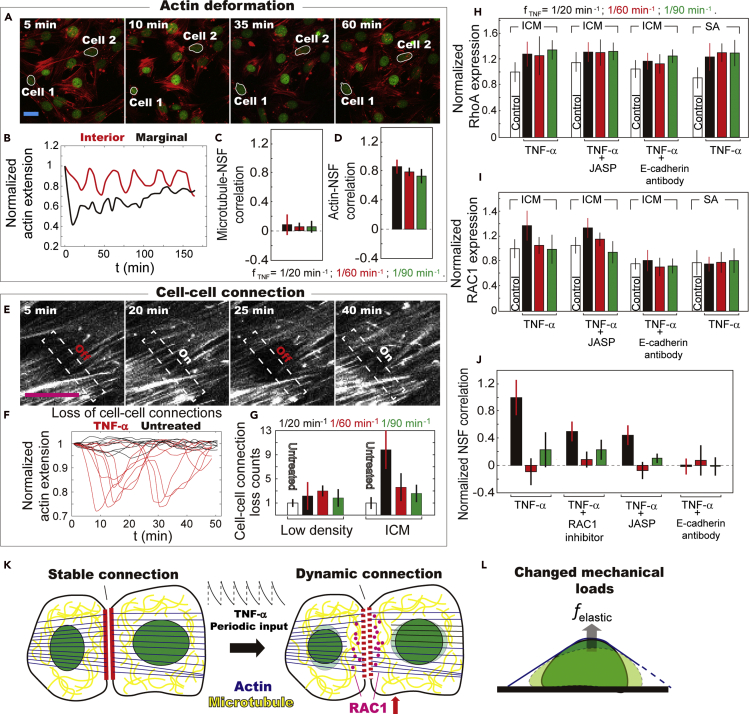
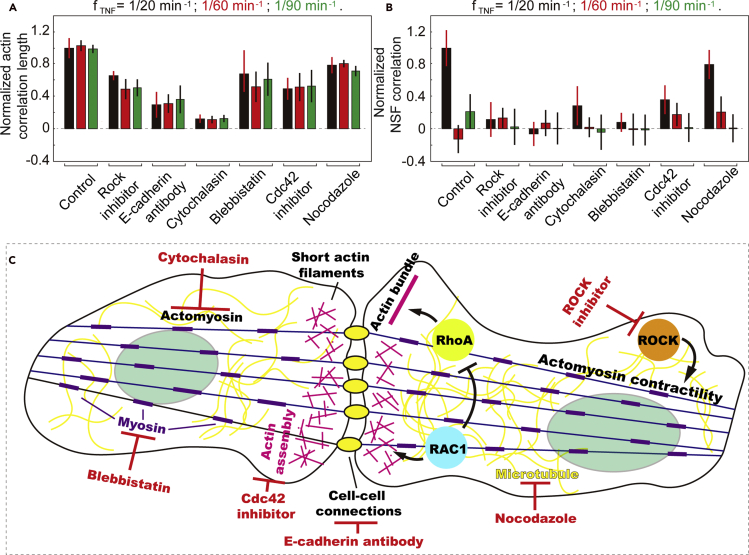
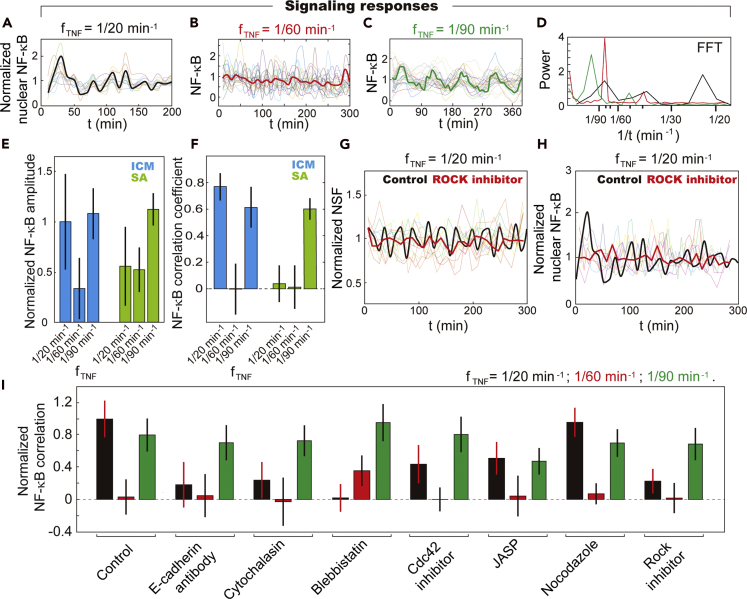
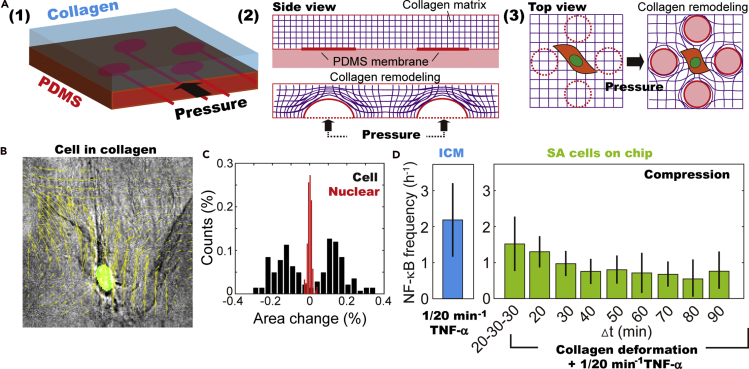
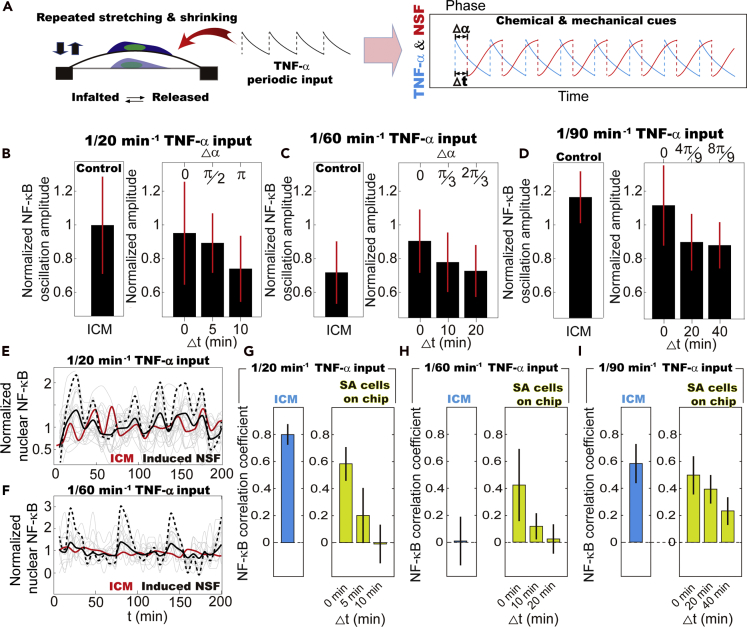
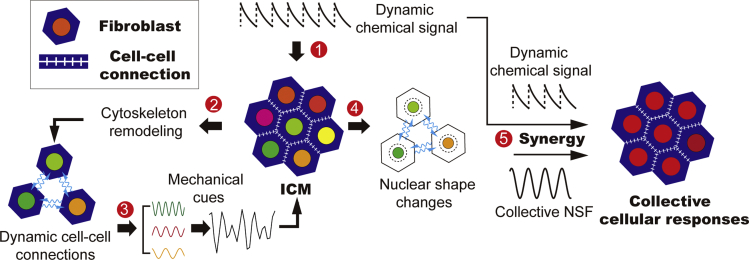
Collective behavior emerges in diverse life machineries, e.g., the immune responses to dynamic stimulations. The essential questions that arise here are that whether and how cells in vivo collectively respond to stimulation frequencies higher than their intrinsic natural values, e.g., the acute inflammation conditions. In this work, we systematically studied morphological and signaling responses of population fibroblasts in an interconnected cell monolayer and uncovered that, besides the natural NF-κB oscillation frequency of 1/90 min-1, collective signaling response emerges in the cell monolayer at 1/20 min-1 TNF-α input periodicity as well. Using a customized microfluidic device, we independently induced dynamic chemical stimulation and cytoskeleton reorganization on the stand-alone cells to exclude the effect of cell-cell communication. Our results reveal that, at this particular frequency, chemical stimulation is translated into dynamic intracellular mechanical cues through RAC1-medicated induction of dynamic cell-cell connections and cytoskeleton reorganizations, which synergize with chemical input to facilitate collective signaling responses.

Keywords: Cell Biology; Cellular Physiology; Mechanobiology.


Conflict of interest statement

The authors declare that they have no competing interests. The two-level culture chamber described in this article has been patented by the University of Chicago (Pub. No: WO/2018/213282, International Application No. PCT/US2018/032727).

Figures

None
Graphical abstract
Figure 1
Figure 1
Collective morphological response of population cells in ICM upon periodic TNF-α stimulation (A) Schematic showing that the ICM was maintained in a microfluidic culture chamber and stimulated by dynamic TNF-α inflammatory signal of various amplitudes and frequencies. (B) Cell-cell interactions are evaluated by measuring the triangular area connecting three neighboring cells. (C–E) Relative displacement of the nucleus with respect to the neighbors causes changes in the triangular area, which reflect the cell-cell and cell-ECM interactions. The traces were normalized by their average value. The translucent lines are traces of individual cells. The solid line is the average of all traces, and the dashed line is the enlarged view of the solid line for better visualization of the fluctuation. (F) Fast Fourier transform (FFT) shows that variations in the triangular area at all TNF-α input periodicities share a similar dominant frequency, ranging from 1/40 to 1/30 min−1 (G–I) Collective vibration of nuclear centroid during cell migration within the ICM reflects deformation of the cell monolayer, which coordinates with periodic TNF-α stimulation. The traces were normalized by their average value. The translucent lines are traces of individual cells. The solid line is the average of all traces, and the dashed line is the enlarged view of the solid line for better visualization of the fluctuation. (J) Fast Fourier transform (FFT) shows that the dynamic ICM deformation synchronizes with TNF-α input. (K–M) Nuclear shape fluctuation (NSF) traces of single fibroblasts in the ICM upon stimulation. The traces were normalized by their average value. The translucent lines are traces of individual cells. The solid line is the average of all traces, and the dashed line is the enlarged view of the solid line for better visualization of the fluctuation. (N) Fast Fourier transform (FFT) shows dominant NSF frequency between 1/20 and 1/30 min−1, when stimulated by 1/20 min−1 TNF-α stimulation. (O) Fluctuation amplitude of nuclear shape changes in ICM and the stand-alone (SA) cells upon periodic TNF-α stimulation. The fluctuation amplitude of individual cells' nucleus was normalized to its time averaged area. The error bars represent standard deviation of population cell's fluctuation amplitude in nuclear area. (P) Cross-correlation analysis of the morphological responses of population cells in the ICM reveals that the collective behavior is most obvious in NSF when stimulated by 1/20 min−1 TNF-α input. The error bars represent standard deviation of the correlation coefficients between any 2 neighboring cells in a population. (Q) Cross-correlation analysis between the morphological responses of population cells in the ICM and TNF-α periodic stimulations reveal that contractile activities of ICM as a whole entity coordinate with TNF-α stimulation. The error bars represent standard deviation of the correlation coefficients between individual cells and the TNF-α input.
Figure 2
Figure 2
Active remodeling of cytoskeleton networks and RAC1-mediated dynamic cell-cell connections lead to collective NSF (A) Representative fluorescent images of ICM during periodic TNF-α stimulation show that shape transition of the nuclear (green) and actin deformation (red) are more dramatic at the marginal region. Scale bar represents 20 μm. (B) Averaged extension of actin filaments at different time points reveals that actin deformation differs at the marginal and interior area. The variations in the average actin extension were normalized by the initial value (i.e., at 0 min). (C) Cross-correlation analysis between variations in the volume of microtubule networks and NSF illustrates that remodeling of microtubule networks has trivial effects on nuclear shape. The error bars represent standard deviation of the correlation coefficients between individual cell's microtubule remodeling and NSF. (D) Cross-correlation analysis between variations in actin extension and NSF reveals that actin deformation regulates nuclear shape. The error bars represent standard deviation of the correlation coefficients between changes in individual cell's actin extension remodeling and NSF. (E) Representative fluorescent images of the actin filaments at cell-cell connections during periodic TNF-α stimulation show variations in the fluorescence intensity. Scale bar represents 20 μm. (F) Traces of the fluorescence intensity at the cell-cell connections demonstrate that the variations are more obvious with TNF-α stimulation. The variations in the average actin extension were normalized by the initial value (i.e., at 0 min). (G) Counts of the events with fluctuation amplitude of fluorescence intensity at cell-cell connections more than 10% show more frequent loss of cell-cell contacts with TNF-α stimulation. The error bars represent standard deviation of cell-cell connection loss counts among low density cells and in ICM. (H and I) Expression level of RhoA (H) and RAC1 (I) mRNA detected by RT-PCR and expressed as fold-change. For the data presented in (H) and (I), minimum five independent experiments were performed for each data point. The expression level of both proteins was normalized by the value of control samples, i.e., the untreated ICM. The error bars represent standard deviation of protein expression level in five independent experiments at each condition. (J) Cross-correlation analysis of the NSF of neighboring cells reveals that the collective cellular responses are disrupted by drugs regulating cell-cell connections. Correlation coefficients obtained under different conditions were normalized to the control sample, i.e., ICM treated by 1/20 min−1 TNF-α. The error bars represent standard deviation of the NSF correlation coefficients among population cells. (K) Schematic shows that entrainment in the Rho-associated signaling pathways leads to an elevated RAC1 expression level, which facilitates transition to more dynamic cell-cell connections. (L) Schematic shows that deformation of actin filaments leads to changing mechanical loads on the nucleus.
Figure 3
Figure 3
Dynamic cell-cell connections and actin contractility both play crucial roles in regulating collective morphological responses in the ICM (A) Particle image velocimetry and correlation length analysis of actin filaments in the ICM reveal that the collective movement is disrupted by drugs targeting cell-cell connections. The correlation lengths obtained under different conditions were normalized by value of the control samples, i.e., ICM treated by only 1/20 min−1 TNF-α. The error bars represent standard deviation of the correlation length of actin filaments in five independent experiments. (B) The collective NSF is disrupted by drugs targeting cell-cell connections and actin contractility but not the microtubule networks. The correlation coefficients obtained under different conditions were normalized by value of the control samples, i.e., ICM treated by only 1/20 min−1 TNF-α. The error bars represent standard deviation of the correlation coefficients of population cells' NSF in five independent experiments. (C) Schematic shows that the collective NSF is regulated by deformation of actin filaments and dynamic cell-cell connections.
Figure 4
Figure 4
Collective signaling response of population cells in ICM upon periodic TNF-α stimulation (A–C) NF-κB dynamics of individual cells in ICM upon periodic TNF-α stimulation. NF-κB traces were normalized by the average value. (D) Fast Fourier transform (FFT) shows dominant oscillation frequency close to NSF. In (A)-(C), the translucent lines are the traces of individual cells and the solid lines reflect the averaged value of single cells traces. (E) NF-κB oscillation amplitude is maximized at 1/90 min1, when getting entrained, and greatly enhanced in the ICM in response to 1/20 min1 TNF-α stimulation as compared with SA cells. The NF-κB oscillation amplitude of individual cells under different conditions was normalized by value of the control samples, i.e., ICM treated by only 1/20 min−1 TNF-α. The error bars represent standard deviation of population cell's nuclear NF-κB fluctuation amplitude. (F) Cross-correlation analysis of the signaling responses of population cells in the ICM reveals that the collective behavior is most obvious in NF-κB dynamics when stimulated by 1/20 and 1/90 min1 TNF-α in ICM, and only at 1/90 min1 TNF-α for SA cells. The error bars represent standard deviation of the correlation coefficients of population cells' NF-κB oscillation through NE. (G and H) NF-κB and NSF traces of single fibroblasts in ICM treated with ROCK inhibitor, which is followed by 1/20 min1 TNF-α stimulation. The NSF and NF-κB traces were normalized by their average values. In (G)-(H), the translucent lines are the traces of individual cells being treated by ROCK inhibitor and the solid lines reflect the averaged value of single cells traces. It is demonstrated that the application of ROCK inhibitor disrupts the collective activities of the ICM in NSF and NF-κB dynamics shown in Figures 1K and 4A. (I) The collective signaling responses were disrupted by drugs, which disrupt collective NSF. The collective cellular responses at 1/90 min1 were unaffected. The NF-κB correlation coefficient of neighboring cells under different conditions were normalized by value of the control samples, i.e., ICM treated by only 1/20 min−1 TNF-α. The error bars represent standard deviation of the correlation coefficients of NF-κB oscillation under different experimental conditions.
Figure 5
Figure 5
Modeling the dynamic mechanical cues at cell-ECM interfaces using a customized microfluidic device (A) Sketch of the collagen remodeling caused by repeated pressurization and relaxation of the underlying PDMS membrane, which then delivers dynamic mechanical cues to the SA cells. (B) Remodeling of the collagen matrix leads to cell shape transition (phase contrast). The nuclear shape (green) remains mostly unaffected. (C) Distribution of nuclear and cell area changes suggests that remodeling of the collagen matrix brings no obvious effects on the nuclear shape. (D) Subjected to repeated collagen remodeling at frequencies ranging from 1/20 to 1/90 min1, 1/20 min1 TNF-α is insufficient to achieve NF-κB oscillation frequency comparable with ICM. NF-κB dynamics is, however, enhanced, when the frequency of induced collagen remodeling is 1/20 min1 or mode hopping between 1/20 and 1/30 min1. The error bars represent standard deviation of population cells' NF-κB oscillation frequency through NE.
Figure 6
Figure 6
Modeling intracellular mechanical cues caused by actin deformation in the ICM: the effect of dynamic mechanical cues on NF-κB oscillation of SA cells (A) NSF and TNF-α inputs are simultaneously introduced to SA cells using a customized microfluidic device. The time (Δt) and phase (Δα) difference between minima of the nuclear area (red) and maxima of TNF-α concentration models the phase mismatching between mechanical and chemical cues in the ICM. (B–D) Synergy between NSF and TNF-α inputs induces elevated NF-κB oscillation amplitude among SA cells, which is comparable with or even higher than the ones in the ICM. The NF-κB oscillation amplitudes under different conditions were normalized by value of the control samples, i.e., ICM treated by only 1/20 min−1 TNF-α. The error bars represent standard deviation of population cell's nuclear NF-κB fluctuation amplitude in five independent experiments. (E and F) Synergy between NSF and TNF-α inputs induces collective NF-κB oscillation activities coordinating with TNF-α periodicity. NF-κB dynamics averaged among all cells with induced NSF (black lines) shows higher amplitude as compared with the ones in the ICM (red lines) when being stimulated by 1/60 min1oscillatory TNF-α input. The values are comparable in the ICM and on-chip in response to 1/20 min1 oscillatory TNF-α input. The dashed lines are the enlarged view of the black lines. The translucent lines are the traces of individual cells with induced NSF on chip. Nuclear NF-κB traces were normalized by their average values. (G–I) Cross-correlation analysis of the signaling responses of population cells in the ICM in response to 1/20, 1/60, and 1/90 min1 TNF-α input reveals that collective signaling activities emerge as long as the induced NSF coordinates with the dynamic chemical inputs. The error bars represent standard deviation of the correlation coefficients of population cells' NF-κB oscillation through NE in five independent experiments.
Figure 7
Figure 7
Schematic shows the feedback loop, in which dynamic intracellular mechanical cues caused by active cytoskeleton reorganization synergize with the chemical signal to facilitate collective cellular responses In the feedback loop, dynamic chemical signals are converted into mechanical cues via RAC1-mediated transition from mature into dynamic cell-cell connections.

Similar articles

Cited by

References

    1. Amano M. Formation of actin stress fibers and focal adhesions enhanced by Rho-kinase. Science. 1997;275:1308–1311. - PubMed
    1. Amano M., Nakayama M., Kaibuchi K. Rho-kinase/ROCK: a key regulator of the cytoskeleton and cell polarity. Cytoskeleton. 2010;67:545–554. - PMC - PubMed
    1. Albeck John G., Mills Gordon B., Cell Joan S.B.J.M. Frequency-Modulated pulses of ERK activity transmit quantitative proliferation signal. Mol. Cell. 2013;49:249–261. - PMC - PubMed
    1. Asnacios A., Hamant O. The mechanics behind cell polarity. Trends Cell Biol. 2012;22:584–591. - PubMed
    1. Berridge M.J., Bootman M.D., Roderick H.L. Calcium signalling: dynamics, homeostasis and remodelling. Nat. Rev. Mol. Cell Biol. 2003;4:517–529. - PubMed