. 2021 Apr 15;24(5):102402.
doi: 10.1016/j.isci.2021.102402. eCollection 2021 May 21.

Absence of Batf3 reveals a new dimension of cell state heterogeneity within conventional dendritic cells

Affiliations

Absence of Batf3 reveals a new dimension of cell state heterogeneity within conventional dendritic cells

Samuel W Lukowski et al. iScience. .

Abstract

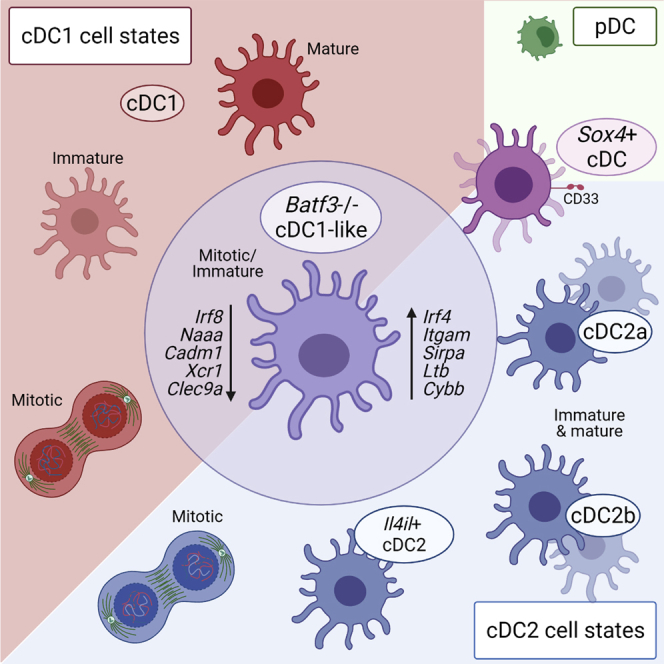
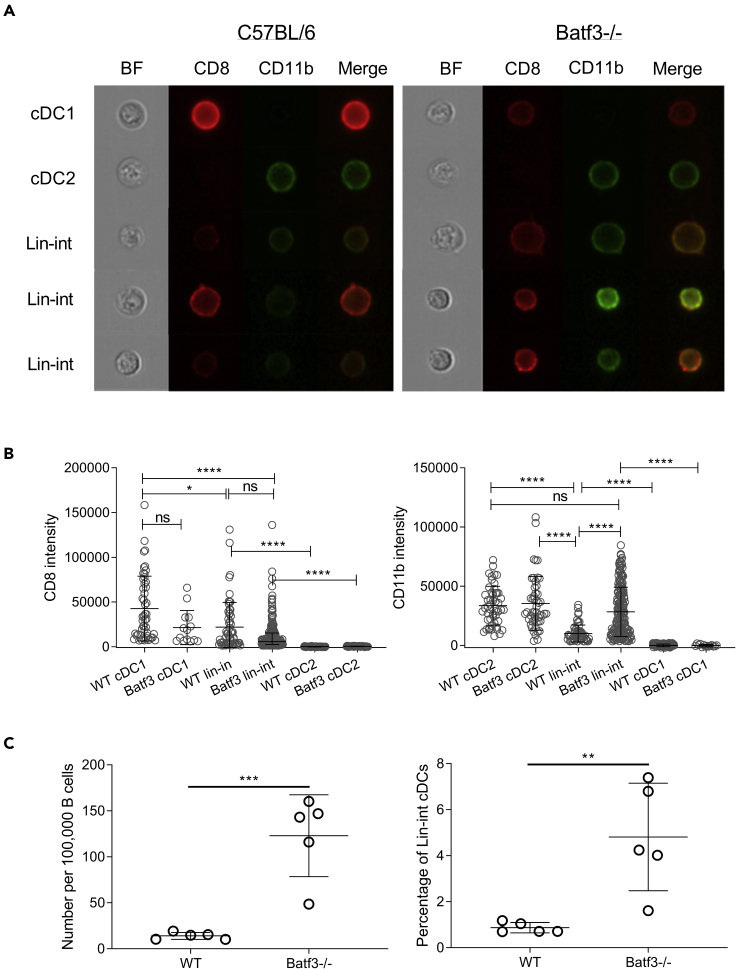
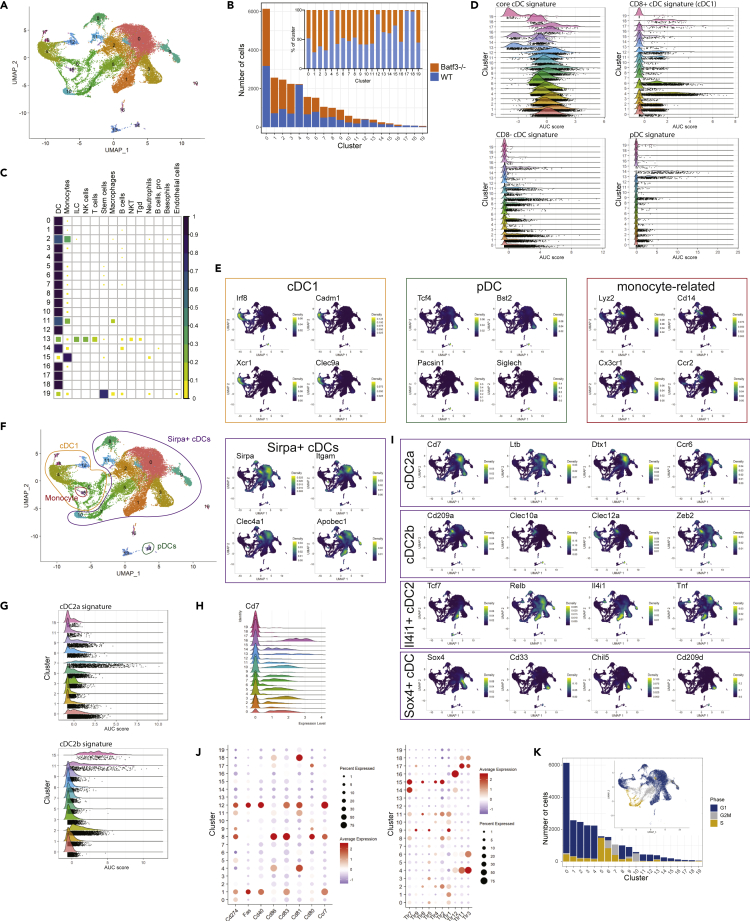
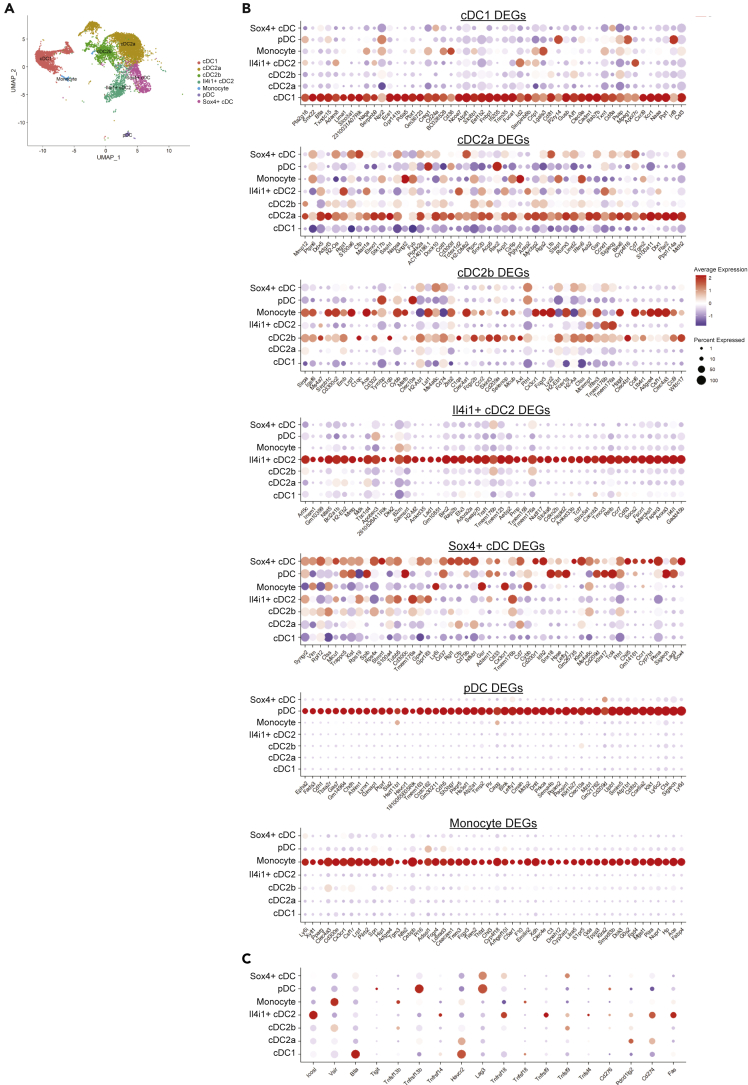
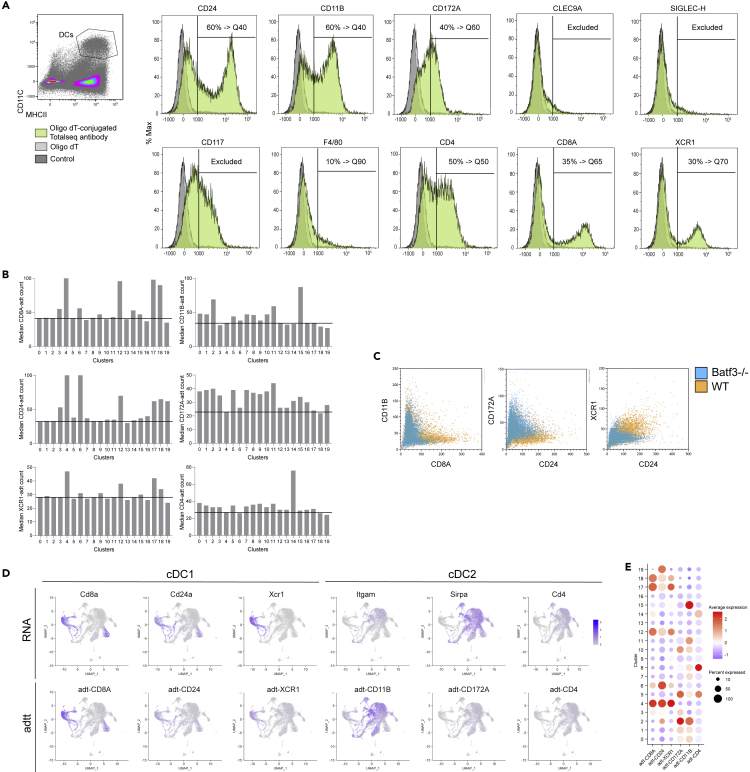
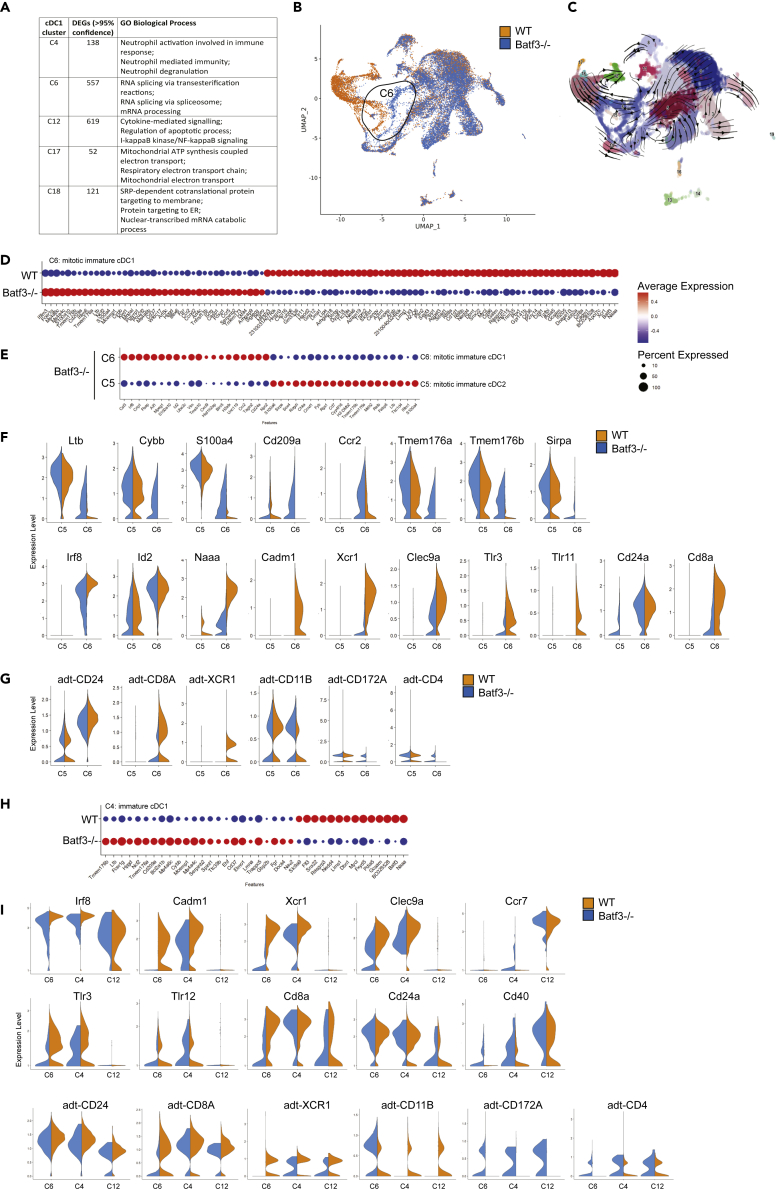
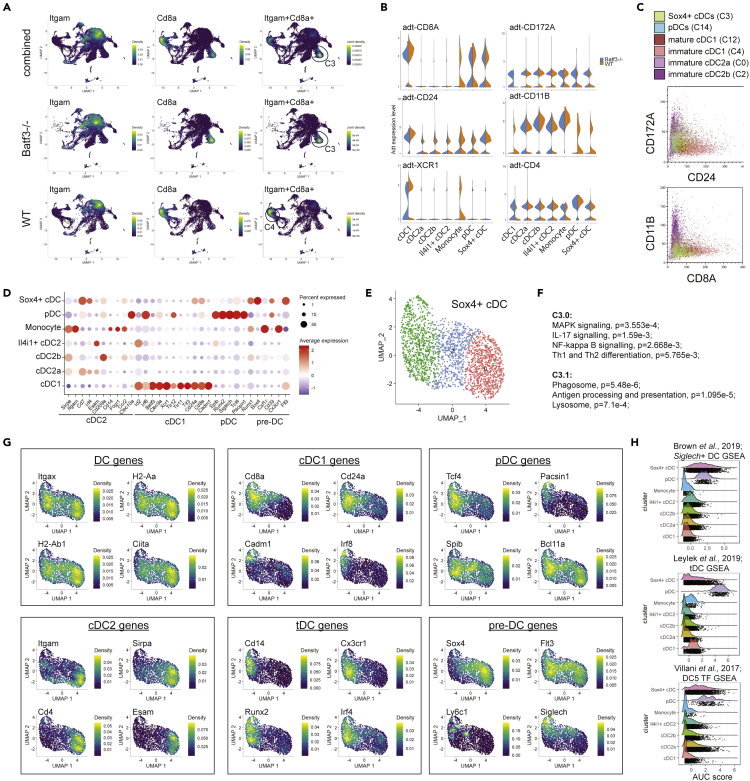
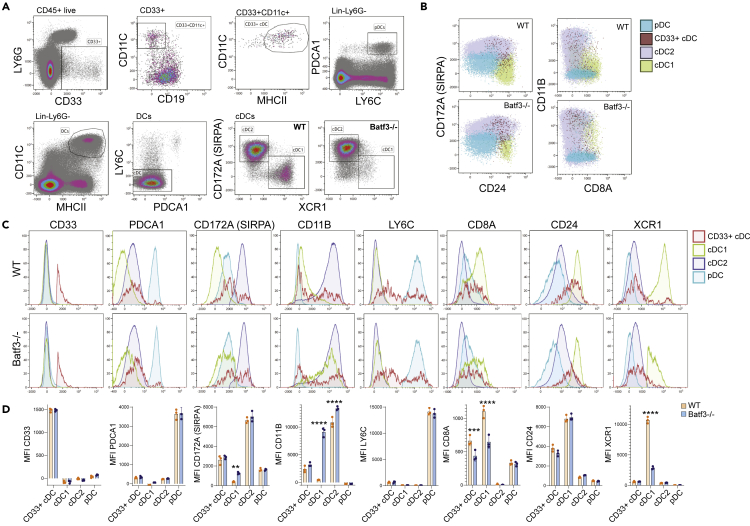
Conventional dendritic cells (cDCs) are traditionally subdivided into cDC1 and cDC2 lineages. Batf3 is a cDC1-required transcription factor, and we observed that Batf3-/- mice harbor a population of cDC1-like cells co-expressing cDC2-associated surface molecules. Using single-cell RNA sequencing with integrated cell surface protein expression (CITE-seq), we found that Batf3-/- mitotic immature cDC1-like cells showed reduced expression of cDC1 features and increased levels of cDC2 features. In wild type, we also observed a proportion of mature cDC1 cells expressing surface features characteristic to cDC2 and found that overall cDC cell state heterogeneity was mainly driven by developmental stage, proliferation, and maturity. We detected population diversity within Sirpa+ cDC2 cells, including a Cd33+ cell state expressing high levels of Sox4 and lineage-mixed features characteristic to cDC1, cDC2, pDCs, and monocytes. In conclusion, these data suggest that multiple cDC cell states can co-express lineage-overlapping features, revealing a level of previously unappreciated cDC plasticity.

Keywords: Cell Biology; Immunology; Transcriptomics.


Conflict of interest statement

The authors declare no competing interests. S.L. is currently an employee of Boehringer-Ingelheim.

Figures

None
Graphical abstract
Figure 1
Figure 1
Absence of Batf3 leads to enrichment of lineage-intermediate cDCs (A and B) MHCII+ CD11c+ splenic cDCs of C57BL/6 WT and Batf3−/− mice were assessed for expression of CD8 and CD11b by imaging flow cytometry. (A) Pre-gated to MHCII+ CD11c+ cells, cDC1 cells were identified as CD8+CD11b−, cDC2 cells as CD8−CD11b+, and lineage-intermediate cDCs as CD8+CD11b+ (Figure S1). BF, brightfield; merge, overlay of CD8 and CD11b. (B) Intensities of CD8 and CD11b was compared between C57BL/6 WT and Batf3−/− cDC lineages. Each data point represents an individual cell with mean and interquartile range indicated. (C) cDCs in splenocytes of C57BL/6 WT and Batf3-/- mice (n=5) were immunoprofiled using conventional flow cytometry. The number of CD8+CD11b+ cDCs per 100,000 B cells was compared. Statistical significance was determined using one-way ANOVA followed by Tukey's multiple comparison test. ∗p < 0.05, ∗∗p < 0.01, ∗∗∗p < 0.001, ∗∗∗∗p < 0.0001. Shown is one of two independent experiments. See also Figure S1.
Figure 2
Figure 2
Splenic cDC compartment consists of heterogeneous cell states of cDC1 and cDC2 Sorted MHCII+ CD11c+ splenic DCs of C57BL/6 and Batf3−/− mice (see Figure S2) were incubated with Total-Seq antibodies and sequenced using the 10X Genomics droplet-based sequencing platform. Application of the Seurat pipeline resulted in 20 clusters at resolution 0.5. (A) UMAP depicting clusters based on Louvain algorithm using the FindNeighbors function in Seurat. (B) Proportion and number of cells assigned to WT and Batf3−/− genotypes. (C) SingleR prediction of clusters using the ImmGen database-identified DC clusters and non-DC contaminations. (D) Gene set enrichment analysis (GSEA) using DC gene signatures from (Miller et al., 2012) and the AUCell package (see Table S2). (E) Density plots of key canonical DC and monocyte-delineating features using the Nebulosa package (Jose Alquicira-Hernandez, 2020). (F) Definition of cluster groups for cDC1, Sirpa+ DCs, pDCs, and monocytes. (G) GSEA of Sirpa+ DC clusters and monocytes (C15) using cDC2a and cDC2b gene signatures from Brown et al. (2019) and the AUCell package (see Table S2). (H) Ridgeplot of Cd7 expression. (I) Density plots of key genes delineating Sirpa+ cDC clusters using the Nebulosa package. (J) Expression of maturation-associated and TLR genes. (K) Distribution and proportion of cells assigned to cell cycle phases based on the expression of gene signatures of the G1, S, and G2/M phases (see Table S5). See also Table 1, Figures S3 and S4, Tables S1, S3, and S4.
Figure 3
Figure 3
Diversity in Sirpa+ DCs is less distinct than diversity between other DC lineages (A) Clusters defined by active cell cycle or metabolic activity were excluded, and metaclusters corresponding to cDC1, cDC2a, cDC2b, Il4i1+ cDC2m Sox4+ cDC, pDC, and monocytes were established. (B) Dotplots showing the top 50 DEGs of each metacluster (see Table S6). (C) Dotplots showing expression of immune checkpoint genes in each metacluster.
Figure 4
Figure 4
Total-Seq antibodies verify cDC1 and cDC2 identity (A) Verification of Total-Seq antibody binding. Total-Seq antibodies were hybridized with a fluorochrome-conjugated dT probe and subsequently incubated with C57BL/6 splenocytes together with fluorochrome-conjugated antibodies against CD11c and MHCII. Cells were pre-gated on CD11c+ MHCII+ DCs and analyzed for binding of Total-Seq antibodies. Positive signal for Total-Seq antibodies were used to determine thresholds for bioinformatics analysis of adt signals. Total-Seq antibodies where specific staining could not be confirmed were excluded from further analysis of CITE-seq data. (B) Adt sequencing data of each cluster was converted to FSC files using the flowCore package and analyzed using flow cytrometric BD Kaluza analysis software. Shown are median adt tag counts for each cluster. Horizontal line represents background, based on cDC2 cluster C0 for cDC1 features CD8A, CD24, and XCR1, and based on cDC1 cluster C4 for cDC2 features CD11b, CD172A, and CD4. (C) Adt data of cDC1 features CD8A, CD24, and XCR1 or cDC2 features CD11B and CD172A were compared between WT and Batf3−/− genotypes. (D) Featureplots of RNA and corresponding thresholded adt counts. (E) Dotplot of thresholded adt counts for each cluster.
Figure 5
Figure 5
Residual mitotic cDC1-like cells in Batf3−/− mice increase expression of cDC2 features (A) GO analysis of cDC1 clusters C4, C6, C12, C17, and C18 (see Table S7). (B) Distribution of cells assigned to WT and Batf3−/− genotypes. (C) Trajectory analysis using RNA velocity. (D) DEGs between WT and Batf3−/− of cDC1 cluster C6 (see Table S1). (E) Top 40 DEGs between Batf3−/− mitotic cDC1 state C6 and Batf3−/− mitotic cDC2 state C5. (F) Gene expression of canonical cDC2 and cDC1 features between mitotic cDC1 state C6 and mitotic cDC2 state C5 (related to Figure S5). (G) Protein expression (adt) of canonical cDC2 and cDC1 features between mitotic cDC1 state C6 and mitotic cDC2 state C5. (H) DEGs between WT and Batf3−/− of cDC1 cluster C4 (see Table S1). (I) Gene and protein expression of canonical cDC1 features between mitotic cDC1 (C6), immature cDC1 (C4), and mature cDC1 (C12).
Figure 6
Figure 6
Characterization of a Sox4+ cDC cell state (A) Joint density of Itgam and Cd8a, using the Nebulosa package, identifying Sox4+ cDCs (C3) as cluster with co-expression in Batf3−/−. (B) Protein expression (adt signals) between metaclusters defined in Figure 3A. (C) Adt data of selected clusters were converted to FCS files and analyzed for co-expression of CD24 and CD172A or CD8A and CD11B using flow cytometric BD Kaluza software. (D) Expression of canonical DC genes between metaclusters. (E) Subclustering of Sox4+ cDCs (C3) using a resolution of 0.3. (F) GO pathway analysis of C3 subcluster-specific DEGs (see Table S8). (G) Distribution of canonical genes for DCs, pDCs, cDC1, cDC2, tDCs, and pre-DCs using the Nebulosa package. (H) GSEA using gene signatures from Brown et al. (2019); Leylek et al. (2019); Villani et al. (2017) and the AUCell package (see Table S2).
Figure 7
Figure 7
Immunophenotyping of CD33+ DCs Splenocytes of WT (n = 3) and Batf3−/− (n = 3) were incubated with a panel of 14 fluorochrome-conjugated antibodies. (A) CD33+ cDCs were gated as singlet live CD45+ LY6G− CD11C+ MHCII+. pDCs were gated as Lin− LY6G− PDCA1+ LY6C+. cDCs were gated as Lin− LY6G− CD11C+ MHCII+ LY6C−, and from these cDC1 and cDC2 were gated as XCR1+ or CD172A+, respectively. (B and C) Overlays of pDCs, cDC1, cDC2, and CD33+ cDCs. (D) Median fluorescence intensity (MFI) of cDC features between WT and Batf3−/− cDC1, cDC2, pDCs, and CD33+ cDCs. Each data point represents data of individual animal with mean ± standard error of the mean (SEM). Statistical significance was determined using unpaired t test with Welch correction. ∗∗p < v0.01, ∗∗∗p < 0.001, ∗∗∗∗p < 0.0001.

Similar articles

Cited by

References

    1. Aibar S., Gonzalez-Blas C.B., Moerman T., Huynh-Thu V.A., Imrichova H., Hulselmans G., Rambow F., Marine J.C., Geurts P., Aerts J. SCENIC: single-cell regulatory network inference and clustering. Nat. Methods. 2017;14:1083–1086. - PMC - PubMed
    1. Alcantara-Hernandez M., Leylek R., Wagar L.E., Engleman E.G., Keler T., Marinkovich M.P., Davis M.M., Nolan G.P., Idoyaga J. High-dimensional phenotypic mapping of human dendritic cells reveals interindividual variation and tissue specialization. Immunity. 2017;47:1037–1050 e6. - PMC - PubMed
    1. Alquicira-Hernandez J., Powell J.E. Nebulosa recovers single cell gene expression signals by kernel density estimation. Bioinformatics. 2021;47:btab003. - PubMed
    1. Amon L., Lehmann C.H.K., Heger L., Heidkamp G.F., Dudziak D. The ontogenetic path of human dendritic cells. Mol. Immunol. 2020;120:122–129. - PubMed
    1. Aran D., Looney A.P., Liu L., Wu E., Fong V., Hsu A., Chak S., Naikawadi R.P., Wolters P.J., Abate A.R. Reference-based analysis of lung single-cell sequencing reveals a transitional profibrotic macrophage. Nat. Immunol. 2019;20:163–172. - PMC - PubMed