The relationship of large city out-of-hospital cardiac arrests and the prevalence of COVID-19
- PMID: 33997730
- PMCID: PMC8102707
- DOI: 10.1016/j.eclinm.2021.100815
The relationship of large city out-of-hospital cardiac arrests and the prevalence of COVID-19
Abstract
Background: Though variable, many major metropolitan cities reported profound and unprecedented increases in out-of-hospital cardiac arrest (OHCA) in early 2020. This study examined the relative magnitude of those increases and their relationship to COVID-19 prevalence.
Methods: EMS (9-1-1 system) medical directors for 50 of the largest U.S. cities agreed to provide the aggregate, de-identified, pre-existing monthly tallies of OHCA among adults (age >18 years) occurring between January and June 2020 within their respective jurisdictions. Identical comparison data were also provided for corresponding time periods in 2018 and 2019. Equivalent data were obtained from the largest cities in Italy, United Kingdom and France, as well as Perth, Australia and Auckland, New Zealand.
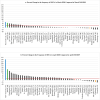
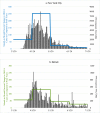
Findings: Significant OHCA escalations generally paralleled local prevalence of COVID-19. During April, most U.S. cities (34/50) had >20% increases in OHCA versus 2018-2019 which reflected high local COVID-19 prevalence. Thirteen observed 1·5-fold increases in OHCA and three COVID-19 epicenters had >100% increases (2·5-fold in New York City). Conversely, cities with lesser COVID-19 impact observed unchanged (or even diminished) OHCA numbers. Altogether (n = 50), on average, OHCA cases/city rose 59% during April (p = 0·03). By June, however, after mitigating COVID-19 spread, cities with the highest OHCA escalations returned to (or approached) pre-COVID OHCA numbers while cities minimally affected by COVID-19 during April (and not experiencing OHCA increases), then had marked OHCA escalations when COVID-19 began to surge locally. European, Australian, and New Zealand cities mirrored the U.S. experience.
Interpretation: Most metropolitan cities experienced profound escalations of OHCA generally paralleling local prevalence of COVID-19. Most of these patients were pronounced dead without COVID-19 testing.
Funding: No funding was involved. Cities provided de-identified aggregate data collected routinely for standard quality assurance functions.
© 2021 The Authors.
Conflict of interest statement
None of the authors or contributing investigators have any conflict of interest with respect to this observational, epidemiological, population-based cross-sectional research study which was based on routinely-collected public agency data sets.
Figures


Similar articles
-
Out-of-hospital cardiac arrest surveillance --- Cardiac Arrest Registry to Enhance Survival (CARES), United States, October 1, 2005--December 31, 2010.MMWR Surveill Summ. 2011 Jul 29;60(8):1-19. MMWR Surveill Summ. 2011. PMID: 21796098
-
Community first responders for out-of-hospital cardiac arrest in adults and children.Cochrane Database Syst Rev. 2019 Jul 19;7(7):CD012764. doi: 10.1002/14651858.CD012764.pub2. Cochrane Database Syst Rev. 2019. PMID: 31323120 Free PMC article.
-
Comparison of pre-hospital management of out-of-hospital cardiac arrest and its outcomes between the COVID-19 and pre-COVID-19 periods.Heliyon. 2024 Jun 17;10(13):e32615. doi: 10.1016/j.heliyon.2024.e32615. eCollection 2024 Jul 15. Heliyon. 2024. PMID: 39027553 Free PMC article.
-
[Investigation of out-of-hospital cardiac arrest in Zhengzhou City and the risk factors of prognosis of cardiopulmonary resuscitation: case analysis for 2016-2018].Zhonghua Wei Zhong Bing Ji Jiu Yi Xue. 2019 Apr;31(4):439-443. doi: 10.3760/cma.j.issn.2095-4352.2019.04.013. Zhonghua Wei Zhong Bing Ji Jiu Yi Xue. 2019. PMID: 31109417 Chinese.
-
An international perspective of out-of-hospital cardiac arrest and cardiopulmonary resuscitation during the COVID-19 pandemic.Am J Emerg Med. 2021 Sep;47:192-197. doi: 10.1016/j.ajem.2021.04.033. Epub 2021 Apr 20. Am J Emerg Med. 2021. PMID: 33894661 Free PMC article. Review.
Cited by
-
A Systematic Review and Meta-Analysis of the Implementation of High-Performance Cardiopulmonary Resuscitation on Out-of-Hospital Cardiac Arrest Outcomes.J Clin Med. 2021 May 13;10(10):2098. doi: 10.3390/jcm10102098. J Clin Med. 2021. PMID: 34068157 Free PMC article.
-
Emerging Role of Platelet-Endothelium Interactions in the Pathogenesis of Severe SARS-CoV-2 Infection-Associated Myocardial Injury.Front Immunol. 2022 Feb 4;13:776861. doi: 10.3389/fimmu.2022.776861. eCollection 2022. Front Immunol. 2022. PMID: 35185878 Free PMC article. Review.
-
COVID-19: a gray swan's impact on the adoption of novel medical technologies.Humanit Soc Sci Commun. 2022;9(1):232. doi: 10.1057/s41599-022-01247-9. Epub 2022 Jul 8. Humanit Soc Sci Commun. 2022. PMID: 35821762 Free PMC article.
-
Acute SARS-CoV-2 Infection and Incidence and Outcomes of Out-of-Hospital Cardiac Arrest.JAMA Netw Open. 2023 Oct 2;6(10):e2336992. doi: 10.1001/jamanetworkopen.2023.36992. JAMA Netw Open. 2023. PMID: 37801312 Free PMC article.
-
Cases of acute coronary syndrome and presumed cardiac death prior to arrival at an urban tertiary care hospital in Pakistan during the COVID-19 pandemic.PLoS One. 2022 Feb 3;17(2):e0263607. doi: 10.1371/journal.pone.0263607. eCollection 2022. PLoS One. 2022. PMID: 35113963 Free PMC article.
References
LinkOut - more resources
Full Text Sources
Other Literature Sources
Miscellaneous

