

Dysglycemia in adults at risk for or living with non-insulin treated type 2 diabetes: Insights from continuous glucose monitoring
- PMID: 33997745
- PMCID: PMC8093893
- DOI: 10.1016/j.eclinm.2021.100853
Dysglycemia in adults at risk for or living with non-insulin treated type 2 diabetes: Insights from continuous glucose monitoring
Abstract
Background: Continuous glucose monitoring (CGM) has demonstrable benefits for people living with diabetes, but the supporting evidence is almost exclusively from White individuals with type 1 diabetes. Here, we have quantified CGM profiles in Hispanic/Latino adults with or at-risk of non-insulin treated type 2 diabetes (T2D).
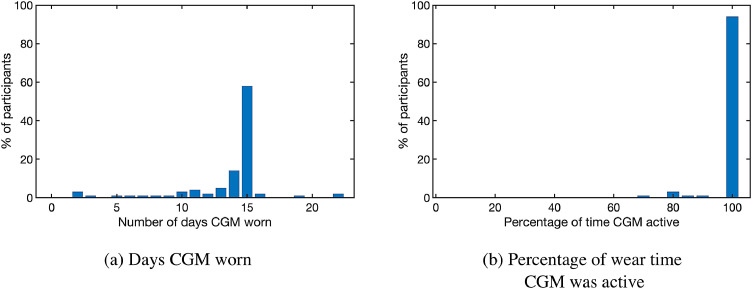
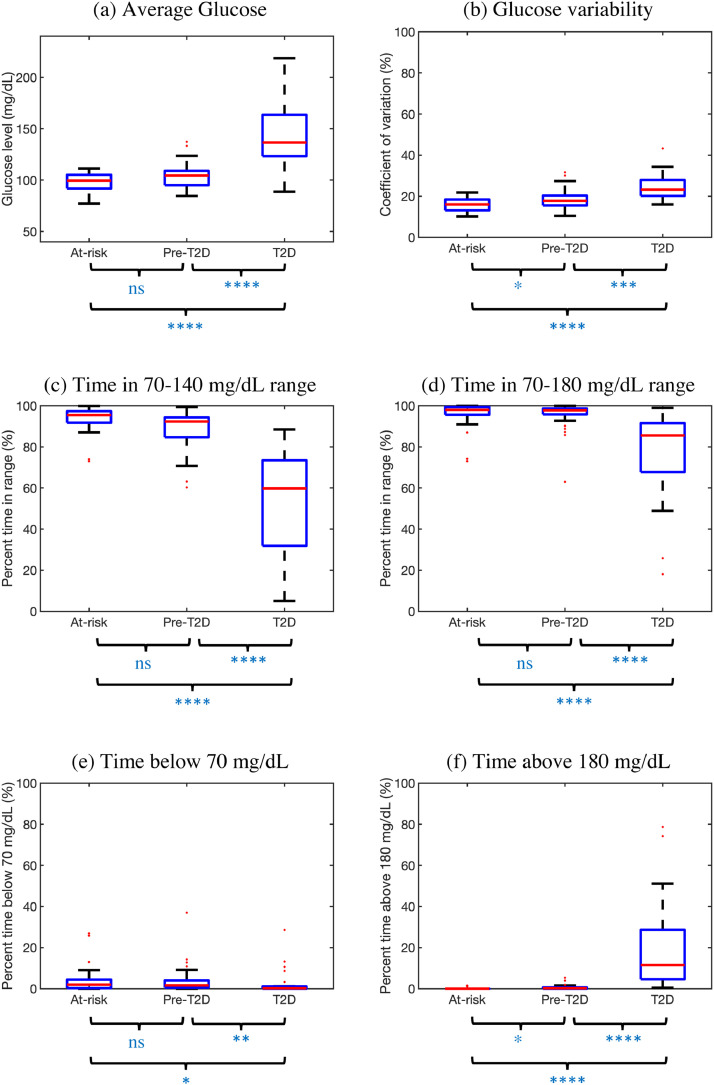
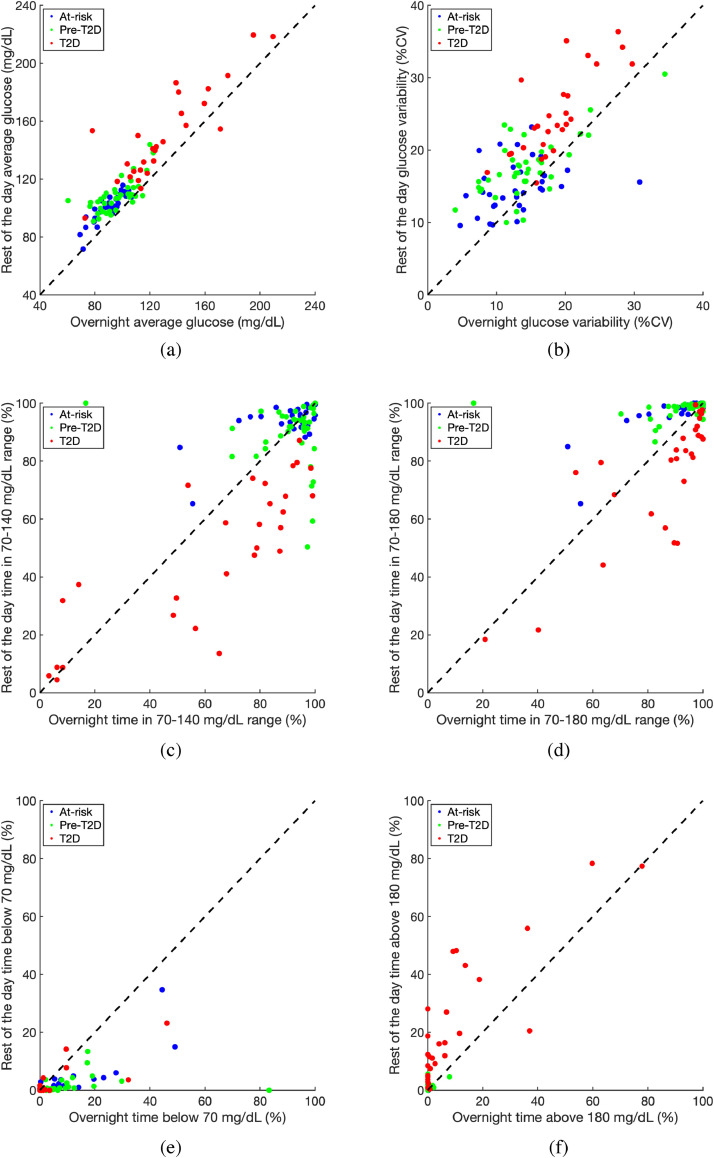
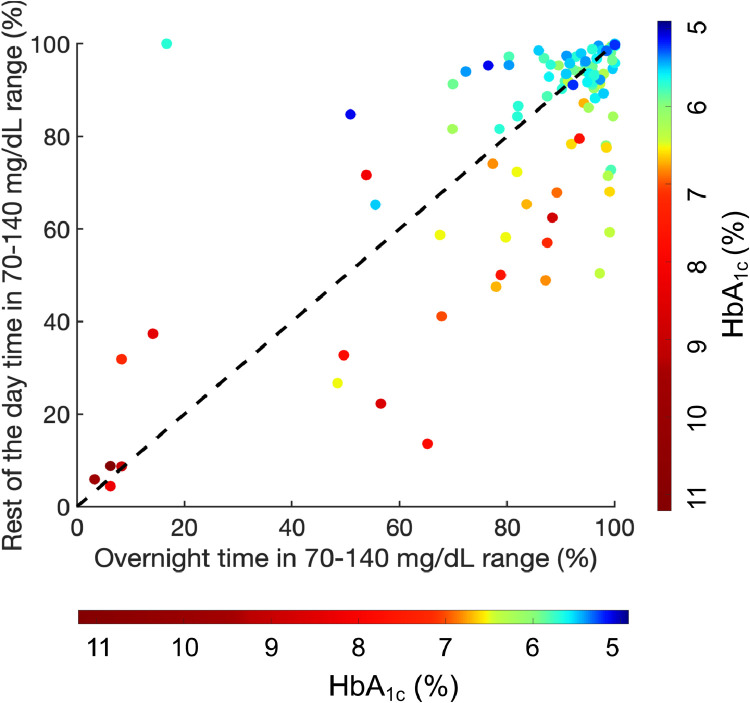
Methods: 100 participants (79 female, 86% Hispanic/Latino [predominantly Mexican], age 54·6 [±12·0] years) stratified into (i) at risk of T2D, (ii) with pre-diabetes (pre-T2D), and (iii) with non-insulin treated T2D, wore blinded CGMs for 2 weeks. Beyond standardized CGM measures (average glucose, glucose variability, time in 70-140 mg/dL and 70-180 mg/dL ranges), we also examined additional CGM measures based on the time of day.
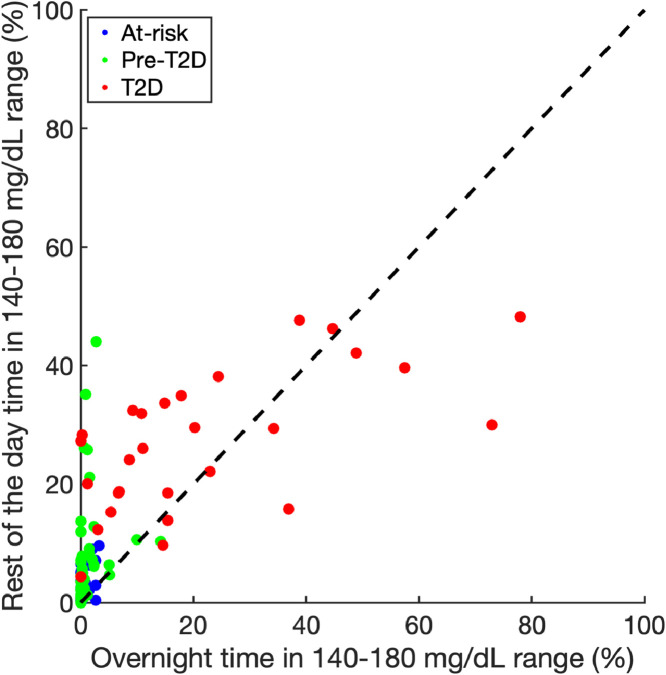
Findings: Standardized CGM measures were significantly different for participants with T2D compared to at-risk and pre-T2D participants (p<0·0001). In addition, pre-T2D participants spent more time between 140 and 180 mg/dL during the day than at-risk participants (p<0·01). T2D participants spent more time between 140 and 180 mg/dL both during the day and overnight compared to at-risk and pre-T2D participants (both p<0·0001). Time in 70-140 mg/dL range during the day was significantly correlated with HbA1c (r=-0·72, p<0·0001), after adjusting for age, sex, BMI, and waist circumference (p<0·0001).
Interpretation: Standardized CGM measures show a progression of dysglycemia from at-risk of T2D, to pre-T2D, and to T2D. Stratifying CGM readings by time of day and the range 140-180 mg/dL provides additional metrics to differentiate between the groups.
Funding: US Department of Agriculture (Grant #2018-33800-28404) and NSF PATHS-UP ERC (Award #1648451).
Keywords: Continuous glucose monitoring; Hispanic/Latino adults; Pre-diabetes; Time in range; Type 2 diabetes.
© 2021 The Authors.
Conflict of interest statement
DK reports non-financial support from Abbott Diabetes Care, during the conduct of the study; grants from Lilly, personal fees from Sanofi, personal fees from NovoNordisk, personal fees from Glooko, outside the submitted work. NG, CC, AL, and WB report non-financial support from Abbott Diabetes Care, grants from US Dept of Agriculture, during the conduct of the study; grants from Lilly, outside the submitted work. SB and AS declare no competing interest(s).
Figures
Similar articles
-
The northeast glucose drift: Stratification of post-breakfast dysglycemia among predominantly Hispanic/Latino adults at-risk or with type 2 diabetes.EClinicalMedicine. 2021 Dec 20;43:101241. doi: 10.1016/j.eclinm.2021.101241. eCollection 2022 Jan. EClinicalMedicine. 2021. PMID: 34988413 Free PMC article.
-
Glycemic Outcomes and Feature Set Engagement Among Real-Time Continuous Glucose Monitoring Users With Type 1 or Non-Insulin-Treated Type 2 Diabetes: Retrospective Analysis of Real-World Data.JMIR Diabetes. 2023 Jan 18;8:e43991. doi: 10.2196/43991. JMIR Diabetes. 2023. PMID: 36602920 Free PMC article.
-
Improvement in Glucose Regulation Using a Digital Tracker and Continuous Glucose Monitoring in Healthy Adults and Those with Type 2 Diabetes.Diabetes Ther. 2021 Jul;12(7):1871-1886. doi: 10.1007/s13300-021-01081-3. Epub 2021 May 28. Diabetes Ther. 2021. PMID: 34047962 Free PMC article.
-
Use of Continuous Glucose Monitoring in Youth-Onset Type 2 Diabetes.Curr Diab Rep. 2017 Sep;17(9):66. doi: 10.1007/s11892-017-0905-0. Curr Diab Rep. 2017. PMID: 28726154 Review.
-
Role of continuous glucose monitoring for type 2 in diabetes management and research.J Diabetes Complications. 2017 Jan;31(1):280-287. doi: 10.1016/j.jdiacomp.2016.10.007. Epub 2016 Oct 14. J Diabetes Complications. 2017. PMID: 27818105 Review.
Cited by
-
Difference on Glucose Profile From Continuous Glucose Monitoring in People With Prediabetes vs. Normoglycemic Individuals: A Matched-Pair Analysis.J Diabetes Sci Technol. 2024 Mar;18(2):414-422. doi: 10.1177/19322968221123530. Epub 2022 Sep 13. J Diabetes Sci Technol. 2024. PMID: 36715208 Free PMC article.
-
Mining associations between glycemic variability in awake-time and in-sleep among non-diabetic adults.Front Med Technol. 2022 Nov 4;4:1026830. doi: 10.3389/fmedt.2022.1026830. eCollection 2022. Front Med Technol. 2022. PMID: 36405569 Free PMC article.
-
Non-Invasive Continuous Glucose Monitoring in Patients Without Diabetes: Use in Cardiovascular Prevention-A Systematic Review.Sensors (Basel). 2025 Jan 1;25(1):187. doi: 10.3390/s25010187. Sensors (Basel). 2025. PMID: 39796978 Free PMC article.
-
A probabilistic computation framework to estimate the dawn phenomenon in type 2 diabetes using continuous glucose monitoring.Sci Rep. 2024 Feb 5;14(1):2915. doi: 10.1038/s41598-024-52461-1. Sci Rep. 2024. PMID: 38316854 Free PMC article.
-
Defining Continuous Glucose Monitor Time in Range in a Large, Community-Based Cohort Without Diabetes.J Clin Endocrinol Metab. 2025 Mar 17;110(4):1128-1134. doi: 10.1210/clinem/dgae626. J Clin Endocrinol Metab. 2025. PMID: 39257191 Free PMC article.
References
-
- Deiss D., Bolinder J., Riveline J.-.P. Improved glycemic control in poorly controlled patients with type 1 diabetes using real-time continuous glucose monitoring. Diabetes Care. 2006;29:2730–2732. - PubMed
-
- Battelino T., Bergenstal R.M. Continuous glucose monitoring–derived data report—simply a better management tool. Diabetes Care. 2020;43:2327–2329. - PubMed
-
- Lind M., Polonsky W., Hirsch I.B. Continuous glucose monitoring vs conventional therapy for glycemic control in adults with type 1 diabetes treated with multiple daily insulin injections: the GOLD randomized clinical trial. JAMA. 2017;317:379–387. - PubMed
LinkOut - more resources
Full Text Sources
Other Literature Sources
Miscellaneous
