. 2021 Jan;2(1):34-48.
doi: 10.1038/s43018-020-00135-y. Epub 2020 Nov 9.

CDK4/6 inhibition reprograms the breast cancer enhancer landscape by stimulating AP-1 transcriptional activity

Affiliations

CDK4/6 inhibition reprograms the breast cancer enhancer landscape by stimulating AP-1 transcriptional activity

April C Watt et al. Nat Cancer. 2021 Jan.

Abstract

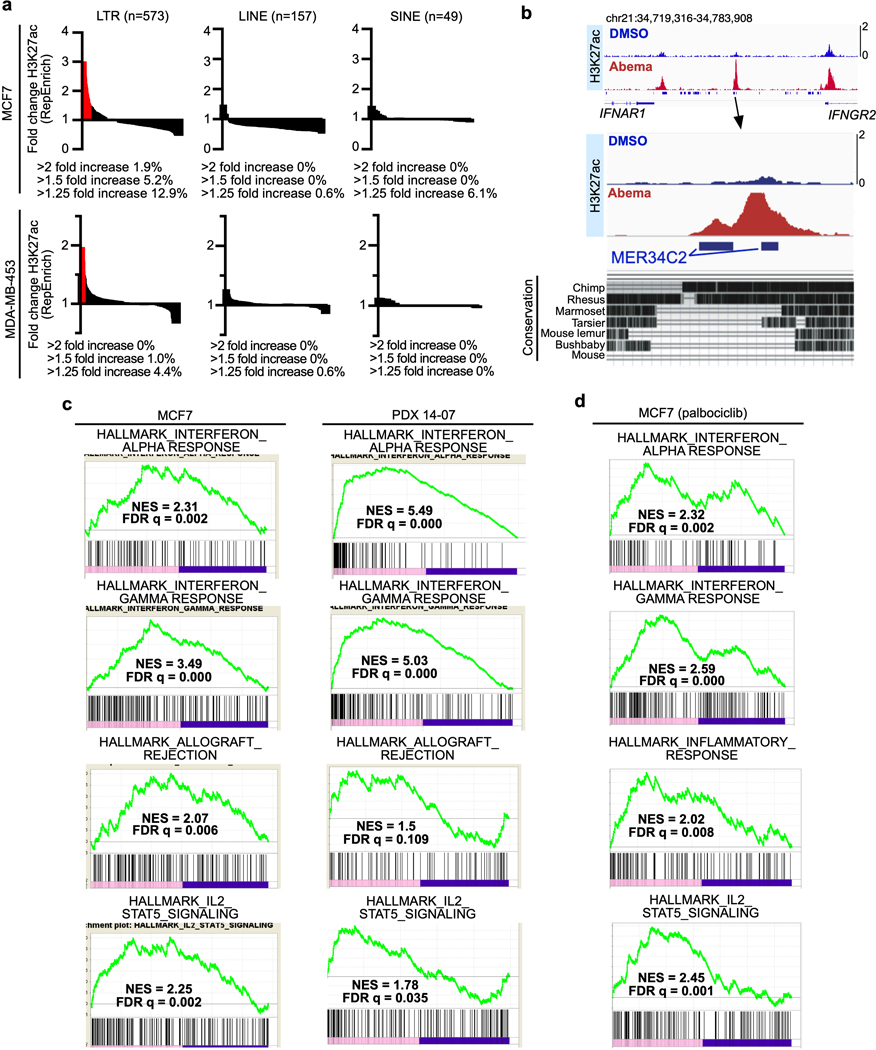
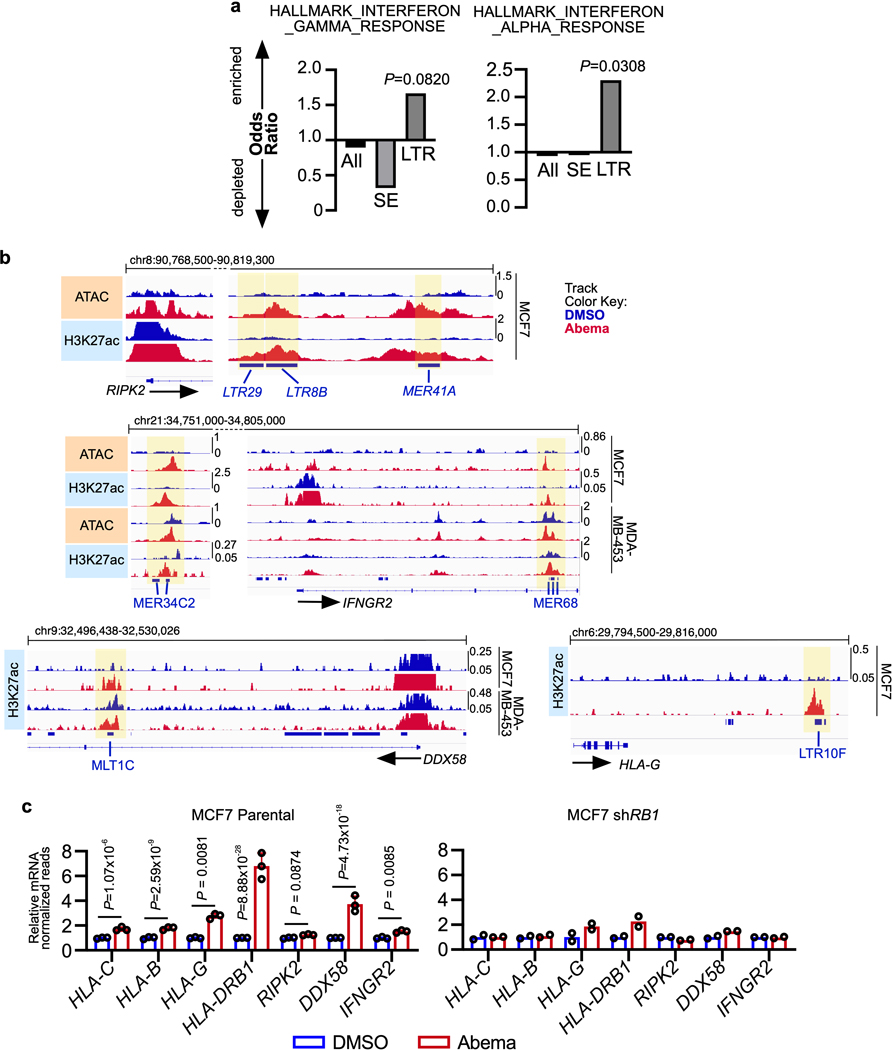
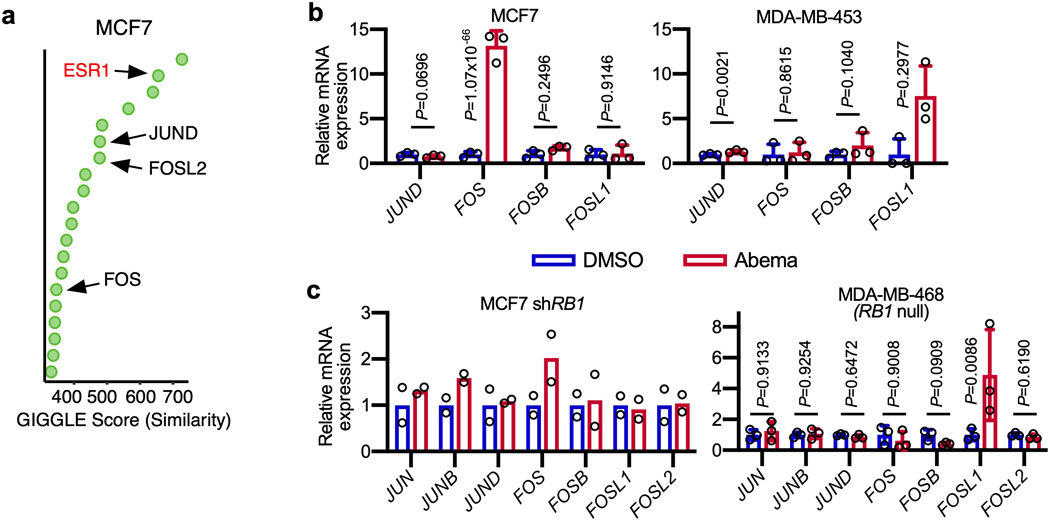
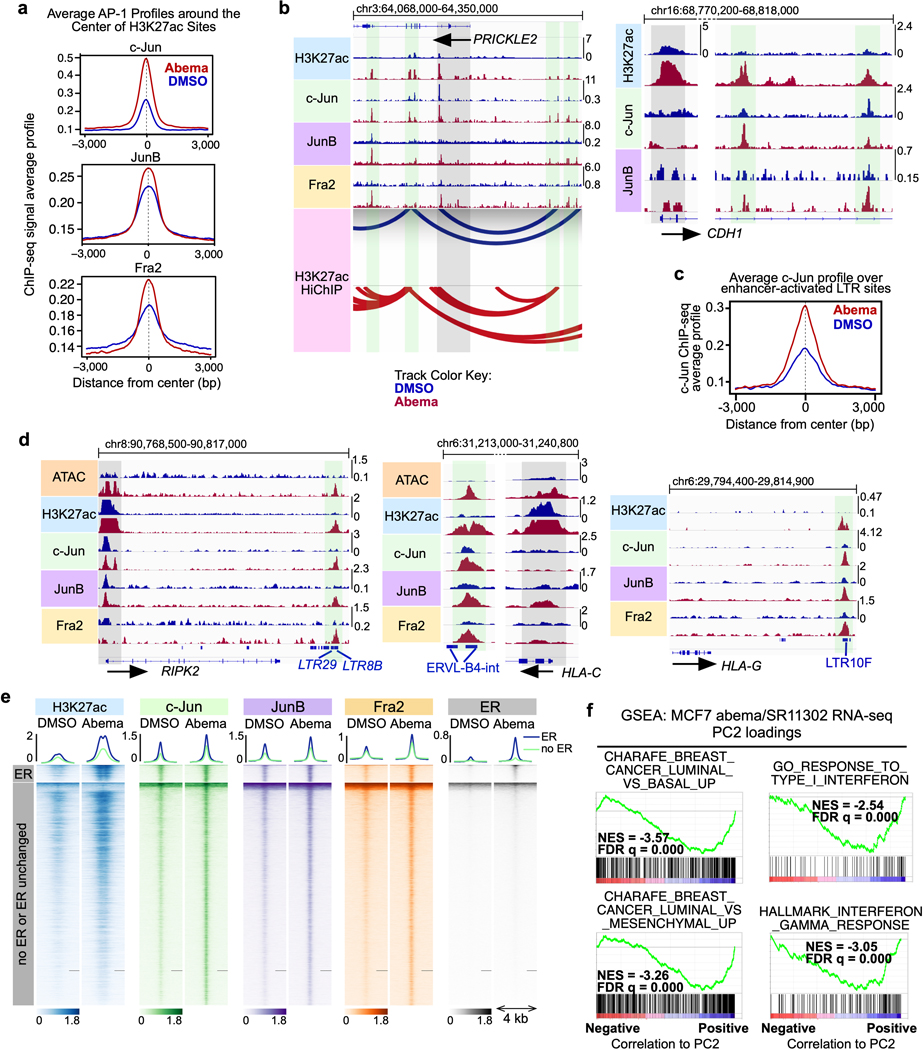
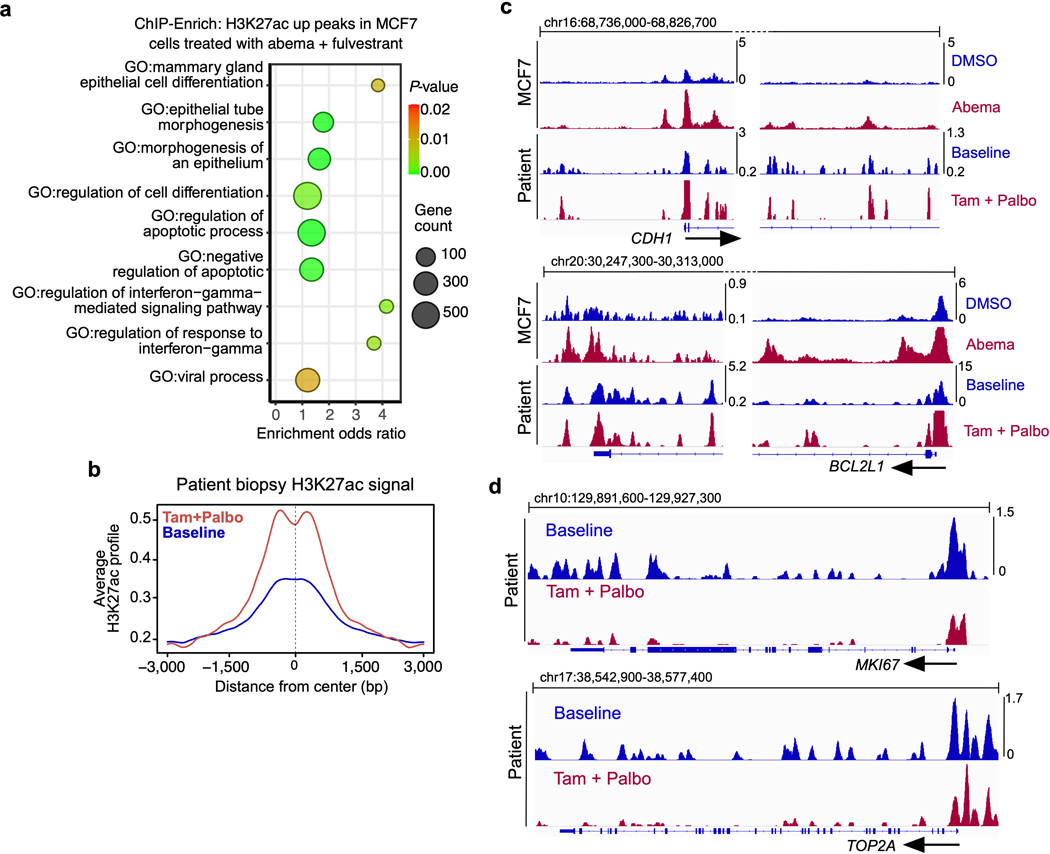
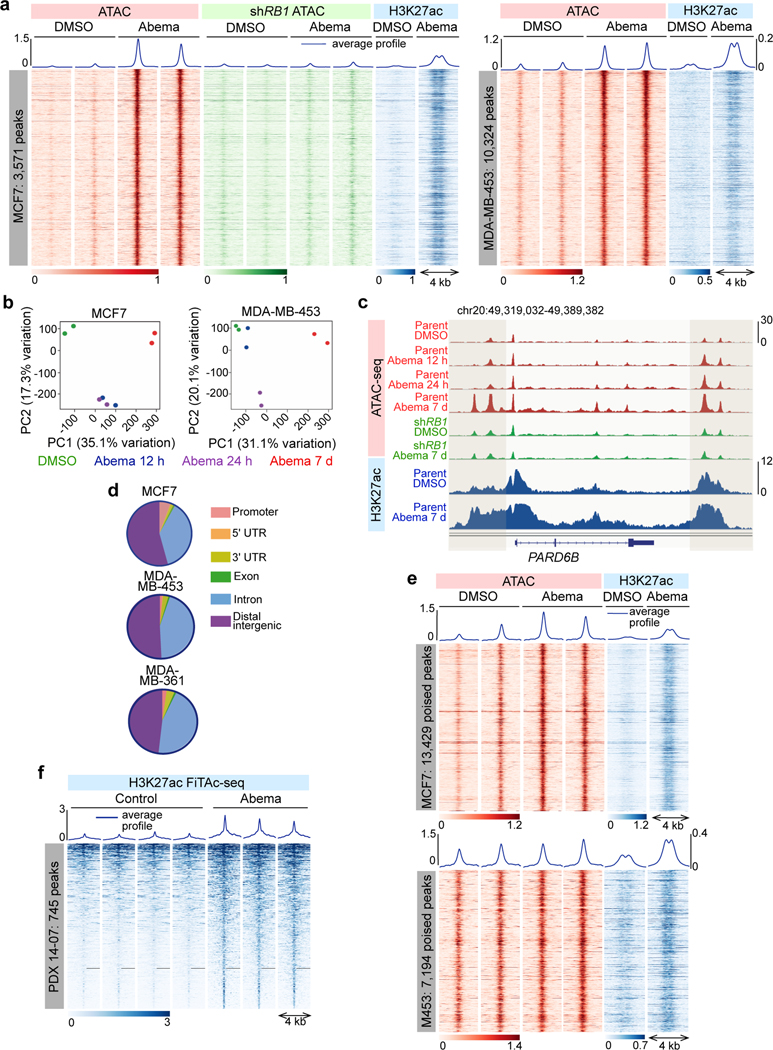
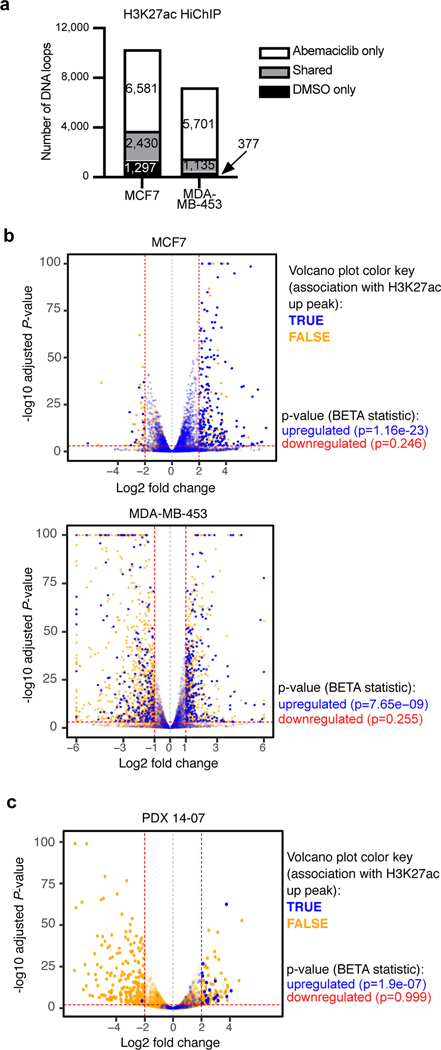
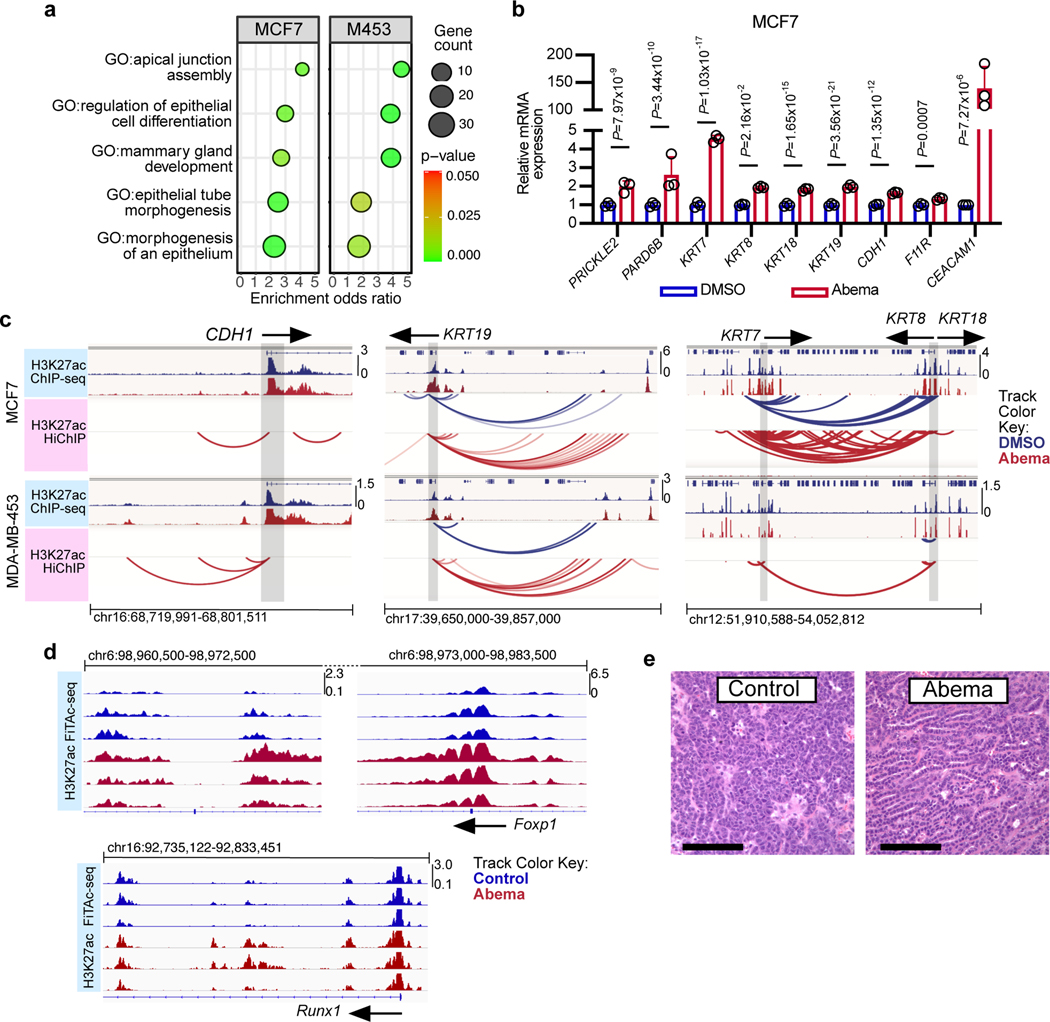
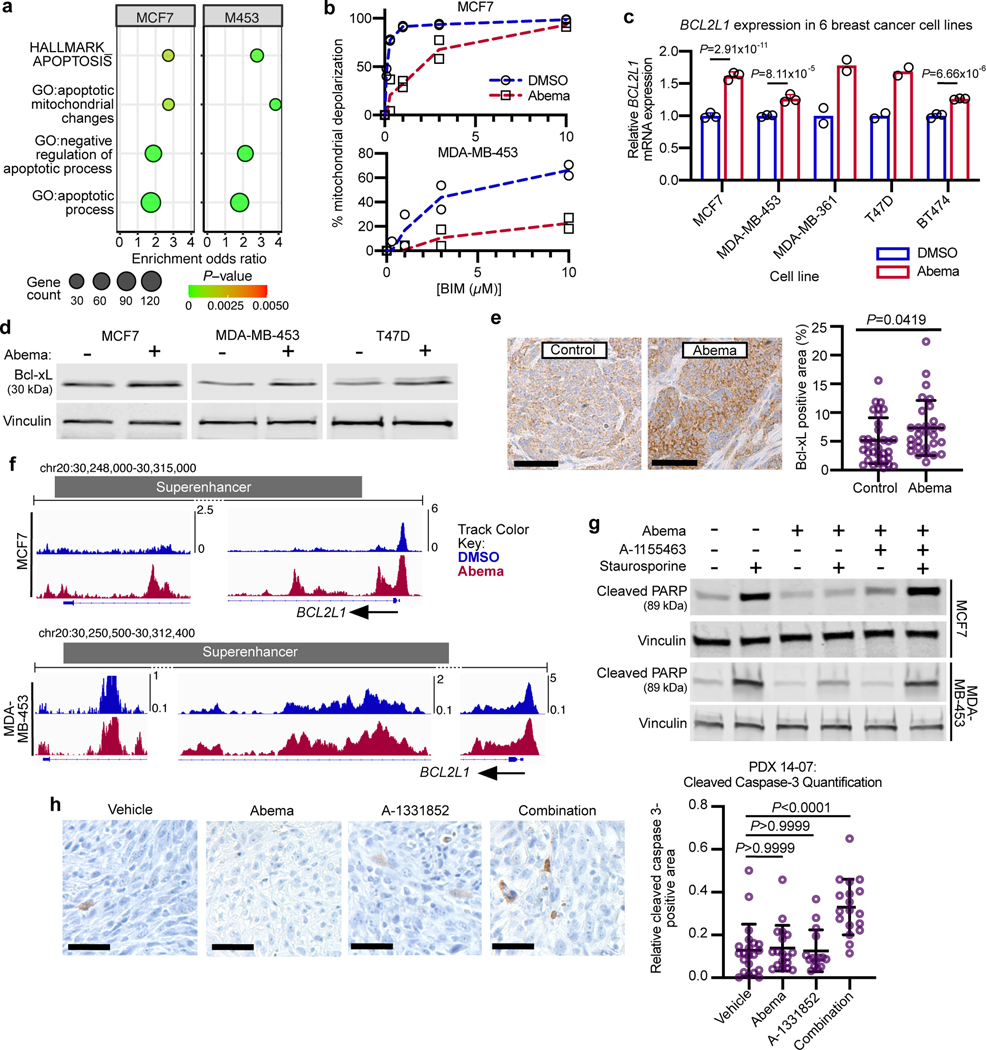
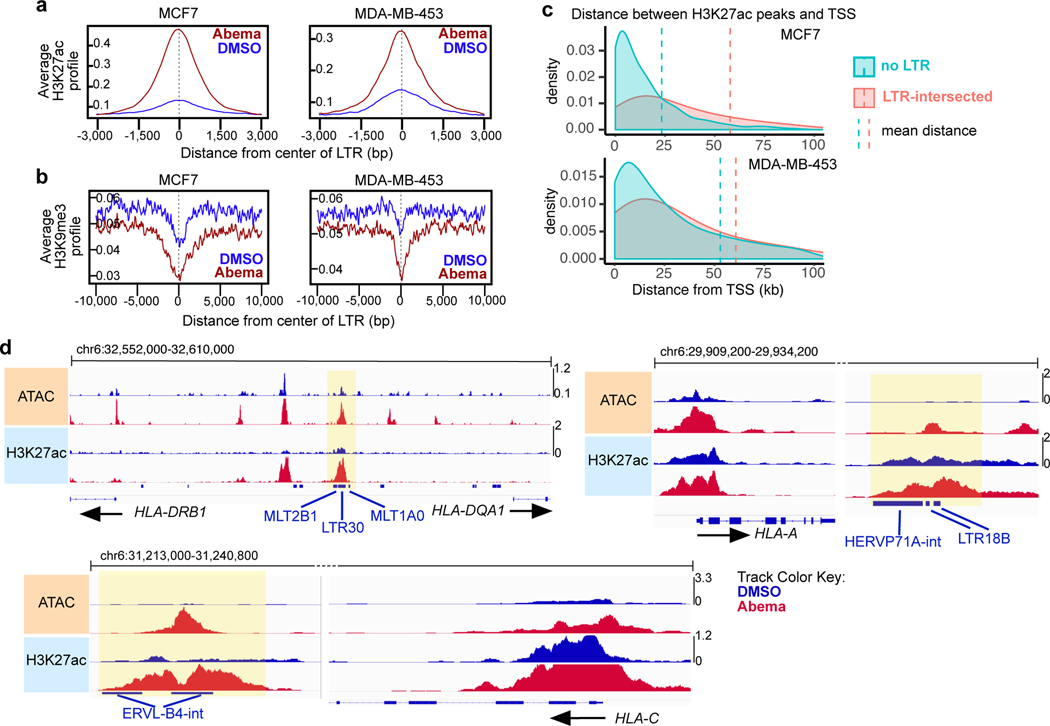
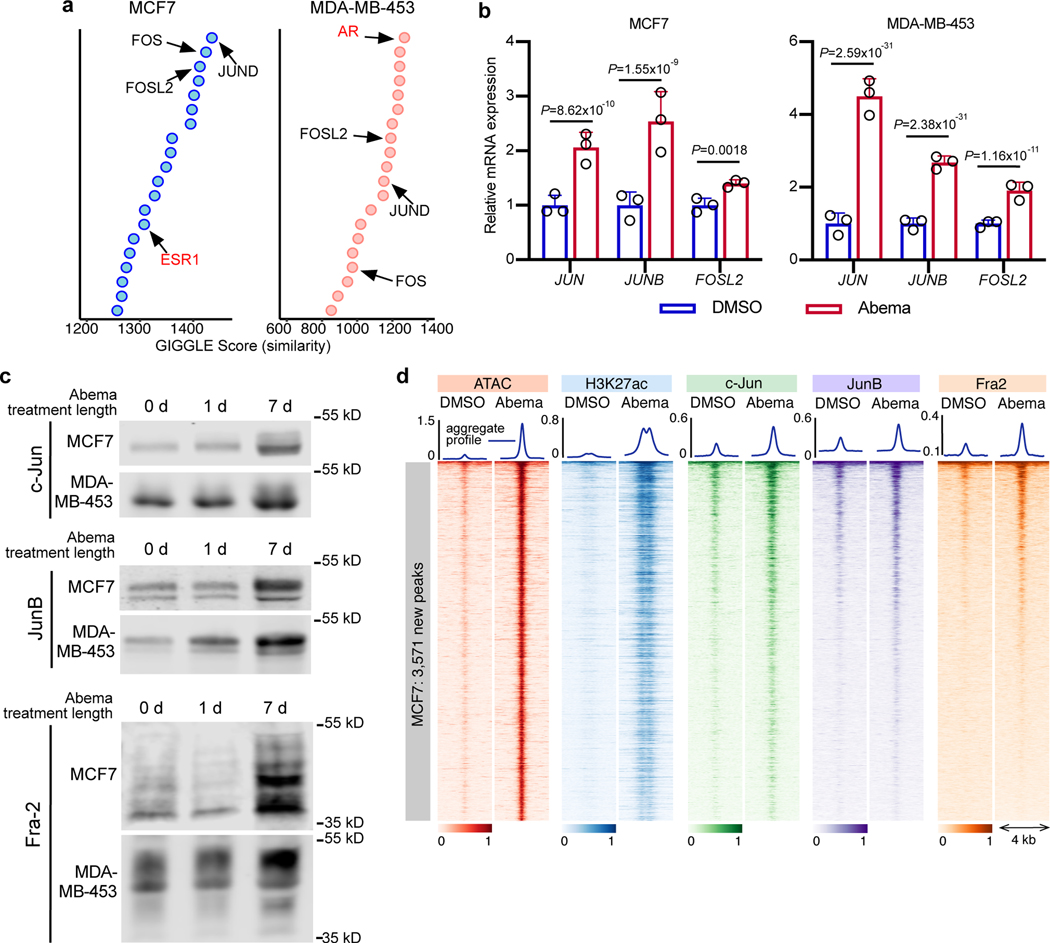
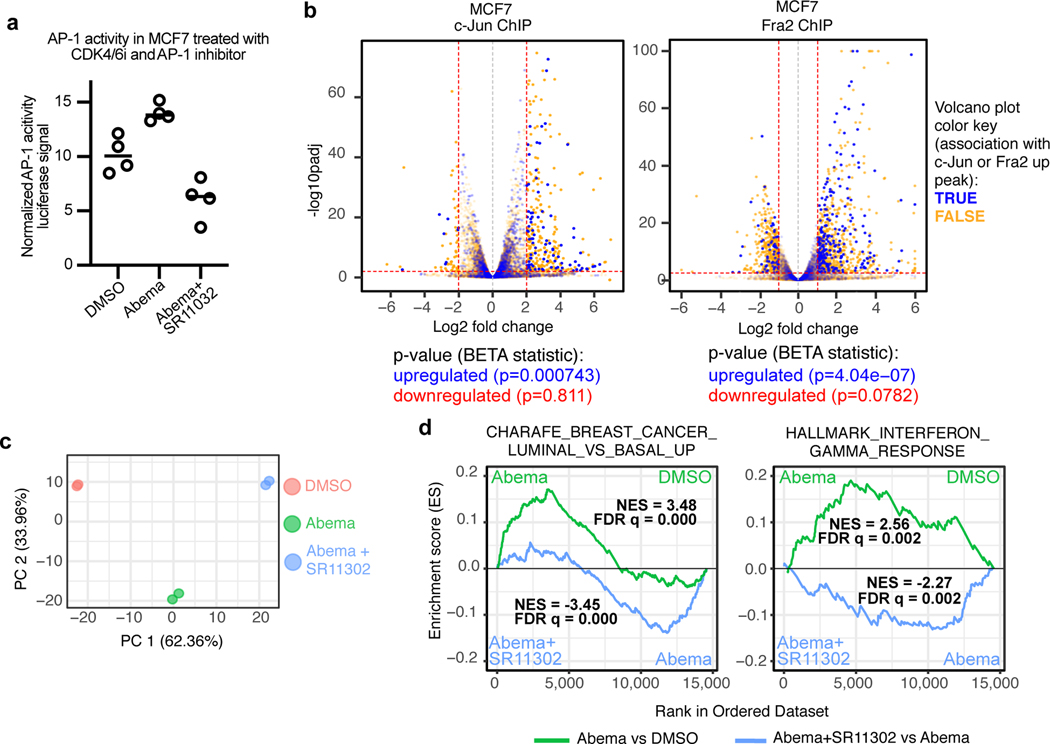
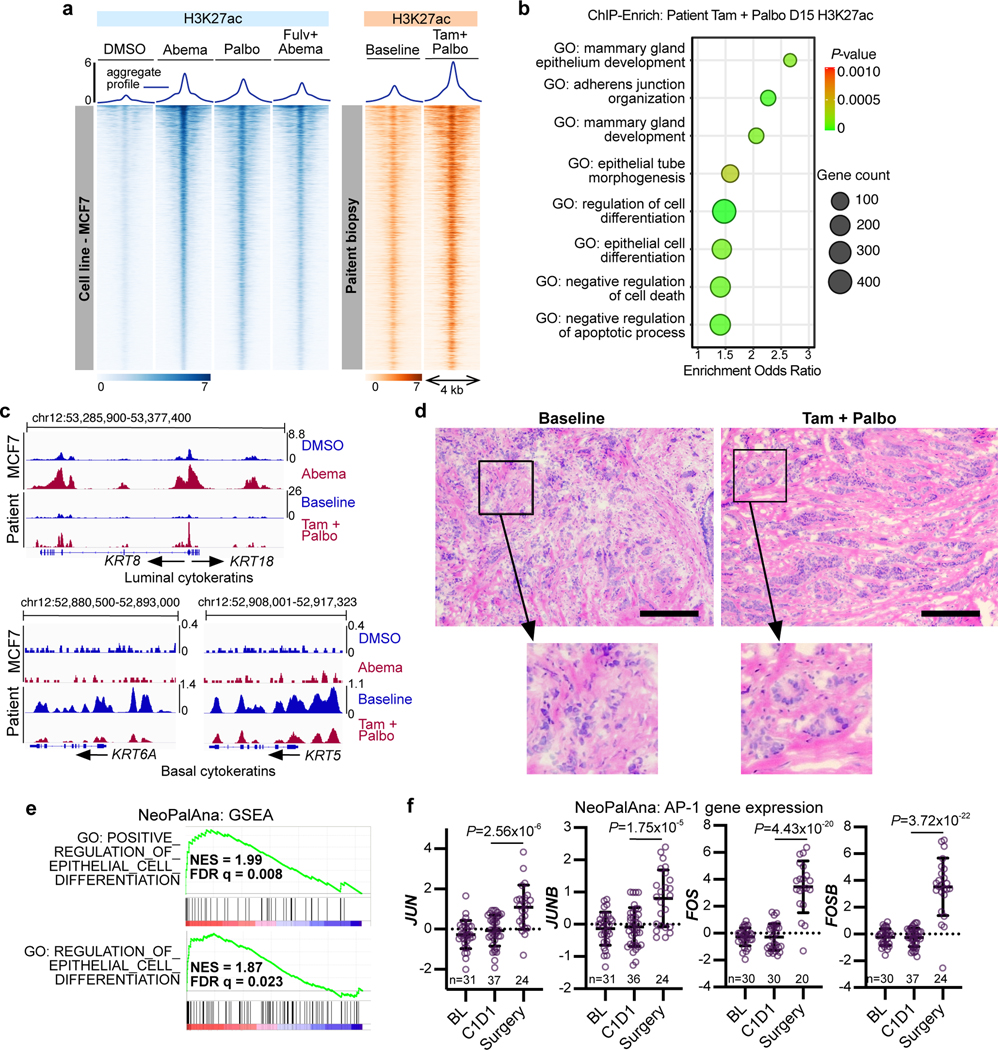
Pharmacologic inhibitors of cyclin-dependent kinases 4 and 6 (CDK4/6) were designed to induce cancer cell cycle arrest. Recent studies have suggested that these agents also exert other effects, influencing cancer cell immunogenicity, apoptotic responses, and differentiation. Using cell-based and mouse models of breast cancer together with clinical specimens, we show that CDK4/6 inhibitors induce remodeling of cancer cell chromatin characterized by widespread enhancer activation, and that this explains many of these effects. The newly activated enhancers include classical super-enhancers that drive luminal differentiation and apoptotic evasion, as well as a set of enhancers overlying endogenous retroviral elements that is enriched for proximity to interferon-driven genes. Mechanistically, CDK4/6 inhibition increases the level of several Activator Protein-1 (AP-1) transcription factor proteins, which are in turn implicated in the activity of many of the new enhancers. Our findings offer insights into CDK4/6 pathway biology and should inform the future development of CDK4/6 inhibitors.


Conflict of interest statement

Competing Interests Statement S.G. is the recipient of research funding from Eli Lilly and Co which has been used to support a part of this work. S.G. has served as a paid advisory board member for Eli Lilly and Co, G1 Therapeutics, Pfizer, and Novartis. S.G. also conducts laboratory research sponsored by G1 Therapeutics and clinical research sponsored by Eli Lilly and Co and by Novartis. J.J.Z. is founder and board director of Crimson Biotech and Geode Therapeutics. J.M. is a consultant for Oncoheroes Biosciences and Vivid Biosciences. M.B. receives sponsored research support from Novartis. M.B. is a consultant to H3 Biomedicine and serves on the SAB of Kronos Bio and GV20 Therapeutics. C.M. is a consultant for Pfizer, Novartis, Seattle Genetics and Eli Lilly and Co and receives institutional research funding from Pfizer and Puma. I.K. receives institutional research funding and grants from Genentech/Roche and Pfizer. I.K. is an advisory board participant, consultant, and has received honoraria from Daiichi/Sankyo, Macrogenics, and Genentech/Roche. I.K. is an advisory board participant and has received honoraria from Context Therapeutics, Taiho Oncology, and Seattle Genetics. I.K. is a data monitoring board member at Novartis. E.W. is a consultant at and has received honoraria from Carrick Therapeutics, DragonFly, Genentech/Roche, Genomic Health, GSK, Jounce, Eli Lilly and Co, Seattle Genetics, and Merck. E.W. is a scientific advisory board member and has received honoraria from Leap. M.E. has patents and receives royalties from prosigna/Nanostring. O. M.-F. receives institutional research funding from AbbVie, Genentech, Roche, and Pfizer, and has received honoraria from Roche. M.A.D. has been a member of the advisory boards for CTX CRC, Storm Therapeutics, Celgene and Cambridge Epigenetix. The Dawson lab receives research funding from CTX CRC. All other authors declare no conflicts of interest.

Figures

Extended Data Fig. 1
Extended Data Fig. 1. Transcriptional, phenotypic, and epigenetic effects of CDK4/6 inhibitors in human breast cancer cells.
a, Relative RNA-seq normalized reads of representative E2F target genes in breast cancer cell lines treated with abemaciclib for the indicated times (n=2 in MCF7, n=1 in MDA-MB-453, independent cultures). b, Percentage of cells in S-phase in cell lines treated with dimethyl sulfoxide (DMSO; control) or abemaciclib (abema) for 24 hours (n=3 independent cultures). c, Representative senescence-associated β-galactosidase staining (blue) of cells treated with DMSO or abemaciclib for 1, 3, or 7 days. Scale bars represent 200 μm. Representative images of two independent experiments in MCF7 and two technical replicates from one experiment in MDA-MB-453. d, Genomic distribution of regions of significantly reduced ATAC-seq signal in cells treated with abemaciclib, compared to DMSO. e, GREAT (Genomic Regions Enrichment of Annotations) analysis of regions of significantly reduced ATAC-seq signal within 10 kb of the single nearest gene in cells treated with abemaciclib for 7 days (compared to DMSO). f, Number of regions with significantly increased ATAC-seq signal in cells treated with abemaciclib as indicated. g, Heatmap of regions with significantly increased ATAC-seq peak signal after abemaciclib treatment in MDA-MB-361. Up-peaks were determined by a threshold of adjusted P<0.05 calculated by DESeq2. h, Western blot for RB in MCF7 shLuc and shRB1 cells, representative images from two independent experiments. Western blots are cropped; uncropped blot images for the experiments in this figure are shown in Source Data Extended Data Fig. 1. i, Relative RNA-seq normalized reads of cell cycle-related genes in MCF7 shRB1 cells and MCF7 shLuc cells (n=2 independent cultures) treated with DMSO or abemaciclib. j,k, Composite profiles of H3K27ac (j) and H3K9me3 (k) ChIP-seq signals at regions of significantly increased ATAC-seq signal in MCF7 and MDA-MB-453 treated with DMSO or abemaciclib for 7 days. l, Heatmap of H3K27ac ChIP-seq profiles in MCF7 treated with DMSO, abemaciclib, or palbociclib at abemaciclib-induced H3K27ac up-peak regions. m, Sample-sample correlation between RNA-seq samples of MCF7 and MDA-MB-453 treated with DMSO or abemaciclib (parental: n=3; shRB1: n=2).
Extended Data Fig. 2
Extended Data Fig. 2. Characterization of CDK4/6 inhibitor-activated super-enhancers in breast cancer cell lines.
a, Signal distribution at abemaciclib-activated H3K27ac-marked enhancers in MCF7 and MDA-MB-453 cells. Arrows indicate the positioning of super-enhancers (to the right of dashed line). b, Schema for analysis of biological processes regulated by abemaciclib-activated super-enhancers. c, GO analysis of non-TSS ends of H3K27ac-decorated genomic loops (HiChIP) identified exclusively in abemaciclib-treated MCF7 and MDA-MB-453 cells. Odds ratios and P-values were calculated by ChIP-Enrich. d, Gene Set Enrichment Analysis (GSEA) of RNA-seq data from MCF7 and MDA-MB-453 cells treated with abemaciclib compared to DMSO. e, RNA-seq log2 fold change of gene expression of all genes within indicated GSEA gene sets in MCF7 and MDA-MB-453 cells treated with DMSO or abemaciclib for 7 days, calculated by DESeq2. Each dot represents one gene: red, predicted to be regulated by abemaciclib-activated super-enhancers; blue, not predicted to be regulated by abemaciclib-activated super-enhancers. f, GSEA of RNA-seq data from MCF7 and MDA-MB-453 cells treated with palbociclib compared to DMSO. FDR q values in d and f were calculated by GSEAPreranked.
Extended Data Fig. 3
Extended Data Fig. 3. Enhanced expression of luminal differentiation-related genes is associated with increased H3K27 acetylation at nearby super-enhancers.
a, Representative H3K27ac ChIP-seq genome browser tracks with co-localized H3K27ac-decorated genomic loops (HiChIP) in MCF7 cells treated with DMSO or abemaciclib for 7 days. Gene promoters are highlighted in grey. b, Relative RNA-seq normalized reads of genes in MCF7 shRB1 cells treated with DMSO or abemaciclib for 7 days (n=2 independent cultures). c, Relative mRNA expression of genes shown in Fig. 3d in MMTV-rtTA/tetO-Her2 tumors treated for up to 59 days with vehicle or abemaciclib (n=3 independent tumors). Means ± s.d. are shown. P-values were determined by two-tailed unpaired t-tests corrected for multiple comparisons by Holm-Sidak method.
Extended Data Fig. 4
Extended Data Fig. 4. CDK4/6 inhibition promotes apoptotic evasion via BCL2L1.
a,b, ChIP-Enrich analysis of regions gaining H3K27ac after 7 days of abemaciclib treatment of PDX 14–07 tumors (21–28 days of treatment) (a), or of non-TSS ends of genomic loops (measured by HiChIP) detected only in abemaciclib-treated MCF7 and MDA-MB-453 cells (b). c, Dose-response curves showing percent mitochondrial depolarization in MDA-MB-361 and BT474 treated with DMSO or abemaciclib for 7 days and after exposure to Bim peptide (dynamic BH3 profiling; n=2 technical replicates, data are representative of two independent experiment). d-f, Relative RNA-seq normalized reads of MCL1 (d), BCL2 (e), and BCL2L2 (f) in human breast cancer cell lines treated with DMSO or abemaciclib, measured by RNA-seq (MDA-MB-361 and T47D: n=2; MCF7, MDA-MB-453, and BT474: n=3 independent cultures). Mean ± s.d. are shown. DESeq2 was used to determine adjusted P-values. g,h, Relative RNA-seq normalized reads of BCL2L1 and MCL1 in MCF7 shRB1 cells (g; n=2 independent cultures) and MDA-MB-468 (h, RB1 null; n=3 independent cultures) treated with DMSO or abemaciclib. Data are presented as mean ± s.d. DESeq2 was used to calculate adjusted P-values. i, Relative Bcl2l1 expression by transcriptomic profiling of MMTV-rtTA/tetO-Her2 tumors treated with vehicle (n=23) or abemaciclib (n=25) for 12 days. Mean ± s.d. of normalized reads are shown. P-values were determined using a two-tailed unpaired t-test. j, H3K27ac ChIP-seq tracks and co-localized H3K27ac-decorated genomic loops (identified by HiChIP) adjacent to BCL2L1 in MDA-MB-453 cells treated with DMSO or abemaciclib for 7 days. Gene promoters are highlighted in grey. k, Western blot showing cleaved PARP in MCF7 cells treated with DMSO or abemaciclib (500 nM) for 3 days, followed by treatment with A1155463 (1 μM) for 24 hours and BYL719 (1 μM) for 8 hours as indicated. Representative blots of two independent experiments in MCF7. Western blots are cropped; uncropped blot images for the experiments in this figure are shown in Source Data Extended Data Fig. 4.
Extended Data Fig. 5
Extended Data Fig. 5. Effect of CDK4/6 inhibition on H3K27ac signal at transposable elements and on interferon-stimulated gene expression.
a, Fold change in H3K27ac signal at LTRs, LINEs, and SINEs identified by RepEnrich in MCF7 and MDA-MB-453 treated with DMSO or abemaciclib for 7 days (red, FC>1.5). b, Cross-species conservation of a representative LTR enhancer activated by abemaciclib treatment in MCF7 cells. c, GSEA using RNA-sequencing data from MCF7 cells treated with abemaciclib compared to DMSO for 7 days, or genome-wide transcriptomic profiling of PDX 14–07 tumors treated with abemaciclib compared with vehicle for 21–28 days. d, GSEA using RNA-sequencing data from MCF7 cells treated with palbociclib compared to DMSO for 7 days. FDR q values in c, d were calculated by GSEAPreranked.
Extended Data Fig. 6
Extended Data Fig. 6. CDK4/6 inhibitor-activated LTR enhancers are predicted to regulate immune genes.
a, Gene Ontology analysis of interferon-related signatures using genes predicted to be regulated by all abemaciclib-activated enhancers, abemaciclib-activated SEs, or abemaciclib-activated LTR enhancers in MCF7 cells treated with DMSO or abemaciclib for 7 days. Odds ratios and P-values calculated by ChIP-Enrich. b, ATAC-seq and H3K27ac ChIP-seq tracks near representative immune genes in MCF7 and MDA-MB-453 treated with DMSO or abemaciclib for 7 days. LTRs annotated using Repeat Masker are shown as blue bars. Yellow highlights indicate H3K27ac up-peaks that align with an LTR. c, Relative RNA-seq normalized reads of immune genes in MCF7 parental and shRB1 cells treated with DMSO or abemaciclib for 7 days, measured by RNA-seq (parental: n=3; shRB1: n=2). Means ± s.d. are shown. DESeq2 was used to calculated adjusted P-values.
Extended Data Fig. 7
Extended Data Fig. 7. Effect of CDK4/6 inhibition on AP-1 gene expression.
a, Similarity (GIGGLE) scores between regions of increased H3K27ac signal genome-wide in MCF7 cells after palbociclib treatment and GEO-archived datasets of ChIP-seq for transcription factors (using “Cistrome Toolkit”). Top 20 factors identified are shown - AP-1 factors and steroid hormone receptors are labeled. b, c, Relative RNA-seq normalized reads of AP-1 members in MCF7 and MDA-MB-453 (b), and in MCF7 shRB1 and MDA-MB-468 (c) treated with DMSO or abemaciclib (MCF7, MDA- MB-453, MDA-MB-468, n=3; MCF7 shRB1, n=2). Means ± s.d. are shown. DESeq2 was used to calculated adjusted P-values.
Extended Data Fig. 8
Extended Data Fig. 8. AP-1 binding increases at CDK4/6i-induced enhancers and drives transcriptional activity that can be reversed by an AP-1 inhibitor.
a, Composite profile of c-Jun, JunB, and Fra2 ChIP-seq signals in MCF7 cells treated with DMSO or abemaciclib over regions of abemaciclib-induced H3K27ac up-peaks. b, H3K27ac, c-Jun, JunB, and Fra2 ChIP-seq tracks at PRICKLE2 and CDH1 loci in MCF7 cells treated with DMSO or abemaciclib. DNA loops (called by FDR<0.01) from H3K27ac HiChIP are depicted for PRICKLE2. Grey highlights indicate gene promoters. Green highlights indicate regions with abemaciclib-induced increases in both H3K27ac signal and c-Jun binding. c, Composite profile of c-Jun ChIP-seq signal over abemaciclib-activated LTR enhancers in MCF7 cells treated with DMSO or abemaciclib. d, H3K27ac, c-Jun, JunB, and Fra2 ChIP-seq tracks at RIPK2, HLA-C, and HLA-G loci in MCF7 cells treated with DMSO or abemaciclib. Green highlights as in b. LTRs annotated with Repeat Masker are shown in blue. e, Heatmap of H3K27ac, c-Jun, JunB, Fra2, and estrogen receptor (ER) ChIP-seq profiles at regions showing increased binding for any of c-Jun, JunB, or Fra2 (combined) after 7 days of abemaciclib treatment in MCF7 cells. The cluster “ER” denotes regions with increased ER binding after abemaciclib treatment and contains 1,124 regions. The cluster “no ER or ER unchanged” denotes regions with no change in ER binding or no ER at all and contains 14,504 regions. f, Analysis of GSEA signatures associated with luminal differentiation and interferon response using Principle Component 2 loadings from Fig. 7c. NES and FDR q values were calculated using GSEAPreranked.
Extended Data Fig. 9
Extended Data Fig. 9. Patterns of enhancer activation in breast cancers treated with combined CDK4/6 inhibition and endocrine therapy.
a, ChIP-Enrich analysis of regions gaining H3K27ac in MCF7 cells treated with abemaciclib plus fulvestrant (100 nM) versus DMSO for 7 days. b, Composite profiles of H3K27ac ChIP-seq signal from patient biopsies (baseline and tamoxifen + palbociclib, as in Fig. 8a), centered over ATAC peak-intersected, abemaciclib-induced H3K27ac up-peaks in MCF7 cells. c, H3K27ac ChIP-seq tracks at CDH1 and BCL2L1 from MCF7 cells and tumor biopsies from same patient as in b. d, H3K27ac ChIP-seq tracks at MKI67 and TOP2A from tumor biopsies from same patient as in b.
Fig. 1 |
Fig. 1 |. CDK4/6 inhibition induces chromatin remodeling in breast cancer.
a, ATAC- and ChIP-seq heatmaps for regions with significantly increased ATAC-seq peak signal (up peaks) after 7 days of abemaciclib treatment in MCF7 (left) and MDA-MB-453 (right), determined by a threshold of adjusted P<0.05 calculated by DESeq2. Abemaciclib concentration used in vitro was 500 nM for all experiments unless otherwise noted. ATAC in red (parental cells) and green (cells expressing shRNA against RB1; shRB1); H3K27ac signals in the same genomic regions in parental cells are shown in blue. b, Principal component analysis of ATAC-seq peaks in cells after treatment with DMSO or abemaciclib for the indicated times. c, ATAC-seq and H3K27ac ChIP-seq tracks at the PARD6B locus in MCF7 parental and MCF7 shRB1 cells treated with DMSO or abemaciclib for 12 hours, 24 hours, or 7 days. Grey shading highlights regions where treatment-induced increases in ATAC-seq signal are seen in parental but not shRB1 cells. d, Genomic distribution of regions showing significantly increased ATAC-seq signal from a and Extended Data Fig. 1g. e, ATAC-seq and H3K27ac ChIP-seq heatmaps for regions with new H3K27ac peaks but no significant increase in ATAC-seq signal (“poised” enhancers) after abemaciclib treatment. f, Heatmap depicting regions gaining H3K27ac (FiTAc-seq) in PDX 14–07 tumors treated with control or abemaciclib.
Fig. 2 |
Fig. 2 |. CDK4/6 inhibitor-activated enhancers are predicted to be functional.
a, Numbers of DNA loops identified by H3K27ac HiChIP in cells treated with DMSO or abemaciclib for 7 days (loops called using adjusted P<0.01). b,c, Association between abemaciclib-induced H3K27ac up-peaks and gene expression in cell lines treated with DMSO or abemaciclib (b) and in PDX 14–07 tumors treated with control or abemaciclib (c). Volcano plots depict RNA-seq log2 fold change and adjusted P-value calculated by DESeq2. Each dot represents one gene: blue indicates association with H3K27ac up-peak and orange indicates no association, as reported by the Binding and Expression Target Analysis (BETA). P-values below plots denote the significance of associations relative to background as calculated by BETA.
Fig. 3 |
Fig. 3 |. CDK4/6 inhibitor-activated enhancers promote luminal differentiation.
a, ChIP-Enrich analysis of super-enhancers gaining H3K27ac after 7 days of abemaciclib treatment in MCF7 and MDA-MB-453 cells. b, Relative RNA-seq normalized reads of luminal differentiation-related genes in MCF7 cells treated with DMSO or abemaciclib (n=3 independent cultures). Means ± standard deviation (s.d.) are shown. Adjusted P values were determined by DESeq2. c, Representative H3K27ac ChIP-seq tracks, aligned with H3K27ac-decorated genomic loops identified by HiChIP, in cells treated with DMSO or abemaciclib. Gene promoters are highlighted in grey. d, Representative H3K27ac FiTAc-seq tracks in MMTV-rtTA/tetO-Her2 tumors treated with control or abemaciclib. e, Representative hematoxylin and eosin (H&E) staining of tumors in d, from two independent experiments. Scale bars represent 200 μm.
Fig. 4 |
Fig. 4 |. CDK4/6 inhibitor-activated enhancers potentiate apoptotic evasion.
a, ChIP-Enrich analysis of super-enhancers gaining H3K27ac after 7 days of abemaciclib treatment in MCF7 and MDA-MB-453 cells. b, Dose-response curves showing percent mitochondrial depolarization in MCF7 and MDA-MB-453 cells after exposure to Bim peptide (dynamic BH3 profiling), after treatment with DMSO or abemaciclib for 7 days (n=2 technical replicates, representative of two independent experiments). c, Relative BCL2L1 RNA-seq normalized reads in human breast cancer cell lines treated with DMSO or abemaciclib (MDA-MB-361 and T47D: n=2, MCF7, MDA-MB-453, and BT474: n=3 independent cultures). Means ± s.d. are shown. DESeq2 was used to calculate adjusted P-values. d, Western blot showing Bcl-xL expression in MCF7, MDA-MB-453, and T47D cells treated with DMSO or abemaciclib. Blots shown are representative of two independent experiments in MCF7 and MDA-MB-453, and one experiment in T47D. e, Representative Bcl-xL staining and fraction of Bcl-xL-positive area in mammary tumors of MMTV-rtTA/tetO-Her2 mice treated with control (n=32) or abemaciclib (n=29) for 12 days. Means ± s.d. of percent area are shown. P value was determined by a two-tailed Mann-Whitney test. Scale bars indicate 200 μm. f, H3K27ac ChIP-seq tracks at BCL2L1 in cell lines treated with DMSO or abemaciclib. g, Western blots assessing cleaved PARP in MCF7 and MDA-MB-453 cells treated with DMSO or abemaciclib, followed by the addition of Bcl-xL inhibitor A-1155463 for 24 hours, and then induced to undergo apoptosis with staurosporine for 4 hours as indicated. Representative images are from two independent experiments in MCF7 and one experiment in MDA-MB-453. h, Representative cleaved caspase-3 staining and quantification of cleaved caspase-3-positive area in PDX 14–07 tumors treated with vehicle (n=21), abemaciclib (n=18), Bcl-xL inhibitor A-1331852 (n=15), or the combination (n=18). Mean ± s.d. of positively stained area are shown. P values were determined by Kruskal-Wallis, Dunn’s multiple comparisons test. Scale bars represent 100 μm. Western blots in d and f are cropped; uncropped blot images for the experiments in this figure are shown in Source Data Fig. 4.
Fig. 5 |
Fig. 5 |. CDK4/6 inhibitor-activated LTR enhancers are predicted to regulate immune genes.
a,b, Composite profiles of H3K27ac (a) and H3K9me3 (b) ChIP-seq signals at abemaciclib-activated LTR enhancers in MCF7 and MDA-MB-453 cells after 7 days of treatment. Zero on x-axes represents center of each LTR region. c, Density plots of distances between abemaciclib-induced H3K27ac up-peaks and the nearest transcriptional start site (TSS) in MCF7 and MDA-MB-453 cells (red: LTR-intersected enhancers; blue: non-intersected with LTRs). Vertical dashed lines indicate mean distances. d, Representative ATAC-seq and H3K27ac ChIP-seq tracks at abemaciclib-activated LTR enhancers and adjacent immune genes in MCF7 treated with DMSO or abemaciclib for 7 days. LTRs annotated using Repeat Masker are shown as blue bars. Yellow highlights indicate H3K27ac up-peaks that align with an LTR.
Fig. 6 |
Fig. 6 |. CDK4/6 inhibitor-induced active enhancers demonstrate increased AP-1 binding.
a, Similarity (GIGGLE) scores between regions of increased H3K27ac signal genome-wide in MCF7 and MDA-MB-453 cells after abemaciclib treatment, and GEO-archived datasets of ChIP-seq for transcription factors (using “Cistrome Toolkit”). Top 20 factors identified are shown - AP-1 factors (black) and steroid hormone receptors (red) are labeled. b, Relative RNA-seq normalized reads of AP-1 factors in MCF7 and MDA-MB-453 treated with DMSO or abemaciclib for 7 days (n=3 independent cultures). Means ± s.d. are shown. DESeq2 was used to calculate adjusted P-values. c, Western blot showing AP-1 factor protein expression in nuclear extracts of MCF7 and MDA-MB-453 cells treated with abemaciclib for 0, 1, or 7 days (equal number of nuclei per lane). Images of c-Jun and JunB are representative of three independent experiments in MCF7, image of Fra2 is representative of two independent experiments. Image of JunB in MDA-MB-453 is representative of two independent experiments, and images of c-Jun and Fra2 are representative of one experiment. Western blots are cropped; uncropped blot images for the experiments in this figure are shown in Source Data Fig. 6. d, Heatmap of c-Jun, JunB, and Fra2 binding (ChIP-seq) at abemaciclib-induced ATAC up-peak regions as in Fig. 1a in MCF7 cells treated with DMSO or abemaciclib.
Fig. 7 |
Fig. 7 |. Upregulation of key transcriptional signatures by CDK4/6 inhibitors is mitigated by concomitant inhibition of AP-1
a, Relative AP-1 transcriptional activity (firefly:renilla luciferase ratio) in MCF7 cells transfected with the AP-1 firefly luciferase reporter plasmid and a Renilla luciferase plasmid. Cells were treated with DMSO, abemaciclib, or abemaciclib plus SR11302 for 7 days (n=4 technical replicates from one experiment). b, Association between abemaciclib-induced c-Jun (left) or Fra2 (right) up-peaks and gene expression in MCF7 cells treated with DMSO or abemaciclib. Volcano plots depict RNA-seq log2 fold change and adjusted P-values were calculated by DESeq2. Each dot represents one gene: blue indicates association with AP-1 factor up-peak, and orange indicates no association, as reported by BETA. P-values below plots denote the significance of associations relative to background as calculated by BETA. c, Principal components analysis of RNA-seq data from MCF7 cells treated with DMSO, abemaciclib, or abemaciclib and SR11302 (n=2 technical replicates from one experiment). d, Gene set enrichment analysis (GSEA) plots of RNA-seq of MCF7 cells treated with abemaciclib compared to treatment with DMSO or the combination of abemaciclib and SR11302. Normalized enrichment scores (NES) and false discovery rate (FDR) q values were calculated using GSEAPreranked.
Fig. 8 |
Fig. 8 |. Clinical evidence of CDK4/6 inhibitor-induced enhancer remodeling.
a, H3K27ac ChIP-seq heatmap in MCF7 cells treated with DMSO, abemaciclib, palbociclib or abemaciclib and fulvestrant (left, blue) and the corresponding regions in paired clinical biopsies from one patient at baseline or after 14 days of palbociclib and tamoxifen treatment (right, orange). Heatmap covers all abemaciclib-induced H3K27ac up-peaks in MCF7 cells. b, ChIP-Enrich analysis of H3K27ac up-peaks in the biopsies from the patient in a treated with tamoxifen and palbociclib compared to baseline. c, H3K27ac ChIP-seq tracks at regions in proximity to luminal (top) and basal (bottom) cytokeratins in MCF7 cells treated with DMSO or abemaciclib, and in the paired biopsies from the patient in a at baseline or after tamoxifen and palbociclib. d, H&E stained sections of the patient tumor as in a-c at baseline and after 14 days’ palbociclib and tamoxifen treatment. Scale bars represent 200 μm. e, Upregulated epithelial cell differentiation signatures from GSEA of primary ER-positive breast cancers treated with palbociclib for 12 weeks in the NeoPalAna trial (C1D1, n=34; surgery, n=23). FDR q values were calculated by GSEA. f, Expression of JUN, JUNB, FOS, and FOSB in primary breast cancers of patients at baseline (BL), after 1 month of endocrine treatment (C1D1), and 12 weeks after addition of palbociclib (SURG) in the NeoPalAna trial (n represents number of patient biopsies, noted in each graph). Means ± s.d. of relative microarray reads are shown. LIMMA was used to calculate adjusted P-values.

Comment in

References

    1. Sherr CJ, Beach D. & Shapiro GI Targeting CDK4 and CDK6: From Discovery to Therapy. Cancer discovery 6, 353–367, doi:10.1158/2159-8290.CD-15-0894 (2016). - DOI - PMC - PubMed
    1. Spring LM et al. Cyclin-dependent kinase 4 and 6 inhibitors for hormone receptor-positive breast cancer: past, present, and future. Lancet 395, 817–827, doi:10.1016/S0140-6736(20)30165-3 (2020). - DOI - PubMed
    1. Finn RS et al. PD 0332991, a selective cyclin D kinase 4/6 inhibitor, preferentially inhibits proliferation of luminal estrogen receptor-positive human breast cancer cell lines in vitro. Breast cancer research : BCR 11, R77, doi:10.1186/bcr2419 (2009). - DOI - PMC - PubMed
    1. Goel S. et al. Overcoming Therapeutic Resistance in HER2-Positive Breast Cancers with CDK4/6 Inhibitors. Cancer cell 29, 255–269, doi:10.1016/j.ccell.2016.02.006 (2016). - DOI - PMC - PubMed
    1. Herrera-Abreu MT et al. Early Adaptation and Acquired Resistance to CDK4/6 Inhibition in Estrogen Receptor-Positive Breast Cancer. Cancer research 76, 2301–2313, doi:10.1158/0008-5472.CAN-15-0728 (2016). - DOI - PMC - PubMed
Methods-only References
    1. Leverson JD et al. Exploiting selective BCL-2 family inhibitors to dissect cell survival dependencies and define improved strategies for cancer therapy. Sci Transl Med 7, 279ra240, doi:10.1126/scitranslmed.aaa4642 (2015). - DOI - PubMed
    1. Corces MR et al. An improved ATAC-seq protocol reduces background and enables interrogation of frozen tissues. Nat Methods 14, 959–962, doi:10.1038/nmeth.4396 (2017). - DOI - PMC - PubMed
    1. Buenrostro JD, Wu B, Chang HY & Greenleaf WJ ATAC-seq: A Method for Assaying Chromatin Accessibility Genome-Wide. Curr Protoc Mol Biol 109, 21 29 21–29, doi:10.1002/0471142727.mb2129s109 (2015). - DOI - PMC - PubMed
    1. Savic D, Gertz J, Jain P, Cooper GM & Myers RM Mapping genome-wide transcription factor binding sites in frozen tissues. Epigenetics Chromatin 6, 30, doi:10.1186/1756-8935-6-30 (2013). - DOI - PMC - PubMed
    1. Servant N. et al. HiC-Pro: an optimized and flexible pipeline for Hi-C data processing. Genome biology 16, 259, doi:10.1186/s13059-015-0831-x (2015). - DOI - PMC - PubMed

Publication types

Substances