. 2021 May 17;131(10):e141801.
doi: 10.1172/JCI141801.

Transcriptome-wide association analysis identifies DACH1 as a kidney disease risk gene that contributes to fibrosis

Affiliations

Transcriptome-wide association analysis identifies DACH1 as a kidney disease risk gene that contributes to fibrosis

Tomohito Doke et al. J Clin Invest. .

Abstract

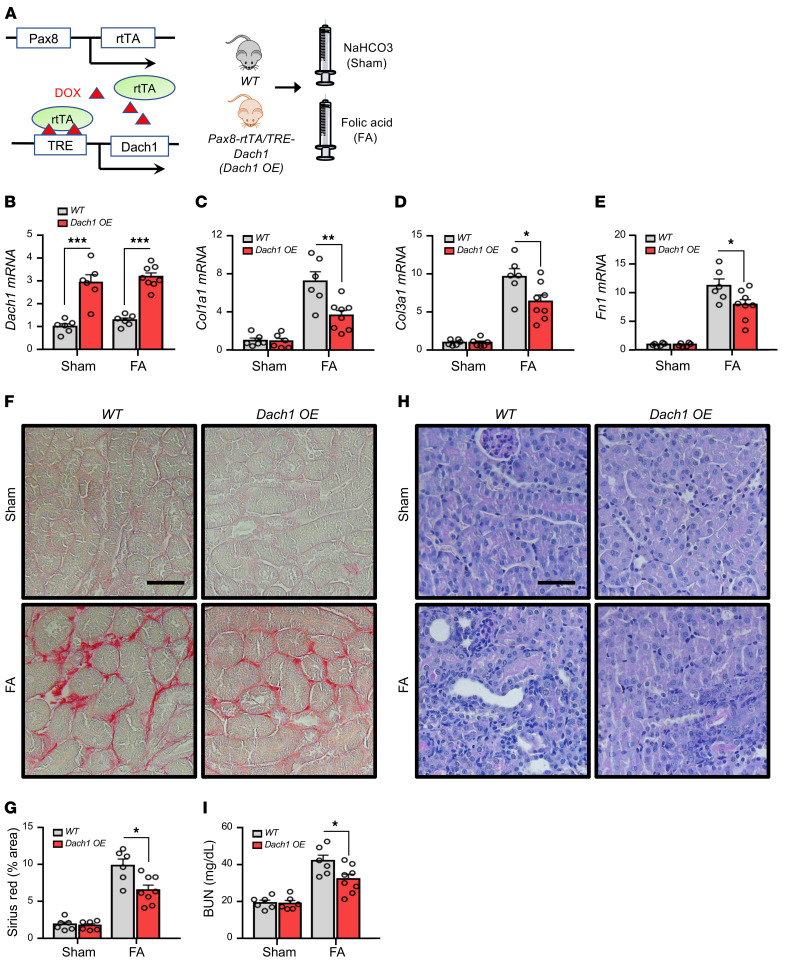
Genome-wide association studies (GWAS) for kidney function identified hundreds of risk regions; however, the causal variants, target genes, cell types, and disease mechanisms remain poorly understood. Here, we performed transcriptome-wide association studies (TWAS), summary Mendelian randomization, and MetaXcan to identify genes whose expression mediates the genotype effect on the phenotype. Our analyses identified Dachshund homolog 1 (DACH1), a cell-fate determination factor. GWAS risk variant was associated with lower DACH1 expression in human kidney tubules. Human and mouse kidney single-cell open chromatin data (snATAC-Seq) prioritized estimated glomerular filtration rate (eGFR) GWAS variants located on an intronic regulatory region in distal convoluted tubule cells. CRISPR-Cas9-mediated gene editing confirmed the role of risk variants in regulating DACH1 expression. Mice with tubule-specific Dach1 deletion developed more severe renal fibrosis both in folic acid and diabetic kidney injury models. Mice with tubule-specific Dach1 overexpression were protected from folic acid nephropathy. Single-cell RNA sequencing, chromatin immunoprecipitation, and functional analysis indicated that DACH1 controls the expression of cell cycle and myeloid chemotactic factors, contributing to macrophage infiltration and fibrosis development. In summary, integration of GWAS, TWAS, single-cell epigenome, expression analyses, gene editing, and functional validation in different mouse kidney disease models identified DACH1 as a kidney disease risk gene.

Keywords: Chronic kidney disease; Genetic variation; Genetics; Nephrology.


Conflict of interest statement

Conflict of interest: The authors have declared that no conflict of interest exists.

Figures

Figure 1
Figure 1. TWAS and regional association plots for kidney function and DACH1 expression.
(A) Conceptual model for TWAS. (BD) Regional association plots for DACH1 locus (index SNP; rs626277). (B) eGFR GWAS data from CKDGen study. (C) eQTL data in kidney tubules. (D) eQTL data in kidney glomeruli. Each dot represents 1 SNP. The dots are colored according to their relationship to the index SNP (rs626277). The red dots indicate high correlation (r2 > 0.8) (LD) with the index SNP. The left y axis indicates ––log10 (P value). The right y axis indicates recombination rate (cM/Mb). The red dotted horizontal line in the GWAS regional plot indicates the genome-wide significance threshold (5 × 10⁻⁸). Local permutation-based P value was used to define significance for the eQTL (tubule; P = 8.5 × 10⁻⁶, eQTL glom; P = 1.2 × 10⁻⁵). The x axis indicates the genomic location on chromosome 13. The arrow indicates the transcriptional direction for DACH1. (E) Box plot: the x axis represents the SNP (rs626277 genotype A/A, A/C, C/C), and the y axis shows relative DACH1 expression (P = 5.61 × 10–08) in human kidney tubule samples. (F) Effect sizes of eGFR GWAS (CKDGen) SNPs (y axis) were plotted against eQTL SNPs (x axis). Error bars show the standard errors of SNP effects. Significant SNPs in SMR analysis were plotted. Red triangle indicates the top eQTL signal. (G) Venn diagram of TWAS, SMR, and MetaXcan listing the 10 genes prioritized by all 3 methods.
Figure 2
Figure 2. Single-cell open chromatin data to narrow causal cell types and variants.
(A) Single-cell open chromatin landscape of the human kidney at the DACH1 locus. The top row shows the genome organization, followed by eGFR GWAS-significant SNPs and open chromatin tracks in DCT. Boxes in light purple, blue, and red indicate genomic region deleted in CRISPR-Cas9 experiments. LOH, loop of Henle; CD_PC, principal cells of the collecting duct; CD_IC, intercalated cells of the collecting tubule; PT, proximal tubule. (B) Close-up of the open chromatin area in the vicinity of eGFR GWAS-significant variants. The index SNP from TWAS and SMR was plotted (rs500830 and rs932768, respectively). Note the overlap of risk SNP in DCT (left lower panel) and lack of overlap in podocytes (right lower panel). The box in light red indicates genomic region targeted by CRISPR-Cas9 deletion. (C) Single-cell open chromatin landscape of the Dach1 locus in the mouse kidney. The peak-to-peak coaccessibility loop was inferred by CICERO, and a heuristic cutoff of 0.25 was used. The top row shows the gene tracks, followed by the eGFR GWAS-significant SNP liftover track. (D) CRISPR-Cas9–assisted genomic editing in HEK293 cells stably expressing Cas9. Boxes in light purple, blue, and red indicate the deleted genomic regions. The guide RNAs for positive control, negative control, and risk region were designed. Bar graphs show relative DACH1 expression following guide RNA transfection for negative control, risk region, and positive control. **P < 0.01, 1-way ANOVA and Tukey’s post hoc test.
Figure 3
Figure 3. DACH1 expression in mouse and human kidneys.
(AD) Representative immunofluorescence staining of DACH1 (red), DAPI (blue), and tubule-specific markers (green) in healthy adult mouse kidneys. Markers for proximal tubule, LTL (A) and AQP1 (B); distal tubule, Ksp-cadherin (KSP) (C); and collecting tubule, AQP2 (D). The right panels in AD show higher magnification images of the regions within the white-dotted frames. G, glomerulus. (EH) Representative immunofluorescence staining for DACH1 (red), DAPI (blue), and tubule-specific markers (green) in healthy human kidney. Markers for proximal tubule, LTL (E); thick ascending loop of Henle, UMOD (F); distal tubule, CAL (G); and collecting tubule, AQP2 (H). Right panels in EH show higher magnification images of the regions within the white-dotted frames. Scale bars: 20 μm.
Figure 4
Figure 4. Mice with tubule-specific Dach1 loss are more susceptible to injury and fibrosis.
(A) Experimental design: WT, KspCre/Dach1fl/WT (Dach1 HZ), and KspCre/Dach1fl/fl (Dach1 KO) mice were injected with FA or NaHCO3 (sham) i.p. Kidneys and serum were collected 7 days after injection. (B) Relative Dach1 mRNA expression in whole kidney tissue samples. (CE) Profibrotic gene expression in whole kidney tissue samples: Col1a1 (C), Col3a1 (D), and Fn1 (E). Gene expression levels were normalized to Gapdh. (F) Representative Sirius red staining. Scale bar: 20 μm. (G) Quantification (as a percentage of positive area) of Sirius red staining in whole kidney samples. (H) Representative image of PAS-stained kidney sections. Scale bar: 20 μm. (I) BUN levels. Sham-treated group: WT (n = 4), Dach1 HZ (n = 4), Dach1 KO (n = 4); FA-treated group: WT (n = 10), Dach1 HZ (n = 8), Dach1 KO (n = 8). Light gray bars represent WT, red bars represent Dach1 HZ, and green bars represent Dach1 KO group. *P < 0.05; **P < 0.01; ***P < 0.001, 1-way ANOVA and Tukey’s post hoc test.
Figure 5
Figure 5. Mice with tubule-specific Dach1 loss are more susceptible to diabetic injury.
(A) Experimental design: WT, KspCre/Dach1fl/WT (Dach1 HZ), and KspCre/Dach1fl/fl (Dach1 KO) mice underwent nephrectomy and STZ injection. (B) Urine albumin-to-creatinine ratio at 6, 14, 18, and 22 weeks of age. The x axis indicates age (weeks). Black line, WT; red line, KspCre/Dach1fl/WT (Dach1 HZ); green line, KspCre/Dach1fl/fl (Dach1 KO). aP < 0.05, Dach1 KO vs. WT; bP < 0.01, Dach1 KO vs. WT; P < 0.05, Dach1 KO vs. Dach1 HZ; P < 0.05, Dach1 HZ vs. WT. (C) Blood glucose levels of sham-treated and Unx-STZ–treated groups. (DF) Relative transcript levels of Col1a1 (D), Col3a1 (E), and Fn1 (F) in whole kidney samples of WT, KspCre/Dach1fl/WT (Dach1 HZ), and KspCre/Dach1fl/fl (Dach1 KO) mice. Gene expression levels were normalized to Gapdh. (BF) Sham-treated group: WT (n = 3), Dach1 HZ (n = 3), Dach1 KO (n = 3); Unx-STZ treatment group: WT (n = 7), Dach1 HZ (n = 8), Dach1 KO (n = 6). *P < 0.05, **P < 0.01, ***P < 0.001, 1-way ANOVA and Tukey’s post hoc test.
Figure 6
Figure 6. Mice with tubule-specific transgenic expression of Dach1 is protected from fibrosis.
(A) Experimental design: Pax8rtTA/TRE-Dach1 (Dach1 OE) mice and control littermates (WT) were placed on doxycycline-containing chow. Mice were injected with FA or NaHCO3 (sham) i.p. Kidneys and serum were collected 7 days after injection. (B) Relative Dach1 mRNA expression in whole kidney tissue samples. (CE) Profibrotic gene expression in whole kidney tissue samples: Col1a1 (C), Col3a1 (D), Fn1 (E). Gene expression levels were normalized to Gapdh. (F) Representative images of Sirius red staining. Scale bar: 20 μm. (G) Quantitative analysis (as a percentage of positive area) of Sirius red staining of kidney sections. (H) Representative images of PAS-stained kidney sections. Scale bar: 20 μm. (I) BUN levels. Sham-treated group: WT (n = 6), Dach1 OE (n = 6); FA-treated group: WT (n = 6), Dach1 OE (n = 8). Light gray bars represent WT; red bars represent Dach1 OE. *P < 0.05; **P < 0.01; ***P < 0.001, 1-way ANOVA and Tukey’s post hoc test.
Figure 7
Figure 7. Single-cell RNA-Seq of WT mice and mice with tubule-specific heterozygous deletion of Dach1.
(A) Experimental design: single-cell suspensions were generated from whole kidney tissue samples of WT and KspCre/Dach1fl/WT (Dach1 HZ) mice. (B) Dimension reduction (UMAP) clustering. The following clusters were identified: novel cell types (Novel1, Novel2), NK cells, CD8 effector T cells (CD8 effector), B lymphocytes (B1, B2), granulocytes (Granul), macrophages (Macro), monocytes (Mono), B-type intercalated cells (B-IC), A-type intercalated cells (A-IC), principal cells of the collecting tubule (CD PC), connecting tubule (CNT), DCT, ascending loop of Henle (ALOH), descending loop of Henle (DLOH), proximal tubule S1 segment (PT S1), PT S2, PT S3, podocytes (Podo), endothelial cells (Endo). (C) Bubble plots of cell type–specific gene expression. The size of each dot corresponds to the percentage of positive cells, while the color intensity of each dot represents the average gene expression. (D) Relative transcript levels of Stmn1 and Top2a in kidneys of WT and KspCre/Dach1fl/WT (Dach1 HZ) mice. Gene expression levels were normalized to Gapdh. (E) Representative immunohistochemistry staining of STMN1 in WT and KspCre/Dach1fl/WT (Dach1 HZ) mice. Scale bar: 20 μm. (F) Number of STMN1-positive cells per high power field (HPF) in WT and KspCre/Dach1fl/WT (Dach1 HZ) mice. WT (n = 6), Dach1 HZ (n = 6). *P < 0.05, 2-tailed Student’s t test.
Figure 8
Figure 8. DACH1 transcriptionally controls cell cycle genes in kidney tubule cells.
(A) DACH1-ChIP 19,460-binding sites, corresponding to 5111 genes in the K562 cell (human immortalized myelogenous leukemia). Lower panel shows the distribution of peaks compared with TSS distance. (B) Top 10 most significant pathways from the Molecular Signatures Database (MsigDB) using the Genomic Region of Enrichment of Annotations (GREAT) package (see Supplemental Methods). (C) Primary mouse kidney tubule cells were isolated from Dach1fl/fl mice and infected with adenovirus-GFP (Ade-GFP; control [CTRL]) or adenovirus-Cre-GFP (Ade-Cre-GFP; Dach1 KO). Representative Western blots of DACH1 protein expression in control and Dach1 KO tubule cells. GAPDH was used as loading control. (D) DACH1-ChIP-PCR for Ccnd1 and Ccnd2 in control kidney tubule cells. Three independent experiments were performed. (E) Integrated Genome Browser view of the human CCND2 locus. From top to bottom, the labels indicate the CCND2 locus, DACH1–ChIP-Seq, followed by human kidney snATAC-Seq in DCT, proximal tubule, loop of Henle, principal cell, intercalated cell. The box highlights the overlapping peaks between DACH1–ChIP-Seq and snATAC-Seq. (F) Relative gene expression of Ccna1, Ccnd1, Ccnd2, and Ccne1 in Ade-GFP or Ade-Cre-GFP transfected cells (n = 3). Gapdh was used as internal control. (G) Results of cell proliferation analysis using the MTT assay at 24 and 48 hours after Ade-GFP or Ade-Cre-GFP infection. (n = 3 in triplicate). *P < 0.05, **P < 0.01, 1-way ANOVA and Tukey’s post hoc test.
Figure 9
Figure 9. DACH1 controls cell cycle in vivo.
(A and B) Relative transcript expression of Ccnd2 (A) and Mki67 (B) in whole kidney samples of sham-treated and FA-injected WT, KspCre/Dach1fl/WT (Dach1 HZ), and KspCre/Dach1fl/fl (Dach1 KO) mice. (C and D) Representative Ki-67 immunostaining (C) and quantification of Ki-67–positive cells per high-power field in kidney tissue of sham-treated and FA-injected WT, KspCre/Dach1fl/WT (Dach1 HZ), and KspCre/Dach1fl/fl (Dach1 KO) mice. Scale bar: 20 μm. (E and F) Relative transcript levels of Ccnd2 (E) and Mki67 (F) in whole kidney samples of sham-treated and FA-injected WT and Pax8rtTA/TRE-Dach1 (Dach1 OE) mice. (AD) Sham-treated group: WT (n = 4), Dach1 HZ (n = 4), Dach1 KO (n = 4); FA-treated group: WT (n = 10), Dach1 HZ (n = 8), Dach1 KO (n = 8). Light gray bars represent WT, red bars represent Dach1 HZ, and green bars represent Dach1 KO group. (E and F) Sham-treated group: WT (n = 6), Dach1 OE (n = 6); FA-treated group: WT (n = 6), Dach1 OE (n = 8). Light gray bars represent WT,; red bars represent Dach1 OE. *P < 0.05, **P < 0.01, ***P < 0.001, 1-way ANOVA and Tukey’s post hoc test.
Figure 10
Figure 10. DACH1 transcriptionally controls cytokine expression in cultured kidney tubule cells.
(AC) DACH1-ChIP-qPCR for Ccl2 (A), Csf1 (B), Icam1 (C) using primary mouse kidney tubule epithelial cells. The y axis is presented as percentage of input (n = 3). (D) Integrated Genome Browser view of the human CSF1 locus. From top to bottom, the labels indicate CSF1 locus, DACH1-ChIP-seq, followed by human kidney snATAC-Seq (open chromatin region) in DCT, proximal tubule, loop of Henle, principal cells, intercalated cells. The red box highlights the overlapping peaks of DACH1 ChIP-Seq and human kidney snATAC-Seq. (E) The relative expression of Cxcl1, Cxcl2, Ccl2, Ccl5, Tnfa, Csf1, Il1b, Il17c, Il27, and Icam1 in Ade-GFP or Ade-Cre-GFP transfected renal tubule cells from Dach1fl/fl mice (n = 3). Gapdh was used as internal control. (F) Experimental scheme of Raw 264.7 macrophage chemotaxis assay. The supernatants of Ade-GFP or Ade-Cre-GFP-transfected renal tubule cells from Dach1fl/fl mice were added to the lower chamber. The number of macrophages (macrophage migration) was analyzed by relative fluorescence units (RFU) after 2 or 24 hours (n = 3 in triplicate). *P < 0.05, **P < 0.01, ***P < 0.001, 1-way ANOVA and Tukey’s post hoc test.
Figure 11
Figure 11. DACH1 controls cytokine expression and macrophage infiltration.
(AC) Relative transcript expression of Ccl2 (A), Csf1 (B), and Icam1 (C) in kidneys of sham-treated and FA-treated WT, KspCre/Dach1fl/WT (Dach1 HZ), and KspCre/Dach1fl/fl (Dach1 KO) mice. (DE) Representative immunostaining with F4/80 (macrophage marker) (D) and quantification of F4/80-positive area (E) in kidney tissue of sham-treated and FA-treated WT, KspCre/Dach1fl/WT (Dach1 HZ), and KspCre/Dach1fl/fl (Dach1 KO) mice. Scale bar: 20 μm. (FH) Relative transcript expression of Ccl2 (F), Csf1 (G), and Icam1 (H) in kidneys of sham-treated and FA-treated WT and Pax8rtTA/TRE-Dach1 (Dach1 OE) mice. Gapdh was used as internal control. (AD) Sham-treated group: WT (n = 10), Dach1 HZ (n = 10), Dach1 KO (n = 10); FA-treated group: WT (n = 10), Dach1 HZ (n = 8), Dach1 KO (n = 8). Light gray bars represent WT, red bars represent Dach1 HZ, and green bars represent Dach1 KO. (E and F) Sham-treated group: WT (n = 6), Dach1 OE (n = 6); FA-treated group; WT (n = 6), Dach1 OE (n = 8). Light gray bars represent WT; red bars represent Dach1 OE. *P < 0.05, **P < 0.01, ***P < 0.001, 1-way ANOVA and Tukey’s post hoc test.
Figure 12
Figure 12. DACH1 levels correlate with cell cycle, inflammation, and disease severity in human kidney tubule samples.
(A) Representative immunofluorescence staining of DACH1 (red), DAPI (blue), and CAL (green). The overlap of DACH1/DAPI/CAL in healthy (control) (upper panel) and CKD (lower panel) human kidney. Right panels show higher-magnification images of the regions within the dotted frames. Scale bar: 20 μm. (B) Gene expression analysis was performed using 95 microdissected human kidney tubules obtained from healthy and diseased samples. (C) Correlation between DACH1 normalized expression levels in human kidney tubules and corresponding eGFR (ml/min/1.73 m2). Correlation coefficient (Cor) = 0.20; P = 0.048. (D) Correlation between COL1A1 and DACH1 normalized expression levels in human kidney tubules. Cor = –0.45; P = 2.8 × 10–05. (E) Gene Ontology analysis of transcripts correlated with DACH1 levels. The x axis represents the –log10 of the P value. Inflammatory or immune-related pathways are highlighted in red and development or cell proliferation–related pathways are highlighted in blue. (F and G). Correlation between CCND2 (F), CCL2 (G), and DACH1 normalized expression levels in human kidney tubules. Cor = –0.44; P = 5.1 × 10–05 (F), Cor = –0.21 P = 0.04 (G). Correlation analyses were performed using a linear regression model adjusted for sex, age and race.

Comment in

References

    1. Reidy K, et al. Molecular mechanisms of diabetic kidney disease. J Clin Invest. 2014;124(6):2333–2340. doi: 10.1172/JCI72271. - DOI - PMC - PubMed
    1. Breyer MD, Susztak K. The next generation of therapeutics for chronic kidney disease. Nat Rev Drug Discov. 2016;15(8):568–588. doi: 10.1038/nrd.2016.67. - DOI - PMC - PubMed
    1. Köttgen A, et al. New loci associated with kidney function and chronic kidney disease. Nat Genet. 2010;42(5):376–384. doi: 10.1038/ng.568. - DOI - PMC - PubMed
    1. Pattaro C, et al. Genetic associations at 53 loci highlight cell types and biological pathways relevant for kidney function. Nat Commun. 2016;7:10023. - PMC - PubMed
    1. Wuttke M, et al. A catalog of genetic loci associated with kidney function from analyses of a million individuals. Nat Genet. 2019;51(6):957–972. doi: 10.1038/s41588-019-0407-x. - DOI - PMC - PubMed

Publication types