. 2021 May 17;131(10):e144225.
doi: 10.1172/JCI144225.

Regulation of intercellular biomolecule transfer-driven tumor angiogenesis and responses to anticancer therapies

Affiliations

Regulation of intercellular biomolecule transfer-driven tumor angiogenesis and responses to anticancer therapies

Zhen Lu et al. J Clin Invest. .

Abstract

Intercellular biomolecule transfer (ICBT) between malignant and benign cells is a major driver of tumor growth, resistance to anticancer therapies, and therapy-triggered metastatic disease. Here we characterized cholesterol 25-hydroxylase (CH25H) as a key genetic suppressor of ICBT between malignant and endothelial cells (ECs) and of ICBT-driven angiopoietin-2-dependent activation of ECs, stimulation of intratumoral angiogenesis, and tumor growth. Human CH25H was downregulated in the ECs from patients with colorectal cancer and the low levels of stromal CH25H were associated with a poor disease outcome. Knockout of endothelial CH25H stimulated angiogenesis and tumor growth in mice. Pharmacologic inhibition of ICBT by reserpine compensated for CH25H loss, elicited angiostatic effects (alone or combined with sunitinib), augmented the therapeutic effect of radio-/chemotherapy, and prevented metastatic disease induced by these regimens. We propose inhibiting ICBT to improve the overall efficacy of anticancer therapies and limit their prometastatic side effects.

Keywords: Colorectal cancer; Endothelial cells; Oncology; Vascular Biology.


Conflict of interest statement

Conflict of interest: The authors have declared that no conflict of interest exists.

Figures

Figure 1
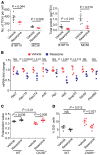
Figure 1. CH25H and reserpine control ICBT between malignant cells and endothelial cells.
(A) A schematic of experiments for assessing intratumoral ICBT in vivo. (B) Flow cytometric analysis of percentage of TdTomato+CD45 and TdTomato+CD45+ cells in the tumor microenvironment (n = 5 for each group). (C) Flow cytometric analysis of the percentage (left) and absolute number (right) of TdTomato+CD31+ cells in tumors from GFP+ WT and GFP+ Ch25h–/– mice (n = 4–5 for each group). (D) Flow cytometric analysis of percentage (left) and absolute number (right) of TdTomato+CD31+ cells (n = 4 for each group) in tumors from GFP+ WT and GFP+ Ch25h–/– mice administered i.p. vehicle or reserpine (1 mg/kg given every other day for 4 days). (E) qPCR analysis of Gfp mRNA in primary WT and Ch25h–/– ECs after in vitro treatment with vehicle or reserpine (10 μM for 8 hours) followed by a 12-hour exposure to TEVs (20 μg/mL) isolated from GFP+ B16F10 cells (n = 4 for each group). Data are presented as mean ± SEM. Statistical analysis was performed using 1-way ANOVA with Tukey’s multiple-comparison test (B, D, and E) or 2-tailed Student’s t test (C). NS, not significant. Experiments were performed independently at least 3 times.
Figure 2
Figure 2. Stromal CH25H restricts growth of solid tumors.
(A) Growth of B16F10-TdTomato tumors (inoculated s.c. at 1 × 10⁶ cells/mouse) in GFP+ WT and GFP+ Ch25h–/– mice. n = 4–5 for each group. (B) Representative images and quantification of tumor mass on day 15 from the experiment described in panel A. (C) Growth of MH6499c4 pancreatic ductal adenocarcinoma tumors (inoculated s.c. at 1 × 10⁵ cells/mouse) in WT and Ch25h–/– mice. n = 12–13 for each group. (D) Growth of MC38 colon adenocarcinoma tumors (inoculated s.c. at 1 × 10⁶ cells/mouse) in WT (n = 8) and Ch25h–/– (n = 13) mice. (E) Representative images and quantification of mass of MC38 colon adenocarcinoma tumors at 40 days after orthotopic inoculation of 5 × 10⁵ cells into the cecum of WT (n = 5) or Ch25h–/– (n = 4) mice. (F) Representative images and quantification for in vivo luciferase analysis in male WT (n = 8) and Ch25h–/– (n = 9) mice, which were inoculated into prostatic glands with TRAMP-C2-luc prostate cells (1 × 10⁶). Data are presented as mean ± SEM. Statistical analysis was performed using 2-way ANOVA with Tukey’s multiple-comparison test (A, C, D, and F) or 2-tailed Student’s t test (B and E). Experiments were performed independently at least 3 times.
Figure 3
Figure 3. The angiostatic role of CH25H in the tumor microenvironment.
(A) A representative image of B16F10-TdTomato tumors and surrounding blood vessels in GFP+ WT and GFP+ Ch25h–/– mice. (B) Representative image of blood vessels (green) and CH25H (red) in normal stroma and colorectal cancer stroma. Scale bar: 100 μm. (C) Scatterplot of quantitative stromal CH25H protein expression levels in normal adjacent stroma and tumor stroma (Cohort 1). (D) Kaplan-Meier survival analysis of CRC stromal CH25H protein levels, dichotomized into high and low CH25H expression, indicating increased risk of recurrence with loss of CH25H protein levels (Cohort 2). (E) Scatterplot of quantitative CH25H protein levels within the endothelium of normal adjacent stroma and CRC tumor stroma (Cohort 3, left panel) and the validation of endothelial CH25H expression levels between paired samples of normal adjacent stroma and CRC stroma (Cohort 4, right panel). (F) Analysis of CD31+ ECs in B16F10 tumors (s.c., 1 × 10⁶ cells/mouse) of comparable volume grown for approximately 2 weeks in WT (n = 4) and Ch25h–/– (n = 5) mice. Scale bar: 100 μm. (G) Quantification of data from experiment described in panel F. Data averaged from 5 random fields in sections from each of 4 or 5 animals are shown. (H) Representative image (left) of colocalization of blood vessels (red) and lectin+ (green) area in tumor from WT and Ch25h–/– mice after injection with FITC-lectin (i.v., 100 μg/mouse). Quantification (right) of FITC-positive area (n = 5 for each group) of the images. Scale bar: 50 μm. (I) qPCR analysis of relative expression indicated genes in B16F10 (n = 5) and MC38 (n = 6) tumor tissues from WT and Ch25h–/– mice. For each gene, mRNA levels in WT tumors were defined as 1.0. Data are presented as mean ± SEM. Statistical significance was determined by 2-tailed Student’s t test (C, E, and GI) or log-rank (Mantel-Cox) test (D). Experiments were performed independently at least 3 times.
Figure 4
Figure 4. The ICBT-driven activation of endothelial cells is controlled by CH25H.
(A) Volcano plot (upper) and Gene Ontology (GO, bottom) analyses of gene expression in Ch25h–/– mouse lung ECs treated as indicated. BP, Biological Process; MF, Molecular Function; CC, Cellular Component; TF, transcription factors. (B) Heatmap analysis of gene expression from panel A. (C) Western blot analysis of TIE2 levels/phosphorylation in indicated ECs treated with MC38 TEVs (20 μg/mL for 12 hours). (D) qPCR analysis of Angpt2 expression (n = 3 ) in indicated ECs pretreated with vehicle or reserpine (10 μM for 8 hours) or cyclosporin A (0.25 μM for 24 hours) followed by PBS or TEVs (20 μg/mL for 12 hours). (E) ELISA analysis of ANGPT2 in supernatant of indicated ECs from panel D. (F) Tube formation by indicated ECs treated with VEGF165 (20 ng/mL) or MC38 tumor cell–conditioned media (TCM) or TCM –TEV (TEV-free tumor cell–conditioned media) or TCM with addition of anti-ANGPT2 neutralizing antibody as in Supplemental Figure 4C. Data averaged from 3 random fields in each of 5 wells were quantified. (G) Proliferation of indicated ECs exposed to MC38-derived TEVs (20 μg/mL) for 9 days. (H) Tube formation by indicated ECs treated (or not) with MC38-derived TEVs (20 μg/mL for 12 hours) in the presence or absence of anti-ANGPT2 antibody (60 ng/mL). Representative images (left) and quantified data (n = 5 for each group) averaged from 3 random fields in each of the 5 wells are shown. Scale bar: 100 μm. (I) Tube formation by Ch25h–/– ECs transduced with empty (Ctrl) or CH25H-expressing lentivirus (for 48 hours) or treated with vehicle or 25-hydroxycholesterol (25HC, 4 μM for 4 hours) and then exposed or not to MC38 TEVs (20 μg/mL for 12 hours). Data are presented as mean ± SEM. Statistical analysis was performed by 1-way ANOVA with Tukey’s multiple-comparison test (DF, H, and I) or 2-way ANOVA with Tukey’s multiple-comparison test (G). NS, not significant. Experiments were performed independently at least 3 times.
Figure 5
Figure 5. Endothelial expression of CH25H drives its angiostatic and antitumorigenic functions in vivo.
(A) Representative images of colocalization of GFP-expressing Ch25h–/– ECs (green) with blood vessels (red). Scale bar: 20 μm. (B) Analysis of growth of tumors formed in WT host mice by B16F10 malignant cells (3 × 10⁵/mouse) coinjected s.c. with vehicle (n = 4) or with primary lung ECs (6 × 10⁴/mouse) isolated from WT or Ch25h–/– mice (n = 5 for both groups). (C) Analysis of growth of B16F10 tumors (s.c., 1 × 10⁶ cells/mouse) in VE-cadherin–Cre+ WT and VE-cadherin-Cre+ Ch25hfl/fl mice (n = 5 for each group). (D) Representative images and B16F10 tumor mass analysis from experiment described in panel C (tumors harvested on day 17 after inoculation). (E) Representative immunofluorescence images of CD31 staining of B16F10 tumors from VE-cadherin–Cre+ WT and VE-cadherin–Cre+ Ch25hfl/fl mice (left) and quantification of CD31-positive areas (right). Quantification averaged from 5 random fields in sections from each of 5 animals is shown. Scale bar: 100 μm. (F) Quantification of average length and number of blood vessels (>50 μm) from experiment shown in panel E. Data averaged from 5 random fields in sections from each of 5 animals are shown. Data are shown as mean ± SEM. Statistical analysis was performed using 2-way ANOVA with Tukey’s multiple-comparison test (B and C) or 2-tailed Student’s t test (DF). Experiments were performed independently at least 3 times.
Figure 6
Figure 6. Angiostatic and antitumorigenic effects of reserpine in solid tumors.
(A) qPCR analysis of relative Angpt2 mRNA levels in B16F10 tumors from WT and Ch25h–/– mice treated with vehicle or reserpine (1 mg/kg, i.p. every other day for 4 days). n = 5 for each group. (B) Representative immunofluorescence images and quantification of CD31-positive areas in B16F10 tumors from WT and Ch25h–/– mice (n = 5 for each group) treated with vehicle or reserpine as described in panel A. Scale bar: 100 μm. (C) Growth of human HCT116 tumors (inoculated s.c. at 5 × 10⁶ cells/mouse) in NSG mice treated with vehicle or reserpine (1 mg/kg) every other day. n = 5 for each group. (D) Representative immunofluorescence image (upper) of CD31 staining of HCT116 tumors from NSG mice treated with vehicle or reserpine. Quantification (bottom) of CD31-positive areas and average distance of blood vessels. Quantification averaged from 5 random fields in sections from each of 5 animals is shown (n = 5 for each group). Scale bar: 100 μm. (E) Analysis of B16F10 tumor growth (inoculated s.c. at 1 × 10⁶ cells/mouse) in WT and Ch25h–/– mice (n = 5 for each group) followed by vehicle or reserpine treatment (1 mg/kg, i.p. every other day). (F) Analysis of B16F10 tumor mass on day 15 of the experiment described in panel E. (G) Analysis of B16F10 tumor mass on day 15 after inoculation (s.c. at 1 × 10⁶ cells/mouse) into indicated mice (n = 5 for each group) followed by vehicle or reserpine treatment (1 mg/kg, i.p. every other day). Data are presented as mean ± SEM. Statistical analysis was performed using 1-way ANOVA with Tukey’s multiple-comparison test (A, B, F, and G), 2-way ANOVA with Tukey’s multiple-comparison test (C and E), or 2-tailed Student’s t test (D). NS, not significant. Experiments were performed independently at least 3 times.
Figure 7
Figure 7. Combination of reserpine and antiangiogenic therapy.
(A) Schematic of treatment of MC38 tumor–bearing mice with sunitinib, reserpine, or their combination. (B) Representative immunofluorescence images and quantification of angiogenesis parameters in MC38 tumors from WT mice treated as in panel A (n = 5 for each group). Scale bar: 100 μm. (C) Analysis of MC38 tumor volume in WT mice treated as in panel A (n = 5 for each group). (D) Analysis of mass of MC38 tumors in WT mice on day 25 of the experiment described in panel C (n = 5 for each group). Data are presented as mean ± SEM. Statistical analysis was performed using 1-way ANOVA with Tukey’s multiple-comparison test (B and D) or 2-way ANOVA with Tukey’s multiple-comparison test (C). NS, not significant. Experiments were performed independently at least 3 times.
Figure 8
Figure 8. Mechanism of reserpine-mediated TEV uptake inhibition.
(A) Quantification of numbers (upper panel) and total protein content (bottom panel) of TEVs released by the indicated cells following treatment with vehicle or reserpine (10 μM for 48 hours) in vitro. (B) qPCR analysis of Rab7, Rab11b, Rab27a, Sdcbp, Arf6, Ykt6, Snap23, Hgs, and Pdcd6ip relative levels (n = 4 for each group) in MC38 cancer cells treated with vehicle or reserpine (10 μM for 12 hours). (C) Analysis of plasma membrane polarization in WT and Ch25h–/– ECs treated with reserpine (10 μM) for 12 hours. (D) Flow cytometric analysis of percentage of DiD+CD31+ cells upon incubation of indicated ECs with DiD-labeled liposomes (1 μg/mL) in the presence or absence of reserpine (10 μM) for 8 hours (n = 5 for each group). Data are presented as mean ± SEM. Statistical analysis was performed using 1-way ANOVA with Tukey’s multiple-comparison test (A, C, and D) or 2-tailed Student’s t test (B). NS, not significant. Experiments were performed independently at least 3 times.
Figure 9
Figure 9. Administration of reserpine improves the outcomes of radio-/chemotherapies.
(A) ELISA analysis of CD63 levels in the plasma from mice bearing B16F10 tumors of similar volume exposed or not to ionizing radiation (IR, 12 Gy), reserpine (1 mg/kg), or both. n = 4 for all groups. (B) Analysis of tumor volume in B16F10 tumors (inoculated s.c. at 1 × 10⁵ cells/mouse) in WT mice treated with vehicle or reserpine (1 mg/kg) upon reaching 30 to 50 mm3. Three days later, vehicle- and reserpine-treated mice with similar tumor volumes underwent 12-Gy irradiation and continued their assigned vehicle or reserpine treatments 3 times per week (n = 4). (C) Kaplan-Meier survival analysis of B16F10 tumor–bearing mice treated as described in panel B until tumors reached 2000 mm3 (n = 4). (D) Quantification of total area of B16F10 metastatic load in lungs from mice described in panel B (n = 4). (E) Schematic of the experiments combining reserpine with FOLFOX treatment of orthotopically inoculated MC38 colon tumors. (F) Representative images and the mass of MC38 tumors from animals treated as in panel E. n = 5 for each group. (G) Representative images of livers from MC38 tumor–bearing mice described in panel E. Arrowheads show macroscopic metastatic lesions found in 8% of vehicle-treated animals, 57% of FOLFOX only–treated animals, and none of the animals that received reserpine (with or without FOLFOX). Data are shown as mean ± SEM. Statistical analysis was carried out using 1-way ANOVA with Tukey’s multiple-comparison test (A, D, and F), 2-way ANOVA with Tukey’s multiple-comparison test (B), or log-rank (Mantel-Cox) test (C). NS, not significant. Experiments were performed independently at least 3 times.

Similar articles

Cited by

References

    1. Mittelbrunn M, Sanchez-Madrid F. Intercellular communication: diverse structures for exchange of genetic information. Nat Rev Mol Cell Biol. 2012;13(5):328–335. doi: 10.1038/nrm3335. - DOI - PMC - PubMed
    1. Murk JL, et al. The plasticity of multivesicular bodies and the regulation of antigen presentation. Semin Cell Dev Biol. 2002;13(4):303–311. doi: 10.1016/S1084952102000605. - DOI - PubMed
    1. Thery C, et al. Exosomes: composition, biogenesis and function. Nat Rev Immunol. 2002;2(8):569–579. doi: 10.1038/nri855. - DOI - PubMed
    1. Todorova D, et al. Extracellular vesicles in angiogenesis. Circ Res. 2017;120(10):1658–1673. doi: 10.1161/CIRCRESAHA.117.309681. - DOI - PMC - PubMed
    1. Becker A, et al. Extracellular vesicles in cancer: cell-to-cell mediators of metastasis. Cancer Cell. 2016;30(6):836–848. doi: 10.1016/j.ccell.2016.10.009. - DOI - PMC - PubMed

Publication types

MeSH terms