. 2021 May 17;131(10):e141279.
doi: 10.1172/JCI141279.

DACH1 protects podocytes from experimental diabetic injury and modulates PTIP-H3K4Me3 activity

Affiliations

DACH1 protects podocytes from experimental diabetic injury and modulates PTIP-H3K4Me3 activity

Aili Cao et al. J Clin Invest. .

Abstract

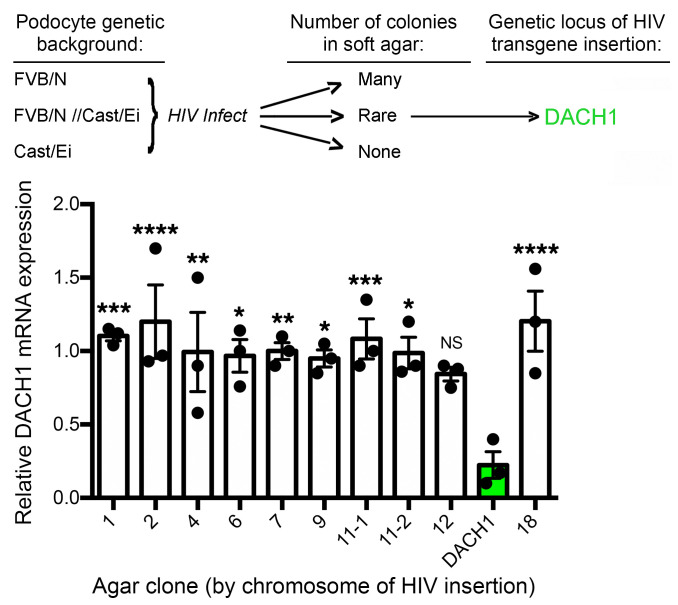
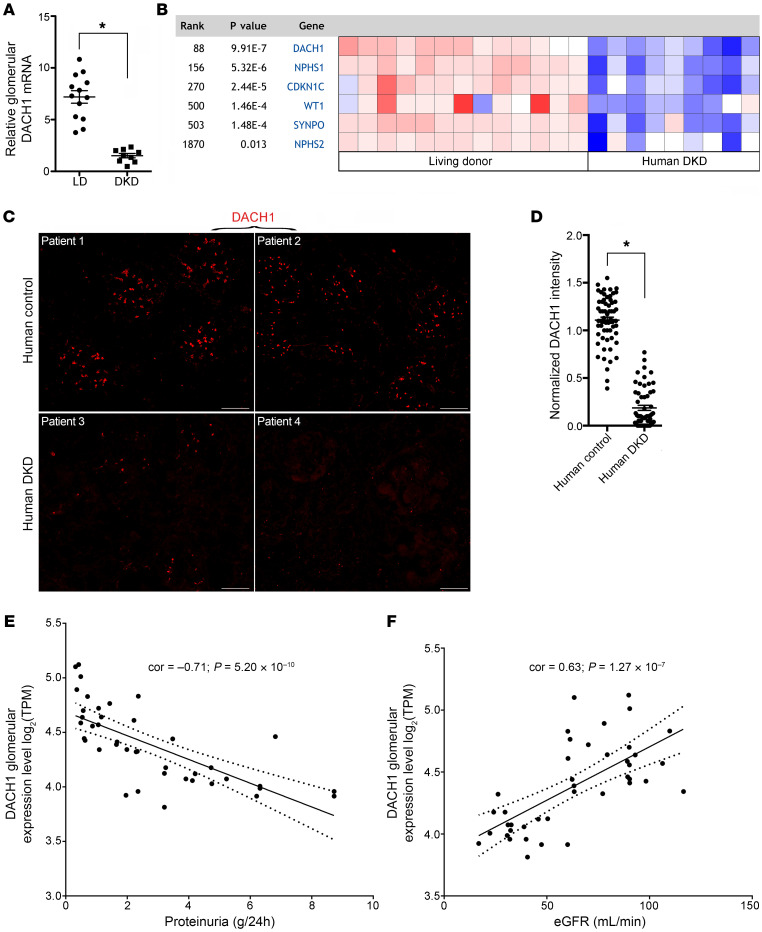
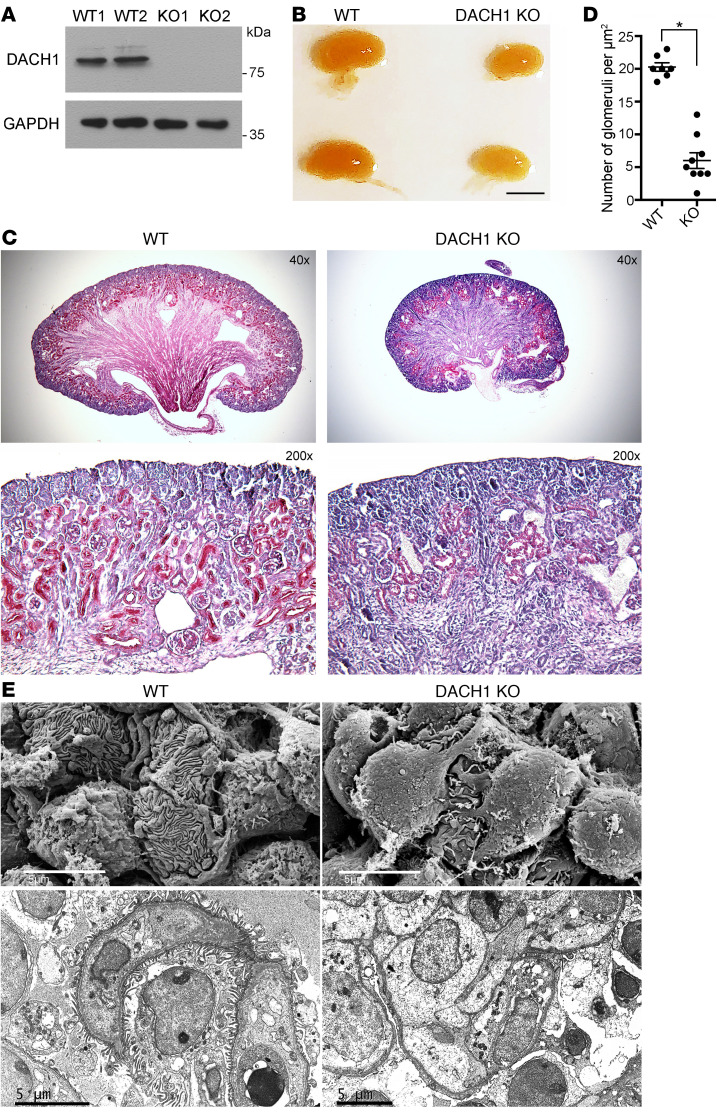
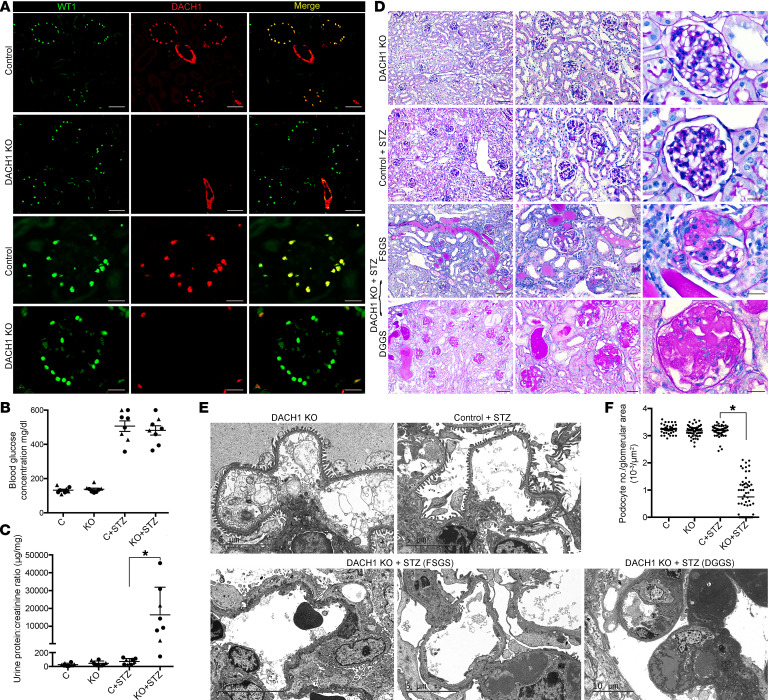
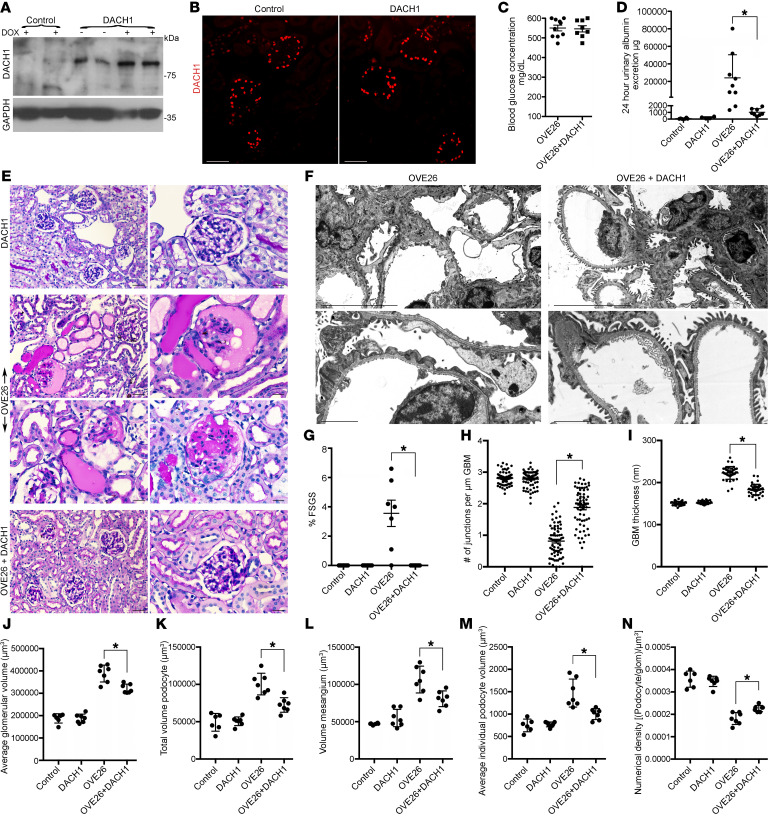
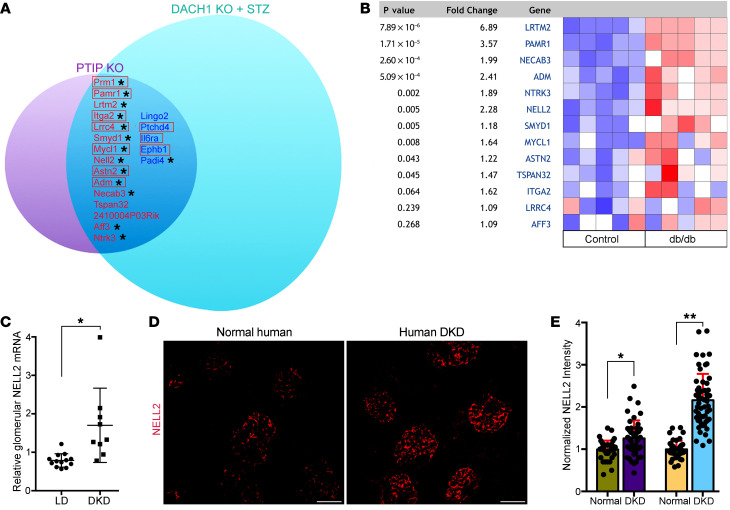
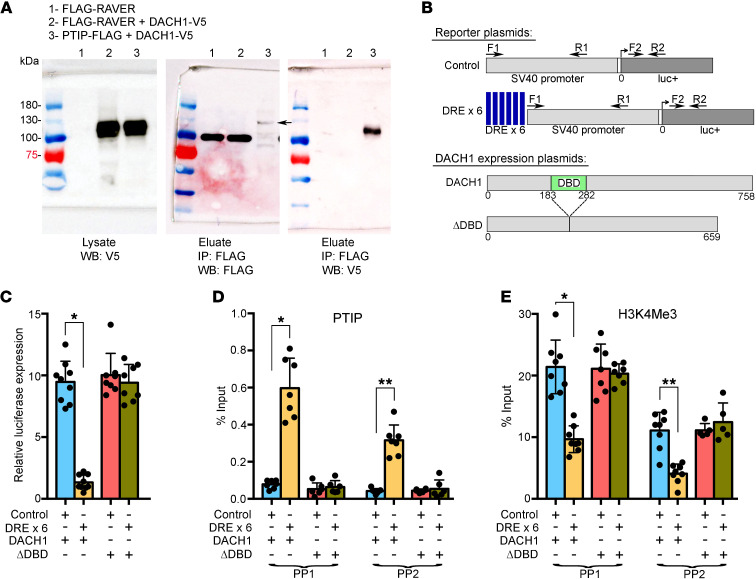
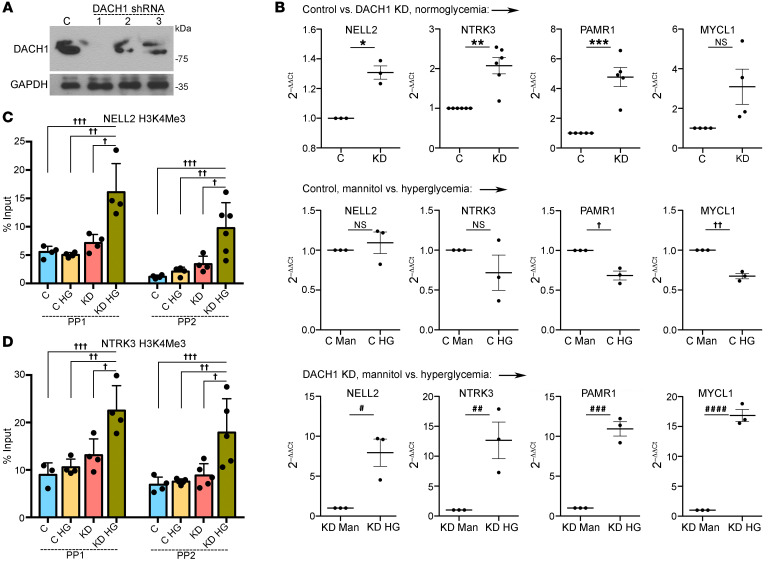
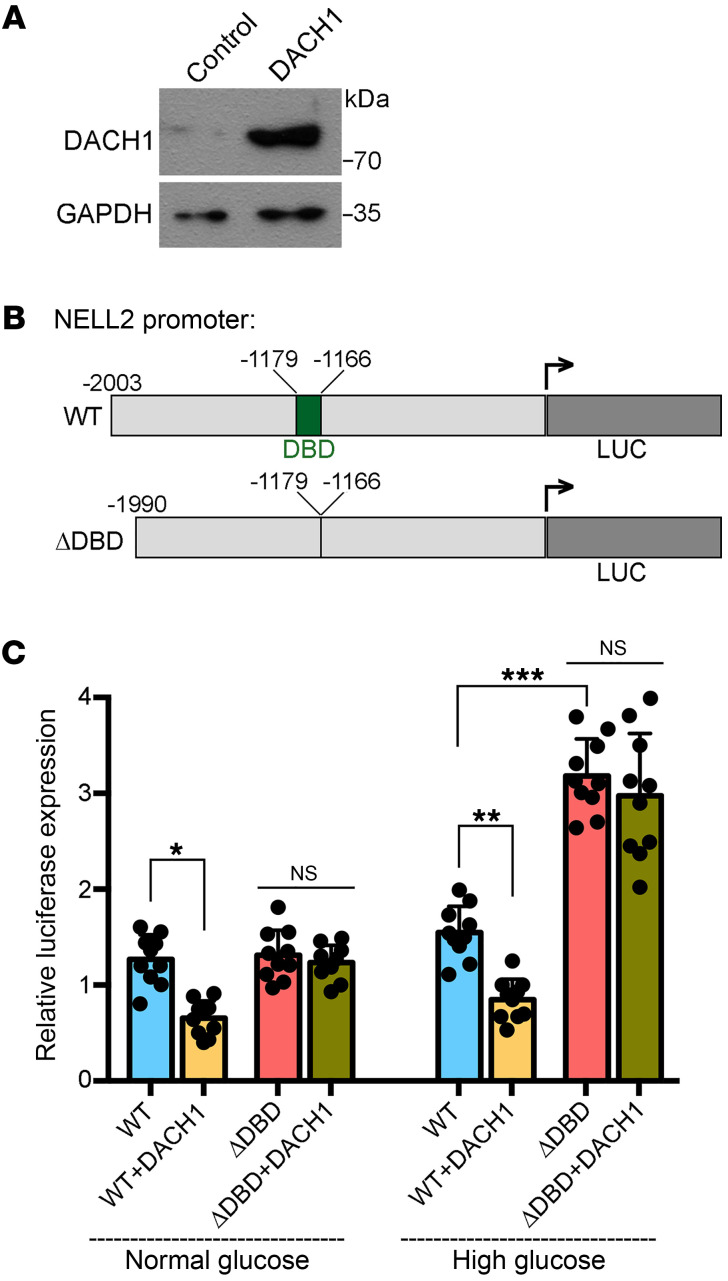
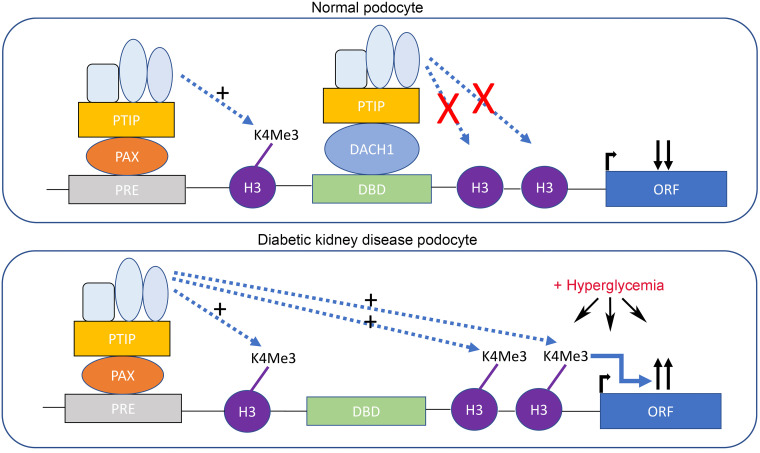
Dachshund homolog 1 (DACH1), a key cell-fate determinant, regulates transcription by DNA sequence-specific binding. We identified diminished Dach1 expression in a large-scale screen for mutations that convert injury-resistant podocytes into injury-susceptible podocytes. In diabetic kidney disease (DKD) patients, podocyte DACH1 expression levels are diminished, a condition that strongly correlates with poor clinical outcomes. Global Dach1 KO mice manifest renal hypoplasia and die perinatally. Podocyte-specific Dach1 KO mice, however, maintain normal glomerular architecture at baseline, but rapidly exhibit podocyte injury after diabetes onset. Furthermore, podocyte-specific augmentation of DACH1 expression in mice protects from DKD. Combined RNA sequencing and in silico promoter analysis reveal conversely overlapping glomerular transcriptomic signatures between podocyte-specific Dach1 and Pax transactivation-domain interacting protein (Ptip) KO mice, with upregulated genes possessing higher-than-expected numbers of promoter Dach1-binding sites. PTIP, an essential component of the activating histone H3 lysine 4 trimethylation (H3K4Me3) complex, interacts with DACH1 and is recruited by DACH1 to its promoter-binding sites. DACH1-PTIP recruitment represses transcription and reduces promoter H3K4Me3 levels. DACH1 knockdown in podocytes combined with hyperglycemia triggers target gene upregulation and increases promoter H3K4Me3. These findings reveal that in DKD, diminished DACH1 expression enhances podocyte injury vulnerability via epigenetic derepression of its target genes.

Keywords: Chronic kidney disease; Diabetes; Epigenetics; Nephrology.


Conflict of interest statement

Conflict of interest: The authors have declared that no conflict of interest exists.

Figures

Figure 1
Figure 1. Diminished DACH1 expression identified as rescuing podocyte injury susceptibility.
(A) Schematic of large-scale mutagenic screen (17). Immortalized podocyte cell lines from different genetic backgrounds were generated, infected with HIV provirus, and grown in soft agar. Podocytes derived from CAST/Ei mice, a background completely resistant to HIV-induced injury, did not show anchorage-independent growth, whereas cells derived from the sensitive FVB/N background grew robustly. Podocytes from FVB×CAST F1 mice formed rare colonies, a result of HIV proviral integration influencing a host gene. The HIV integration sites of these clones were mapped, and the candidate gene Dach1 identified. (B) The podocyte clone where HIV had integrated into the Dach1 locus showed reduced Dach1 expression by qPCR. *P < 0.05; **P < 0.04; ***P < 0.02; ****P < 0.005. (B), 1-way ANOVA and Tukey’s post hoc test.
Figure 2
Figure 2. In human DKD patients, levels of podocyte DACH1 expression are reduced and correlate strongly with poor clinical outcomes.
(A) Glomerular DACH1 mRNA expression levels are decreased in DKD patients compared with healthy living kidney donors. Data are from a previously published microarray study by Woroniecka et al. (40) and were subjected to further analysis by Nephroseq (Compendia Bioscience). *P < 9.91 × 10⁻⁷, 2-tailed Student’s t test. (B) The magnitude of diminished glomerular DACH1 mRNA expression was in the top 1% overall (40), higher than almost all other major podocyte genes. Adapted from Nephroseq. (C) DACH1 fluorescent staining intensity in glomeruli is diminished in human nephrectomy samples with a clinicopathological diagnosis of DKD compared with controls. Representative images taken with identical exposure times are shown. Scale bars: 100 μm. (D) Differences in DACH1 glomerular fluorescent intensity between DKD (n = 4 patients, 58 glomeruli analyzed) and controls (n = 4 patients, 62 glomeruli analyzed) were quantified relative to DAPI. *P < 0.0001, 2-tailed Student’s t test. (E) Correlation between glomerular DACH1 mRNA expression levels on microarray and proteinuria (n = 41, correlation = –0.71, P = 5.20 × 10⁻¹⁰). (F) Correlation blot as in E but to EGFR (n = 41, correlation = 0.63, P = 1.27 × 10–07).
Figure 3
Figure 3. Global Dach1 KO mice manifest renal hypoplasia, podocyte developmental failure, and die perinatally.
(A) Western blotting using a DACH1-specific antibody on pooled brain and kidney lysates from WT and Dach1 KO newborn pups. (B) Comparison of kidney gross appearance of newborn WT and global Dach1 KO littermates. Scale bar: 600 μm. (C) PAS stain of coronal sections from these kidneys shows reduced diameters of nephrogenic and medullary zones with reduced glomerular number. Original magnification, ×40 (upper panels); ×200 (lower panels). (D) Quantification of glomerular density. *P < 0.0001, 2-tailed Student’s t test. (E) SEM of newborn WT and Dach1 KO kidneys (upper panels). KO glomeruli show grossly disorganized foot processes that fail to interdigitate. TEM images show severe failure of foot-process formation in newborn Dach1 KO mice compared with WT littermates (lower). Scale bars: 5 μm.
Figure 4
Figure 4. Podocyte-specific Dach1 KO mice, after onset of type I DM, exhibit severe podocyte injury with rapid progression to ESRD.
(A) Double-immunofluorescent staining for DACH1 and the podocyte nuclear marker WT1. Podocyte-specific Dach1 KO mice show absent podocyte DACH1 expression, whereas control littermates exhibit robust podocyte DACH1 expression. Scale bars: 50 μm (low power); 20 μm (high power). (B) Blood glucose levels of mice 2 weeks after completion of STZ administration. Circles, male mice; triangles, female mice. (C) Spot urine protein:creatinine ratios of mice collected 4 weeks after onset of type I DM. *P < 0.01. (D) PAS-stained kidney sections. Nondiabetic age-matched podocyte-specific Dach1 KO mice have normal appearing glomerular morphology (top row). Age-matched control mice also demonstrate normal glomerular structure 1 month after onset of type I DM (second row). Podocyte-specific Dach1 KO mice, however, also sacrificed 1 month after DM onset, showed severe FSGS with evidence of podocyte loss and detachment and diffuse tubular proteinaceous casts (third row). In fact, several mice by this time point had progressed to DGGS consistent with ESRD (bottom row). Scale bars: 100 μm (low power); 40 μm (medium power); 20 μm (high power). (E) Podocyte-specific Dach1 KO mice under basal conditions demonstrate open capillary loops with delicate foot processes (upper left). Control mice also show normal podocyte morphology 1 month after onset of type I DM (upper right). Diabetic podocyte-specific Dach1 KO mice, however, demonstrate catastrophic podocyte injury characterized by total disruption of actin cytoskeletal structure (lower left) with loss of primary and secondary processes and complete foot-process effacement (lower middle). Several mice showed DGGS with severe podocyte loss and a largely denuded GBM (lower right). (F) Quantification of podocyte numbers. n = 3 mice per group with 20 glomeruli analyzed per mouse. *P < 0.0001, 2-tailed Student’s t test.
Figure 5
Figure 5. Inducible podocyte-specific DACH1 overexpression protects from DKD.
(A) Western blotting using a DACH1-specific antibody on glomerular lysates of transgenic mice. DACH1 mice (TRE-Dach1; pod-rtTA) show robust induction of DACH1 expression after 1 week of DOX supplementation. (B) IF demonstrates that DACH1 overexpression is restricted to podocytes in DACH1 mice. Scale bars: 50 μm. (C) Blood glucose levels of 6-week-old OVE26 transgenic mice without or with induction of podocyte-specific DACH1 expression. (D) Measurements of 24-hour urinary albumin excretion immediately prior to euthanasia at age of 14 weeks. *P < 0.03. (E) Representative PAS-stained kidney sections. DACH1 kidneys under basal conditions appear morphologically normal. OVE26 mice show FSGS with associated tubular proteinaceous casts and mesangial expansion. FSGS was not evident in OVE26 littermates that also had podocyte-specific induction of DACH1. Scale bars: 40 μm (low power); 20 μm (high power). (F) Representative TEM images of OVE26 mice. OVE26 mice demonstrate widespread podocyte injury with loss of primary and secondary processes and diffuse foot-process effacement. OVE26 littermates that also have podocyte-specific expression of DACH1 show significant podocyte protection, including preservation of overall cellular morphology and foot-process architecture. Scale bars: 5 μm. (G) Percentage of glomeruli showing FSGS was calculated. *P < 0.002. (HN) Morphometric measurements demonstrate that podocyte DACH1 overexpression mitigates the glomerular changes induced by the diabetes of OVE26. Quantification of (H) podocyte effacement (*P < 0.0001), (I) GBM thickness (*P < 0.0001), (J) average glomerular volume (*P < 0.0013), (K) total podocyte volume (*P < 0.0011), (L) mesangial volume (*P < 0.0067), (M) average individual podocyte volume (*P < 0.0031), and (N) podocyte numerical density (*P < 0.0022). (H and I) n = 3 mice per group. (JN) Control, n = 6 mice; DACH1, OVE26, and OVE26 + DACH1 groups, n = 7 mice per group. Two-tailed Student’s t test (C, D, and GN).
Figure 6
Figure 6. Combining transcriptomic and in silico promoter analyses to identify direct DACH1 transcriptional target genes in podocytes.
(A) RNA-Seq was performed to compare glomerular transcriptomes of control and Dach1 podocyte-specific KO mice at baseline and early after STZ-induced DM. Results were overlapped with a previously reported microarray of podocyte-specific Ptip KO mice under basal conditions (38). Twenty out of a total of 38 genes from the Ptip KO glomeruli were also dysregulated in Dach1 KO glomeruli. Genome-wide in silico promoter analysis using a previously reported positional weight matrix (4) found the upregulated genes in this Dach1-Ptip overlap set to be highly enriched for the presence of at least 1 promoter DBD. Gene names surrounded by a red rectangle indicate dysregulation in glomeruli of Dach1 KO mice under basal conditions. Asterisks indicate the presence of promoter DBD. (B) Glomerular mRNA levels of the upregulated Dach1-Ptip overlap gene set in a previously reported microarray analysis of db/db mice (39) and subjected to further analysis by Nephroseq. All genes present on the microarray chip from the overlap set are also upregulated to varying degrees in this diabetes model. (C) Glomerular mRNA levels of the DACH1 target gene NELL2 are increased in human DKD. Data are from a previously reported microarray study (40) and subjected to further analysis by Nephroseq. *P < 0.001. (D) NELL2 fluorescent staining intensity is increased in glomeruli in human nephrectomy samples with a clinicopathological diagnosis of DKD (n = 3) compared with normal controls (n = 4). Representative images taken with identical exposure times are shown. In kidney overall, NELL2 expression is highly enriched in podocytes. Scale bars: 100 μm. (E) Differences in NELL2 glomerular fluorescent intensity between DKD (n = 50) and control (n = 50) were quantified relative to DAPI (*P < 0.0005) and to WT1 (**P < 0.0001). (C and E) Two-tailed Student’s t test.
Figure 7
Figure 7. PTIP is recruited by DACH1 to DACH1 DNA binding sites and causes transcriptional repression and decreased H3K4Me3 levels.
(A) Co-IP was performed between PTIP-FLAG and DACH1-V5 using antibodies to their tags. FLAG-RAVER was used as a negative control protein. Indicated lysates were combined and incubated overnight with anti-FLAG antibodies bound to superparamagnetic iron–impregnated beads. A robust protein complex is present between PTIP-FLAG and DACH1-V5, but completely absent between FLAG-RAVER and DACH1-V5. Molecular weight of indicated proteins is as follows: FLAG-RAVER, 95 kDa; DACH1-V5, 105 kDa; PTIP-FLAG, 120 kDa. Protein interaction is robust despite comparatively low expression of PTIP-FLAG. Band indicated by arrow. (B) Schematic of SV40-luciferase reporter plasmids (upper) and DACH1 expression plasmids (lower). DREs were synthesized as a sextet multimer and subcloned immediately upstream of the SV40 promoter. Location of primers used for ChIP-qPCR are indicated. The DACH1 ΔDBD expression plasmid carries a deletion of its box-N domain, which mediates direct binding of DACH1 to DNA. (C) Each of the reporter plasmids was cotransfected with a DACH1 expression plasmid into 293T cells and then luciferase expression measured. Dramatic transcriptional repression was induced by the combined presence of upstream DACH1 DNA binding sites and a DACH1 protein able to bind to these sites. *P < 0.0001. (D) ChIP-qPCR was performed using an antibody specific for PTIP and primer pairs indicated in B. *P < 0.0001; **P < 0.0001. (E) ChIP-qPCR as in D, but with an H3K4Me3 antibody. *P < 0.0001; **P < 0.0001. (CE) One-way ANOVA and Tukey’s post hoc test.
Figure 8
Figure 8. DACH1 knockdown in podocytes combined with hyperglycemia triggers target gene derepression and increases promoter H3K4Me3 levels.
(A) Western blot comparing levels of DACH1 protein between stably transduced human podocyte cell lines that each express a distinct DACH1-targeted shRNA or scrambled shRNA control plasmid. (B) qPCR for 4 DACH1-target genes (NELL2, NTRK3, PAMR1, and MYCL1) in DACH1 knockdown shRNA no. 1 and control transduced podocytes with and without hyperglycemia. Under basal conditions, DACH1 knockdown (KD) podocytes showed modest transcriptional derepression of each of the 4 genes compared with control shRNA podocytes (top panel). *P < 0.003; **P < 0.0004; ***P < 0.0004. In control podocytes cultured in high glucose, none of the 4 genes demonstrated increased mRNA expression levels compared with identical cells grown in mannitol (middle panel). P < 0.005; ††P < 0.0007. In DACH1 KD podocytes grown in high glucose, however, transcriptional derepression was augmented dramatically (lower panel). #P < 0.015; ##P < 0.003; ###P < 0004; ####P < 0.0001. (C) ChIP-qPCR was performed using an H3K4Me3-specific antibody and primers specific for the promoter of NELL2 comparing chromatin extracted from DACH1 KD and control podocytes with and without high glucose. The combination of DACH1 KD with hyperglycemia caused an increase in levels of promoter bound H3K4Me3. Primer pair 1: *P < 0.002; **P < 0.001; ***P < 0.001. Primer pair 2: P < 0.015; ††P < 0.004; †††P < 0.001. (D) ChIP qPCR as in C, but with primers specific for the NTRK3 promoter. Primer pair 1: *P < 0.015; **P < 0.003; ***P < 0.002. Primer pair 2: P < 0.012; ††P < 0.004; †††P < 0.004. (B) Two-tailed Student’s t test. (C and D) One-way ANOVA and Tukey’s post hoc test.
Figure 9
Figure 9. DACH1-mediated transcriptional repression in podocytes requires direct DACH1 sequence–specific promoter binding.
(A) Western blot to compare levels of DACH1 protein between human podocytes stably transduced with a DACH1 expression plasmid and podocytes stably transduced with vector alone. (B) Schematic of luciferase lentiviral reporter constructs. Shown are the full-length NELL2 promoter (WT) and one that contains a deletion of its DBD (ΔDBD). (C) In WT transduced podocytes, NELL2 promoter activity was lower in DACH1 overexpressing podocytes compared with controls both at baseline (*P < 0.0001) and under conditions of hyperglycemia (**P < 0.0001). In ΔDBD transduced podocytes, however, DACH1-mediated transcriptional repression was absent, and luciferase levels were not different between DACH1 overexpressing and control cells both at baseline and in hyperglycemia. Moreover, when exposed to hyperglycemia, ΔDBD promoter activity was significantly higher than that of the WT promoter (***P < 0.0001), a pattern similar to transcriptional derepression evident in DACH1 knockdown podocytes. (C) One-way ANOVA and Tukey’s post hoc test.
Figure 10
Figure 10. Proposed mechanism of transcriptional derepression of DACH1 target genes in human DKD.
Previous studies show that PTIP is recruited by Pax proteins to promoter Pax response elements (PREs) and that this enhances promoter H3K4Me3 levels and causes transcriptional activation (24). In the current work, we show that PTIP can also be recruited by sequence-specific binding of DACH1 to its target gene promoters, but that this recruitment suppresses transcription and reduces promoter H3K4Me3 levels. We propose that in DKD, reduced levels of podocyte DACH1 expression cause diminished recruitment of PTIP by DACH1 to its target gene promoters. This, in combination with hyperglycemia, results in increased promoter H3K4Me3 levels and transcriptional derepression of multiple DACH1 target genes.

Comment in

Similar articles

Cited by

References

    1. Davis RJ, et al. Dach1 mutant mice bear no gross abnormalities in eye, limb, and brain development and exhibit postnatal lethality. Mol Cell Biol. 2001;21(5):1484–1490. doi: 10.1128/MCB.21.5.1484-1490.2001. - DOI - PMC - PubMed
    1. Wu K, et al. Endogenous Dach1 in cancer. Oncoscience. 2015;2(10):803–804. doi: 10.18632/oncoscience.251. - DOI - PMC - PubMed
    1. Kong D, et al. The retinal determination gene network: from developmental regulator to cancer therapeutic target. Oncotarget. 2016;7(31):50755–50765. doi: 10.18632/oncotarget.9394. - DOI - PMC - PubMed
    1. Zhou J, et al. Attenuation of Forkhead signaling by the retinal determination factor DACH1. Proc Natl Acad Sci U S A. 2010;107(15):6864–6869. doi: 10.1073/pnas.1002746107. - DOI - PMC - PubMed
    1. Zhou J, et al. Transcription elongation regulator 1 is a co-integrator of the cell fate determination factor Dachshund homolog 1. J Biol Chem. 2010;285(51):40342–40350. doi: 10.1074/jbc.M110.156141. - DOI - PMC - PubMed

Publication types

MeSH terms