. 2021 May 17;131(10):e146777.
doi: 10.1172/JCI146777.

Selective androgen receptor modulators activate the canonical prostate cancer androgen receptor program and repress cancer growth

Affiliations

Selective androgen receptor modulators activate the canonical prostate cancer androgen receptor program and repress cancer growth

Michael D Nyquist et al. J Clin Invest. .

Erratum in

Abstract

Prostate cancer (PC) is driven by androgen receptor (AR) activity, a master regulator of prostate development and homeostasis. Frontline therapies for metastatic PC deprive the AR of the activating ligands testosterone (T) and dihydrotestosterone (DHT) by limiting their biosynthesis or blocking AR binding. Notably, AR signaling is dichotomous, inducing growth at lower activity levels, while suppressing growth at higher levels. Recent clinical studies have exploited this effect by administration of supraphysiological concentrations of T, resulting in clinical responses and improvements in quality of life. However, the use of T as a therapeutic agent in oncology is limited by poor drug-like properties as well as rapid and variable metabolism. Here, we investigated the antitumor effects of selective AR modulators (SARMs), which are small-molecule nonsteroidal AR agonists developed to treat muscle wasting and cachexia. Several orally administered SARMs activated the AR program in PC models. AR cistromes regulated by steroidal androgens and SARMs were superimposable. Coregulatory proteins including HOXB13 and GRHL2 comprised AR complexes assembled by both androgens and SARMs. At bioavailable concentrations, SARMs repressed MYC oncoprotein expression and inhibited the growth of castration-sensitive and castration-resistant PC in vitro and in vivo. These results support further clinical investigation of SARMs for treating advanced PC.

Keywords: Oncology; Prostate cancer.


Conflict of interest statement

Conflict of interest: JTD reports receiving royalty payments related to patents for SARM development and royalty distributions from the University of Tennessee Research Foundation related to SARM patents (US 2019/0055192 A1). PSN has served as an advisor to Astellas Pharma, Janssen Pharmaceuticals, and Bristol Myers Squibb.

Figures

Figure 1
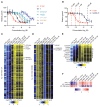
Figure 1. Selective AR modulators activate the canonical AR program in PC cells and repress tumor cell proliferation.
(A) Dose-response curves were determined in the LNCaP cell line for the steroidal androgens R1881 and T, the antiandrogen ENZ, and the nonsteroidal AR agonists T8039, GTX-024, GTX-027, and SARM-2F (n = 4). Data represent the mean ± SD. (B) Doses of R1881 and SARMs chosen for RNA-Seq analysis. Gene expression heatmaps are shown for the top 100 genes (C) induced or (D) repressed by treatment with 1 nM R1881 (n = 2). (E) Gene expression heatmap of genes that comprise the ARG.10 signature. (F) GSVA signature score heatmap for the AR-regulated gene sets ARG.10, AR_Induced, and AR_Repressed.
Figure 2
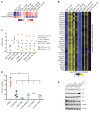
Figure 2. SARMs suppress MYC levels and proliferation-associated gene expression.
(A) GSVA signature score heatmap of cell-cycle–related gene sets from RNA-Seq data. (B) Heatmap of RNA-Seq mean-centered log2(CPM) values for cell-cycle progression signature genes. (C) GSEA normalized enrichment scores (NESs) plotted for Hallmark gene sets. (D) Percentage of LNCaP cells in S phase when treated for 48 hours with 10 μM ENZ, 5 nM R1881, or 5 μM SARMs (n = 3). *P < 0.05, by 1-way ANOVA with Sidak’s multiple-comparison test. Data represent the mean ± SD. (E) Immunoblots for p16, p21, AR, FOXM1, and MYC performed on LNCaP cells treated with 5 nM R1881, 5 μM SARMs, or 0.4 μg/mL mitomycin-C for 6 days.
Figure 3
Figure 3. The SARM Cpd26 potently suppresses PC growth and induces luminal epithelial gene expression.
(A) Dose-response curve of the transdermal SARM Cpd26 in LNCaP, VCaP, and 22PC-EP cells (n = 4). Data represent the mean ± SD. (B) Immunoblots of the cell-cycle proteins p21, MYC, and FOXM1 in LNCaP cells treated with R1881, ENZ, or Cpd26. qRT-PCR values are plotted for LNCaP cells treated with ENZ, R1881, or doses of Cpd26 for 48 hours, measuring the expression of the AR-activated genes (C) KLK3 and (D) FKBP5; the AR-repressed gene (E) UGT2B17; and the cell-cycle genes (F) CDK1, (G) FOXM1, and (H) MYBL2 (n = 8). *P < 0.05, by 1-way ANOVA with Dunnett’s multiple-comparison test. Data represent the mean ± SD.
Figure 4
Figure 4. SARMs and steroidal androgens regulate concordant AR cistromes in PC.
(A) Heatmap of SARM-induced AR binding to R1881-induced AR binding sites determined by CUT&RUN. Comparison of SARM and steroid-induced AR binding near (B) KLK3 and (C) FKBP5 (peaks are representative of 2 biological replicates). (D) Motif analysis of AR-bound sites across R1881 and SARM treatments (for all groups, q < 0.0001).
Figure 5
Figure 5. High-dose androgen and high-dose SARM induced AR binding to overlapping sites.
(A) Venn diagram of differentially bound sites between high- and low-dose R1881 overlapped with sites differentially bound between high-dose SARMs and low-dose R1881. (B) Volcano plot of differentially bound AR sites between high-dose R1881 and all SARM treatments. (C) PCA plot comparing SARM- and R1881-induced AR cistromes. (D) Overlap of differentially bound AR sites for high- versus low-dose R1881 and high-dose R1881 versus high-dose SARMs.
Figure 6
Figure 6. SARMs and steroidal androgens promote analogous AR-cofactor interactions.
(A) Venn diagram of the number proteins detected by RIME analysis of AR-bound chromatin complexes for 5 μM SARM-2F– and 5 μM R1881-treated LNCaPs. FDR q < 0.05 (n = 3). (B) Fold change of AR-bound proteins over IgG for R1881- and SARM-2F–treated samples as detected by RIME (n = 3). (C) Protein signal intensity for the AR and AR cofactors involved in luminal prostate differentiation. (D) Transcription factors complexed with the AR detected by RIME. (E) SWI/SNF factors detected in AR complexes. (F) DNA repair and replication factors in AR complexes. (CF) n = 3. Data represent the mean ± SD.
Figure 7
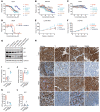
Figure 7. SARMs activate AR signaling and repress PC growth in vitro and in vivo.
(AD) Dose-response curves were generated for the steroidal androgens R1881 and T, the antiandrogen ENZ, the nonsteroidal AR agonists T8039, GTX-024, GTX-027, and SARM-2F for (A) VCaP, (B) 22PC-EP, and (C) APIPC cell lines (n = 4). Data represent the mean ± SD. (D) Dose-response curves for the survivin inhibitor YM155 in LNCaP cells with and without 5 μM SARM-2F (n = 4). Data represent the mean ± SD. (E) Tumor volume plot of LuCaP 35CR PDXs treated 5 times per week with vehicle (n = 10), 100 mg/kg SARM-2F (n = 10) (P = 0.045), or 30 mg/kg T8039 (n = 10) (P = 0.02), or with biweekly 40 mg/kg i.m. injections of T for 28 days (n = 10) (P = 0.047). Data represent the mean ± SEM. (F) Tumor volume plot of LuCaP 96 PDXs treated 3 times per week with the indicated doses of SARMs: 100 mg/kg SARM-2F (n = 8) (P = 0.04), or 30 mg/kg T8039 (n = 5) (P = 0.014), or biweekly with i.m. injections of 40 mg/kg T (n = 7) (P = 0.171) or vehicle (n = 7). Data represent the mean ± SEM. (G) Immunoblots of 35CR PDX lysates for p21, AR, and MYC. Lysates were harvested 48 hours after dosing. (H) IHC images of AR, KLK3, MYC, and Ki67 in 35CR PDX tumors analyzed 48 hours after dosing with vehicle, 40 mg/kg T, 30 mg/kg T8039, or 100 mg/kg SARM-2F. Scale bar: 100 μm. Original magnification, ×20. (I) Relative signal intensity for the AR by IHC (n = 4). (J) Relative signal intensity for PSA by IHC (n = 4). (K) Percentage of MYC-positive nuclei by IHC (n = 3). (L) Ki67-positive staining by IHC (n = 3). (I and J) Data represent the mean ± first and third interquartile range. *P < 0.05, by 1-way ANOVA with Dunnett’s multiple-comparison test.

Comment in

  • Urological Oncology: Prostate Cancer.
    Taneja SS. Taneja SS. J Urol. 2021 Oct;206(4):1062-1064. doi: 10.1097/JU.0000000000002132. Epub 2021 Jul 20. J Urol. 2021. PMID: 34281353 No abstract available.

References

    1. Nelson PS, et al. The program of androgen-responsive genes in neoplastic prostate epithelium. Proc Natl Acad Sci U S A. 2002;99(18):11890–11895. doi: 10.1073/pnas.182376299. - DOI - PMC - PubMed
    1. Heinlein CA, Chang C. Androgen receptor in prostate cancer. Endocr Rev. 2004;25(2):276–308. doi: 10.1210/er.2002-0032. - DOI - PubMed
    1. Cunha GR, et al. The endocrinology and developmental biology of the prostate. Endocr Rev. 1987;8(3):338–362. doi: 10.1210/edrv-8-3-338. - DOI - PubMed
    1. Nelson PS. Molecular states underlying androgen receptor activation: a framework for therapeutics targeting androgen signaling in prostate cancer. J Clin Oncol. 2012;30(6):644–646. doi: 10.1200/JCO.2011.39.1300. - DOI - PubMed
    1. Watson PA, et al. Emerging mechanisms of resistance to androgen receptor inhibitors in prostate cancer. Nat Rev Cancer. 2015;15(12):701–711. doi: 10.1038/nrc4016. - DOI - PMC - PubMed

Publication types