Meta-Analysis
. 2021 Oct;6(5):413-434.
doi: 10.1089/can.2019.0095. Epub 2020 Aug 21.

Scoping Review and Meta-Analysis Suggests that Cannabis Use May Reduce Cancer Risk in the United States

Affiliations
Meta-Analysis

Scoping Review and Meta-Analysis Suggests that Cannabis Use May Reduce Cancer Risk in the United States

Thomas M Clark. Cannabis Cannabinoid Res. 2021 Oct.

Abstract

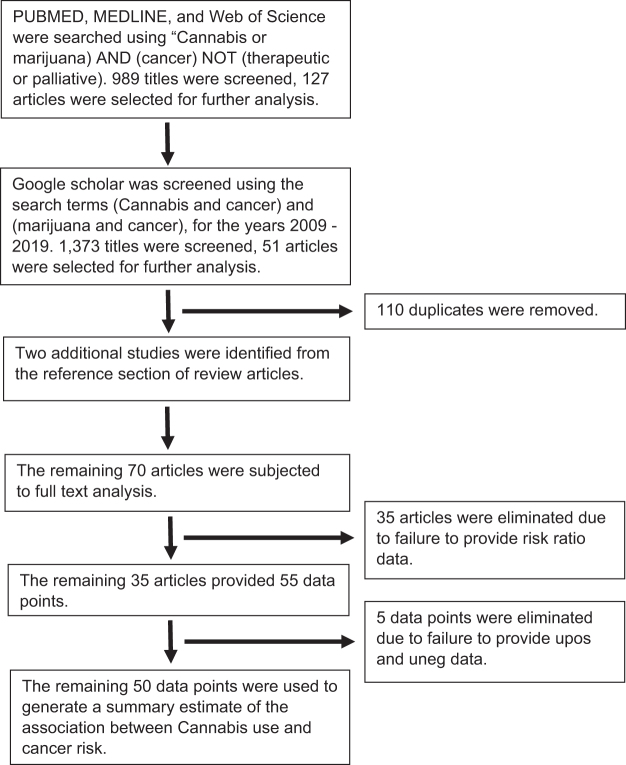
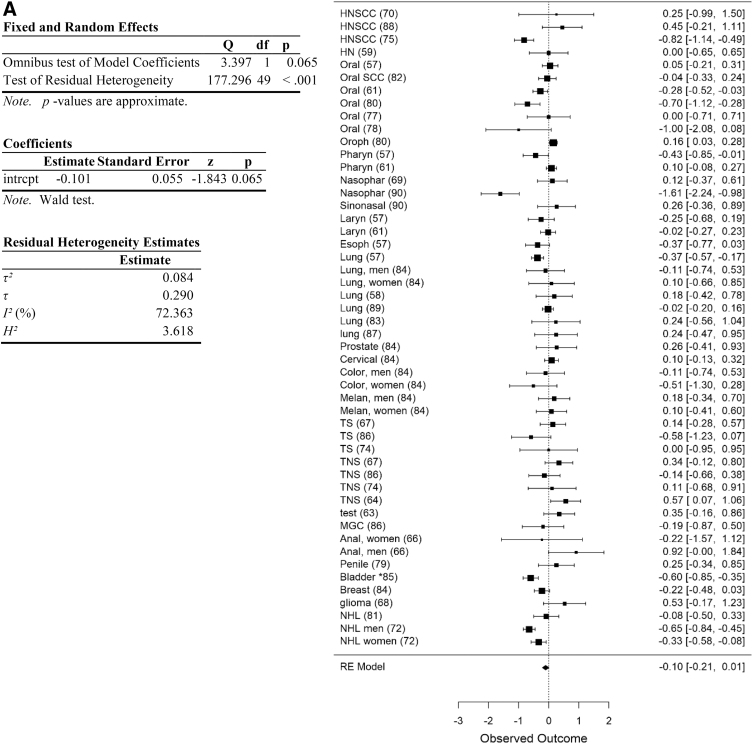
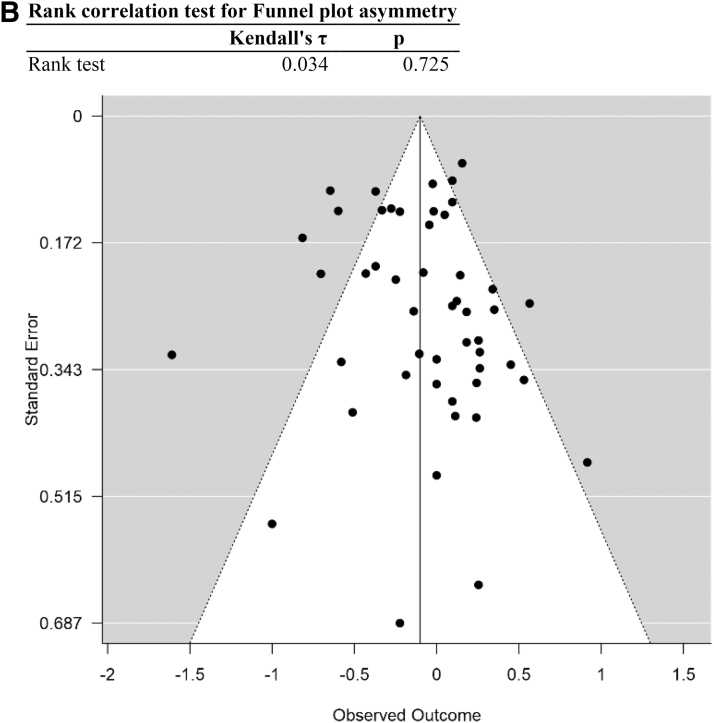
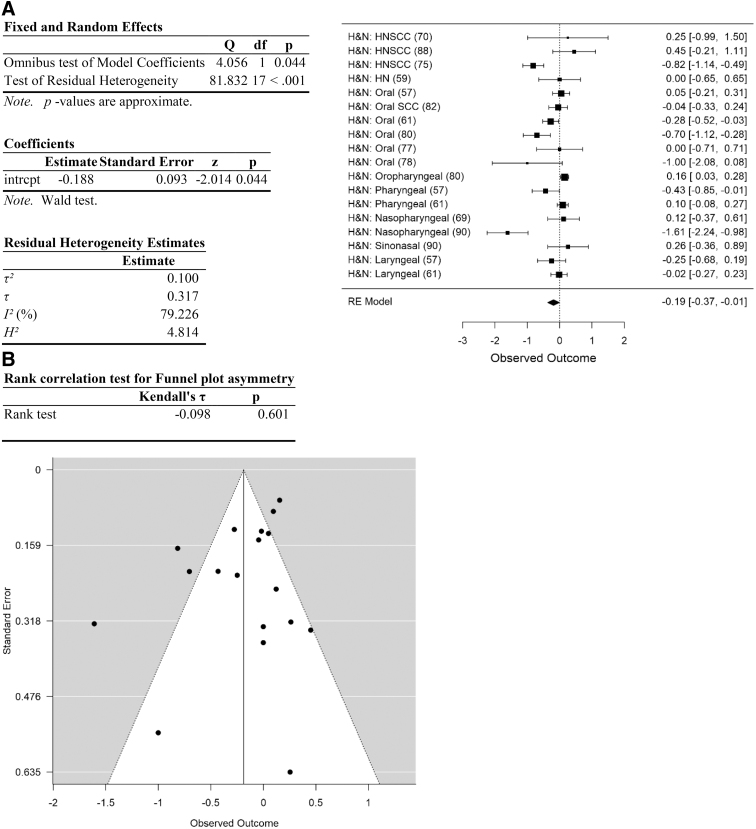
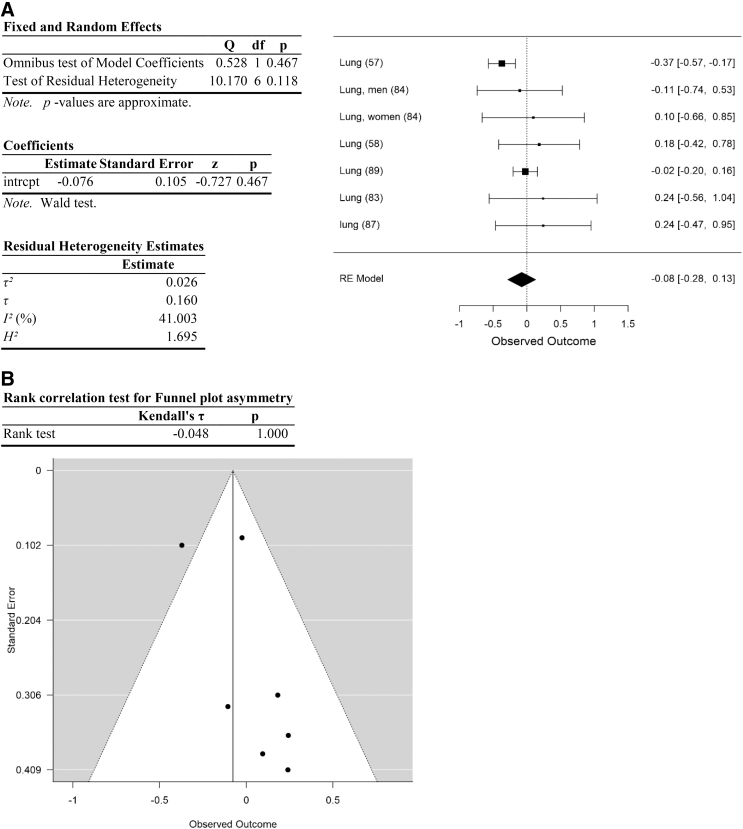
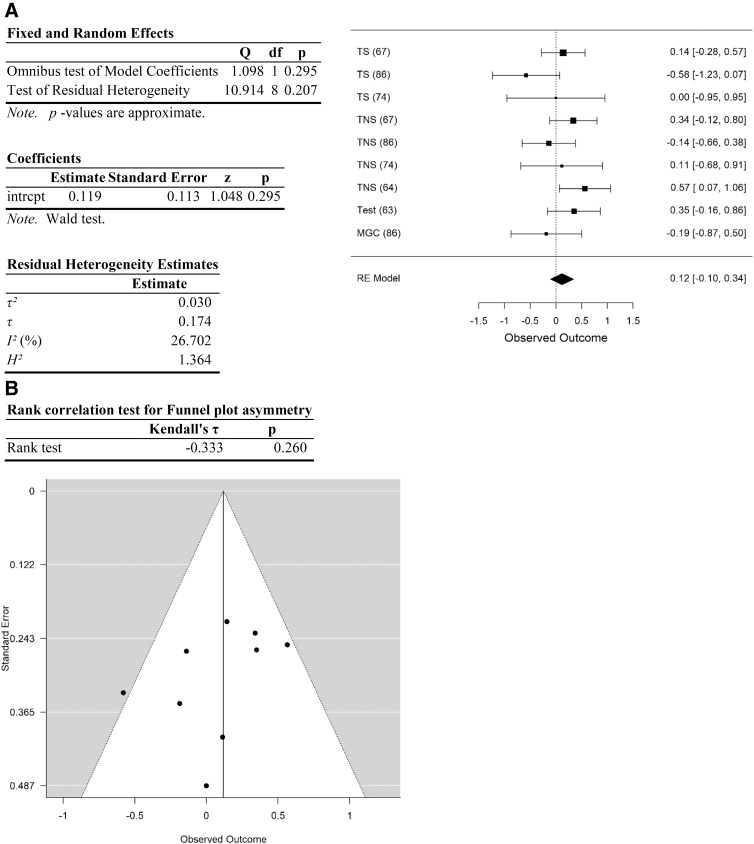
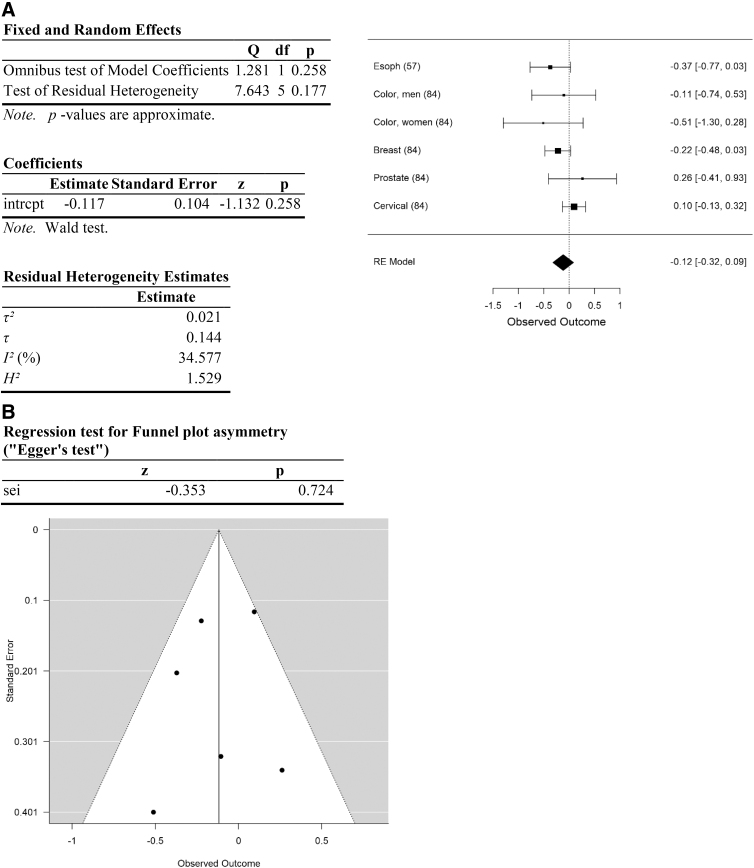
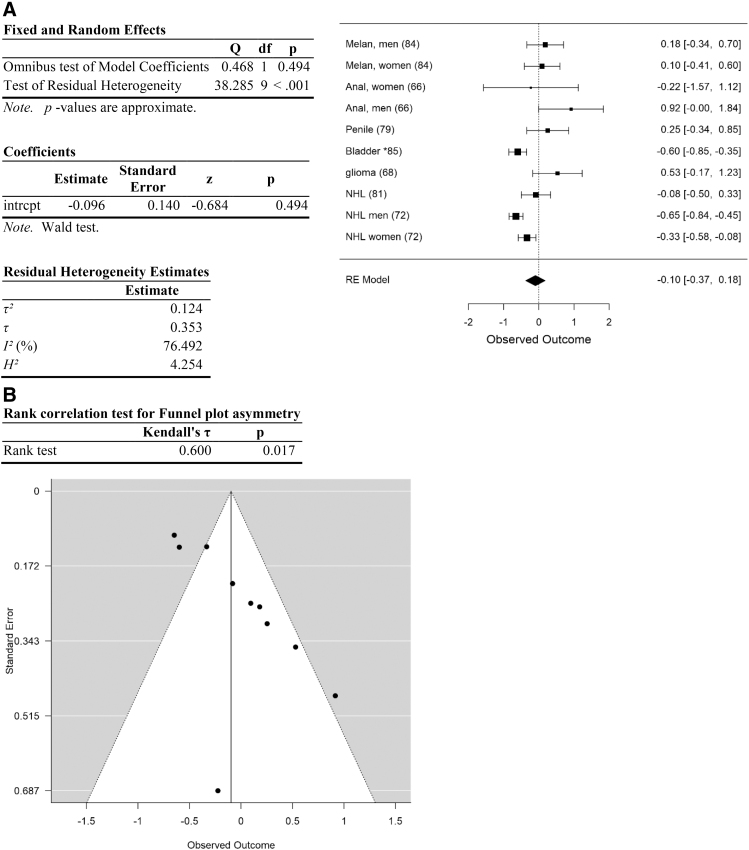
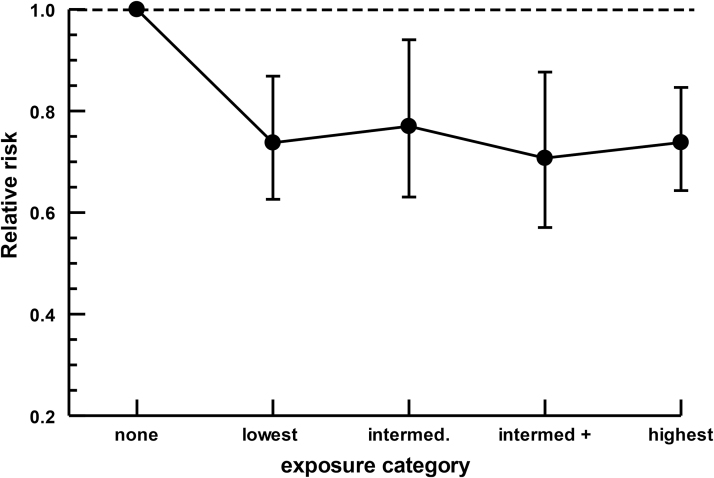
Introduction:Cannabis smoke contains carcinogens similar to tobacco, in addition to compounds with antitumor activity. Cannabis use reduces the risk of obesity and cannabinoids inhibit chronic inflammation, known causes of cancer. The net effect of Cannabis use on cancer risk is not known. Objective: To examine the association between Cannabis use and cancer risk in the United States. Methods: Identify and analyze published data on cancer risk in Cannabis users. Results: A total of 55 data points, consisting of risk ratios of cancer in Cannabis users and nonusers, were identified from 34 studies. Of these, 5 did not contain data essential for inclusion in the meta-analysis. The remaining data showed a nonsignificant trend to an association with reduced risk (relative risk [RR]=0.90, p>0.06, N=50) although heterogeneity is high (I2=72.4%). Removal of data with high risk of selection bias (defined as those from North Africa and those that failed to adjust for tobacco) and data with high risk of performance bias (defined as those with fewer than 20 cases or controls among Cannabis users) resulted in an RR <1.0 (RR=0.86, p<0.017, N=24) and large effect size (Hedges g=0.66), but did not decrease heterogeneity (I2=74.9). Of all cancer sites, only testicular cancer showed an RR value >1, although this was not significant and had a negligible effect size (RR=1.12, p=0.3, Hedges g=0.02). Following removal of testicular cancers the remaining data showed a decrease in risk (RR=0.87, p<0.025, N=41). Cancers of the head and neck showed a negative association with cancer risk (RR=0.83, p<0.05), with a large effect size (Hedges g=0.55), but high heterogeneity (I2=79.2%). RR did not reach statistical significance in the remaining cancer site categories (lung, testicular, obesity-associated, other). The data are consistent with a negative association between Cannabis use and nontesticular cancer, but there is low confidence in this result due to high heterogeneity and a paucity of data for many cancer types.

Keywords: Cannabis; cancer risk; marijuana; meta-analysis; scoping review.


Conflict of interest statement

No competing financial interests exist.

Figures

FIG. 1.
FIG. 1.
PRISMA flow diagram of search strategy and results.
FIG. 2.
FIG. 2.
Summary of all cancer data obtained in search. (A) Forest plot of cancer data. (B) Funnel plot of data. Data are plotted and analyzed as logRR. Corresponding meta-analytic summary RR value=0.90 (95% CI=0.81–1.01; Table 2). Analyzed with Dersimonian–Laird model. CI, confidence interval; HN, head and neck; HNSCC, head and neck squamous cell carcinoma; MGC, mixed germ cell; NHL, non-Hodgkin's lymphoma; RR, relative risk; TNS, testicular non-seminoma; TS, testicular seminoma.
FIG. 2.
FIG. 2.
Summary of all cancer data obtained in search. (A) Forest plot of cancer data. (B) Funnel plot of data. Data are plotted and analyzed as logRR. Corresponding meta-analytic summary RR value=0.90 (95% CI=0.81–1.01; Table 2). Analyzed with Dersimonian–Laird model. CI, confidence interval; HN, head and neck; HNSCC, head and neck squamous cell carcinoma; MGC, mixed germ cell; NHL, non-Hodgkin's lymphoma; RR, relative risk; TNS, testicular non-seminoma; TS, testicular seminoma.
FIG. 3.
FIG. 3.
Analysis of head and neck cancer data. (A) Forest plot. (B) Funnel plot. Data are plotted and analyzed as logRR. Corresponding meta-analytic summary RR value=0.83 (95% CI=0.72–0.99; Table 4). Analyzed with Dersimonian–Laird model.
FIG. 4.
FIG. 4.
Analysis of lung cancer data. (A) Forest plot. (B) Funnel plot. Data are plotted and analyzed as logRR. Corresponding meta-analytic summary RR value=0.93 (95% CI=0.76–1.14; Table 4). Analyzed with Dersimonian–Laird model.
FIG. 5.
FIG. 5.
Analysis of testicular cancer data. (A) Forest plot. (B) Funnel plot. Data are plotted and analyzed as logRR. Corresponding meta-analytic summary RR value=1.12 (95% CI=0.9–1.40; Table 4). Analyzed with Dersimonian–Laird model.
FIG. 6.
FIG. 6.
Analysis of cancer types associated with obesity. (A) Forest plot. (B) Funnel plot. Data are plotted and analyzed as logRR. Corresponding meta-analytic summary RR value=0.89 (95% CI=0.73–1.09; Table 4). Analyzed with Dersimonian–Laird model.
FIG. 7.
FIG. 7.
Analysis of cancer types other than head and neck, lung, testicular, and obesity-associated cancers. (A) Forest plot. (B) Funnel plot. Data are plotted and analyzed as logRR. Corresponding meta-analytic summary RR value=0.91 (95% CI=0.69–1.20; Table 4). Analyzed with Dersimonian–Laird model.
FIG. 8.
FIG. 8.
Analysis of potential exposure-dependence. Data from a subset of studies could be assigned to arbitrary exposure categories. Results are expressed as mean RR ±95% CI. Cancer types, and exposure units placed into each category, are presented in Table 5. All exposure categories are significantly different to nonusers but not different to each other.

References

    1. Siegel RL, Miller KD, Jemal A. Cancer statistics, 2019. CA Cancer J Clin. 2019;69:7–34. - PubMed
    1. Islami F, Miller KD, Siegel RL, et al. . National and state estimates of lost earnings from cancer deaths in the United States. JAMA Oncol. 2019;5:e191460. - PMC - PubMed
    1. Velasco G, Sánchez C, Guzmán M. Towards the use of cannabinoids as antitumour agents. Nat Rev Cancer. 2012;12:436–444. - PubMed
    1. Clark TM, Jones JM, Hall AG, et al. . Theoretical explanation for reduced body mass index and obesity rates in Cannabis users. Cannabis Cannabinoid Res. 2018;3:259–271. - PMC - PubMed
    1. Bisogno T, Maccarrone M. Endocannabinoid signaling and its regulation by nutrients. BioFactors. 2014;40:373–380. - PubMed