. 2021 May 17:10:e67172.
doi: 10.7554/eLife.67172.

Signaling levels mold the RAS mutation tropism of urethane

Affiliations

Signaling levels mold the RAS mutation tropism of urethane

Siqi Li et al. Elife. .

Abstract

RAS genes are commonly mutated in human cancer. Despite many possible mutations, individual cancer types often have a 'tropism' towards a specific subset of RAS mutations. As driver mutations, these patterns ostensibly originate from normal cells. High oncogenic RAS activity causes oncogenic stress and different oncogenic mutations can impart different levels of activity, suggesting a relationship between oncoprotein activity and RAS mutation tropism. Here, we show that changing rare codons to common in the murine Kras gene to increase protein expression shifts tumors induced by the carcinogen urethane from arising from canonical Q61 to biochemically less active G12Kras driver mutations, despite the carcinogen still being biased towards generating Q61 mutations. Conversely, inactivating the tumor suppressor p53 to blunt oncogenic stress partially reversed this effect, restoring Q61 mutations. One interpretation of these findings is that the RAS mutation tropism of urethane arises from selection in normal cells for specific mutations that impart a narrow window of signaling that promotes proliferation without causing oncogenic stress.

Keywords: RAS; cancer biology; carcinogenesis; codon bias; mouse; oncogenesis; protooncogenes; tumor initiation.


Conflict of interest statement

SL, CC No competing interests declared

Figures

Figure 1.
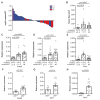
Figure 1.. Loss of p53 converts the Krasex3op allele from suppressing to enhancing urethane carcinogenesis.
(A) Experimental design to evaluate the effect of inactivating p53 specifically in the lung on urethane carcinogenesis upon increase in Kras expression. (B–D) Mean ± SEM of urethane-induced tumor (B) burden, (C) multiplicity, and (D) size in tamoxifen-treated SftpcCreER/CreER;Trp53fl/fl mice in a homozygous native (B, C: n = 30 mice; D: n = 11 tumors) and heterozygous or homozygous (B, C: n = 51 mice; D: n = 42 tumors) ex3op Kras background. Mann–Whitney test. (E) % of tumors ≥ (gray bar) or < (white bar) 100 mm3 in tamoxifen-treated SftpcCreER/CreER;Trp53fl/fl mice in Krasnat/nat (n = 11 tumors), Krasex3op/nat (n = 25 tumors), or Krasex3op/ex3op (n = 17 tumors) backgrounds after urethane exposure. Two-sided Fisher’s exact test.
Figure 1—figure supplement 1.
Figure 1—figure supplement 1.. The effect of Krasex3op allele on urethane-mediated lung tumorigenesis in the absence of p53.
(A) PCR analysis of the status of the Trp53flox allele in DNA isolated from lung tumors in SftpcCreER/CreER;Trp53fl/fl;Krasex3op/nat (T1, T3) or SftpcCreER/CreER;Trp53fl/fl;Krasex3op/exeop (T2) mice treated (+) or not treated (-) with tamoxifen (Tam). NC: no DNA control. (B, C, E) Mean ± SEM of urethane-induced tumor (B) burden, (C) multiplicity, and (E) size in tamoxifen-treated SftpcCreER/CreER;Trp53fl/fl mice in a homozygous native (B, C: n = 30 mice; E: n = 11 tumors), heterozygous (B, C: n = 30 mice; E: n = 25 tumors), and homozygous (B, C: n = 21 mice; E: n = 17 tumors) ex3op Kras backgrounds. Dunn's multiple comparison test following Kruskal–Wallis test. (D) % of mice with (gray bar) or without (white bar) a tumor in tamoxifen-treated SftpcCreER/CreER;Trp53fl/fl mice in Krasnat/nat (n = 30 mice), Krasex3op/nat (n = 30 mice), or Krasex3op/ex3op (n = 21 mice) backgrounds after urethane exposure. Two-sided Fisher’s exact test.
Figure 2.
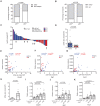
Figure 2.. Loss of p53 reprograms the RAS mutation tropism of urethane.
(A) Experimental design to obtain urethane-induced lung tumors from p53+/+ mice. (B) Mean ± SEM of urethane-induced tumor size in SftpcCreER/CreER;Trp53fl/fl;Krasex3op/nat mice not treated (p53+/+, n = 16 tumors) or treated with tamoxifen (p53-/-, n = 25 tumors). Mann–Whitney test. (C) % of urethane-induced tumors with an oncogenic mutation at codon G12/13 (white bar) versus Q61 (gray bar) in the Krasnat versus Krasex3op allele in SftpcCreER/CreER;Trp53fl/fl;Krasex3op/nat mice not treated (p53+/+) or treated with tamoxifen (p53-/-) where indicated. n = 4 tumors ex3op p53+/+, 5 tumors nat p53-/-, and 10 tumors ex3op p53-/-. Two-sided Fisher’s exact test.
Figure 2—figure supplement 1.
Figure 2—figure supplement 1.. The effect of p53 loss on tumor burden and multiplicity.
(A) Proportion of recombined p53 allele and wildtype allele in tumors from mice not treated with tamoxifen by qPCR. (B, C) Mean ± SEM tumor (B) burden and (C) multiplicity of SftpcCreER/CreER;Trp53fl/fl;Krasex3op/nat mice not treated (p53+/+, n = 17 mice) or treated (p53-/-, n = 30 mice) with tamoxifen. Mann–Whitney test.
Figure 3.
Figure 3.. The mutation signature of urethane is not affected by the Krasex3op allele.
(A) Experimental design to identify mutations induced by urethane in mouse lung in a Krasnat versus Krasex3op background. (B) Heatmap of the log-transformed mutation frequency (MF) of A>T transversions determined by maximum depth sequencing (MDS) sequencing the exons 1 and 2 of Kras from the lungs of mice exposed to urethane (UR) in a Krasnat/nat (nat) (n = 3 mice) versus Krasex3op/ex3op (ex3op) (n = 3 mice) background. Nucleotide number as well as the 5′ and 3′ base of the substituted A are shown at the top; ‘-’ indicates nucleotides upstream of ATG start codon in 5′UTR; ‘111+’ indicates nucleotides in the intron downstream of exon 1. (C) Mean ± SEM mutation frequency of all CA>CT mutations in Kras exon 2, with Q61L mutation highlighted in red, as well as all GG>GA mutations in Kras exon 1, with G12D and G13D mutations highlighted in red, derived from the aforementioned MDS sequencing of Kras exons 1 and 2 from the lungs of Krasnat/nat versus Krasex3op/ex3op mice treated with either urethane or PBS (n = 3 mice each). Holm–Sidak multiple comparisons test following one-way ANOVA.
Figure 3—figure supplement 1.
Figure 3—figure supplement 1.. Mutagenesis profile of SftpcCreER/CreER;Trp53fl/fl;Krasnat/nat and SftpcCreER/CreER;Trp53fl/fl;Krasex3op/ex3op mice.
(A) Heatmap of the log-transformed mutation frequency (MF) determined by maximum depth sequencing (MDS) sequencing the exons 1 and 2 of Kras from the lungs of mice treated (+) or not treated with tamoxifen (-), exposed to urethane (UR) or PBS, in a SftpcCreER/CreER;Trp53fl/fl;Krasnat/nat (nat) or SftpcCreER/CreER;Trp53fl/fl;Krasex3op/ex3op (ex3op) background (n = 3 mice) for each A>T transversions (nucleotide number as well as the 5′ and 3′ base of the substituted A are shown at the top, ‘-’ indicates nucleotides upstream of ATG start codon in 5′UTR, ‘111+’ indicates nucleotides in the intron downstream of exon 1). (B, C) Mean ± SEM mutation frequency of all CA>CT mutations in Kras exon 2, including Q61L mutation highlighted in red, as well as all GG>GA mutations in Kras exon 1, including G12D and G13D mutations highlighted in red, derived from MDS sequencing of Kras exons 1 and 2 from the lungs of SftpcCreER/CreER;Trp53fl/fl;Krasnat/nat versus SftpcCreER/CreER;Trp53fl/fl;Krasex3op/ex3op mice (B) not treated or (C) treated with tamoxifen and exposed to either urethane (UR) or PBS (n = 3 mice). (B) Holm–Sidak multiple comparisons test following one-way ANOVA. (C) Dunn’s multiple comparison test following Kruskal–Wallis test.
Figure 4.
Figure 4.. Loss of p53 promotes higher expression of weaker oncogenic mutations.
(A) Log10-transformed ratio of mutant to wildtype Kras mRNA determined by RT-qPCR in all Kras hotspot-mutant tumors (n = 40) derived from Figures 1 and 2. (B) Mean ± SEM size of tumors with a G12/13 oncogenic Kras mutation with a high (>1.5, n = 12 tumors) versus low (≤1.5, n = 12 tumors) mutant:WT ratio versus tumors with a Q61 oncogenic Kras mutation (n = 16 tumors). Dunn's multiple comparison test following Kruskal–Wallis test. (C–H) Mean ± SEM levels of the indicated mRNAs normalized to β-actin (relative expression) in (C–E) tumors with a G12/13 oncogenic Kras mutation with a high (>1.5, n = 12 tumors) versus low (≤1.5, n = 12 tumors) mutant:WT ratio versus tumors with a Q61 oncogenic Kras mutation (n = 16 tumors) or (F–H) tumors from SftpcCreER/CreER;Trp53fl/fl;Krasex3op/nat mice not treated (p53+/+, n = 5 tumors) or treated with tamoxifen (p53-/-, n = 15 tumors) partitioned by p53 mutation status. (C–E) Dunn's multiple comparison test following Kruskal–Wallis test. (F–H) Mann–Whitney test.
Figure 4—figure supplement 1.
Figure 4—figure supplement 1.. Allelic imbalance and MAPK signaling in Kras hotspot-mutant tumors.
(A) % of tumors with an oncogenic mutation at Kras hotspot (white bar) versus other tumors (gray bar) from SftpcCreER/CreER;Trp53fl/fl;Krasex3op/nat mice not treated (p53+/+, n = 16 tumors) or treated (p53-/-, n = 25 tumors) with tamoxifen. Two-sided Fisher’s exact test. (B) % of tumors with Kras hotspot mutations occurring in the native (white bar) or ex3op (gray bar) allele from SftpcCreER/CreER;Trp53fl/fl;Krasex3op/nat mice not treated (p53+/+, n = 5 tumors) or treated (p53-/-, n = 15 tumors) with tamoxifen. Two-sided Fisher’s exact test. (C) Log10-transformed ratio of mutant to wildtype Kras mRNA determined by RT-qPCR in all Kras hotspot-mutant tumors (n = 40 tumors) derived from Figures 1 and 2. Asterisk indicates tumor 757T1 with a p53 deficiency. (D) Mean ± SEM ratio of mutant to wildtype Kras mRNA in tumors with G12/13 (n = 24 tumors) and Q61 (n = 16 tumors) mutations. (E–G) Correlation between the levels of the indicated mRNAs normalized to β-actin (relative expression) and the ratio of mutant to wildtype Kras mRNA. Rho and p values are from Spearman correlation analysis. Mann–Whitney test. (H) Mean ± SEM ratio of G12/13 mutant Krasex3op to wildtype Krasnat mRNA in tumors from SftpcCreER/CreER;Trp53fl/fl;Krasex3op/nat mice not treated (p53+/+, n = 4 tumors) or treated with tamoxifen (p53-/-, n = 7 tumors). Mann–Whitney test. (I–K) Mean ± SEM levels of the indicated mRNAs normalized to β-actin (relative expression) for tumors that are <1 (n = 9 tumors), 1–50 (n = 12 tumors), 50–100 (n = 9 tumors), and >100 (n = 10 tumors) mm3. Dunn's multiple comparison test following Kruskal–Wallis test.
Figure 4—figure supplement 2.
Figure 4—figure supplement 2.. The imbalance at mRNA level could not be fully attributed to the imbalance of DNA copy number.
(A) Top: copy number of the mutant or wildtype allele in tumors from SftpcCreER/CreER;Trp53fl/fl;Krasex3op/nat mice estimated by qPCR copy number assay (Tert as reference gene). Mutant type and the allele with mutation are indicated. Bottom: the ratio of mutant to wildtype Kras mRNA and ID of the tumors listed in the top graph. Data shown are mean ± SEM of two technical replicates. (B) Correlation between the mRNA ratio and genomic DNA (gDNA) ratio of mutant to wildtype Kras allele. Rho and p values are from Spearman correlation analysis.
Figure 5.
Figure 5.. Optimal signaling is required for effective tumor initiation.
Signaling from a G12D mutation in the native (nat) Kras allele and from a Q61R mutation in the codon-optimized (ex3op) Kras allele is outside of the window of optimal signaling level achieved by Krasnat(G12D) and Krasex3op(Q61R). Loss of p53 alleviates the selection against oncogenic stress and allows the recovery of a Q61R mutation in Krasex3op allele or a G12D mutation in the Krasnat allele with elevated mutant:wildtype (mut:wt) mRNA allelic ratio.

Comment in

  • Danger zone.
    Butt Z, Prior I. Butt Z, et al. Elife. 2021 May 17;10:e69192. doi: 10.7554/eLife.69192. Elife. 2021. PMID: 33998996 Free PMC article.

References

    1. Ali M, Kaltenbrun E, Anderson GR, Stephens SJ, Arena S, Bardelli A, Counter CM, Wood KC. Codon bias imposes a targetable limitation on KRAS-driven therapeutic resistance. Nature Communications. 2017;8:15617. doi: 10.1038/ncomms15617. - DOI - PMC - PubMed
    1. Balmain A. The critical roles of somatic mutations and environmental tumor-promoting agents in Cancer risk. Nature Genetics. 2020;52:1139–1143. doi: 10.1038/s41588-020-00727-5. - DOI - PMC - PubMed
    1. Bowling S, Sritharan D, Osorio FG, Nguyen M, Cheung P, Rodriguez-Fraticelli A, Patel S, Yuan WC, Fujiwara Y, Li BE, Orkin SH, Hormoz S, Camargo FD. An engineered CRISPR-Cas9 mouse line for simultaneous readout of lineage histories and gene expression profiles in single cells. Cell. 2020;181:1410–1422. doi: 10.1016/j.cell.2020.04.048. - DOI - PMC - PubMed
    1. Buffet C, Hecale-Perlemoine K, Bricaire L, Dumont F, Baudry C, Tissier F, Bertherat J, Cochand-Priollet B, Raffin-Sanson ML, Cormier F, Groussin L. DUSP5 and DUSP6, two ERK specific phosphatases, are markers of a higher MAPK signaling activation in BRAF mutated thyroid cancers. PLOS ONE. 2017;12:e0184861. doi: 10.1371/journal.pone.0184861. - DOI - PMC - PubMed
    1. Buhrman G, Holzapfel G, Fetics S, Mattos C. Allosteric modulation of ras positions Q61 for a direct role in catalysis. PNAS. 2010;107:4931–4936. doi: 10.1073/pnas.0912226107. - DOI - PMC - PubMed

Publication types