

Artificial Intelligence Approaches to Assessing Primary Cilia
- PMID: 33999029
- PMCID: PMC8791558
- DOI: 10.3791/62521
Artificial Intelligence Approaches to Assessing Primary Cilia
Abstract
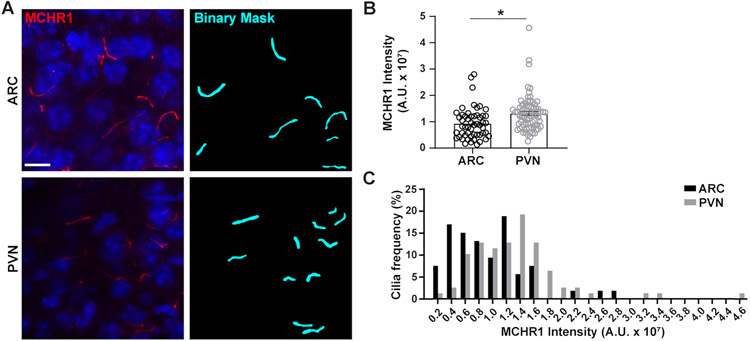
Cilia are microtubule based cellular appendages that function as signaling centers for a diversity of signaling pathways in many mammalian cell types. Cilia length is highly conserved, tightly regulated, and varies between different cell types and tissues and has been implicated in directly impacting their signaling capacity. For example, cilia have been shown to alter their lengths in response to activation of ciliary G protein-coupled receptors. However, accurately and reproducibly measuring the lengths of numerous cilia is a time-consuming and labor-intensive procedure. Current approaches are also error and bias prone. Artificial intelligence (Ai) programs can be utilized to overcome many of these challenges due to capabilities that permit assimilation, manipulation, and optimization of extensive data sets. Here, we demonstrate that an Ai module can be trained to recognize cilia in images from both in vivo and in vitro samples. After using the trained Ai to identify cilia, we are able to design and rapidly utilize applications that analyze hundreds of cilia in a single sample for length, fluorescence intensity and co-localization. This unbiased approach increased our confidence and rigor when comparing samples from different primary neuronal preps in vitro as well as across different brain regions within an animal and between animals. Moreover, this technique can be used to reliably analyze cilia dynamics from any cell type and tissue in a high-throughput manner across multiple samples and treatment groups. Ultimately, Ai-based approaches will likely become standard as most fields move toward less biased and more reproducible approaches for image acquisition and analysis.
Figures


Similar articles
-
Physiological Condition-Dependent Changes in Ciliary GPCR Localization in the Brain.eNeuro. 2023 Mar 13;10(3):ENEURO.0360-22.2023. doi: 10.1523/ENEURO.0360-22.2023. Print 2023 Mar. eNeuro. 2023. PMID: 36849261 Free PMC article.
-
Analysis of ciliary status via G-protein-coupled receptors localized on primary cilia.Microscopy (Oxf). 2020 Oct 30;69(5):277-285. doi: 10.1093/jmicro/dfaa035. Microscopy (Oxf). 2020. PMID: 32627821 Review.
-
Diverse cell type-specific mechanisms localize G protein-coupled receptors to Caenorhabditis elegans sensory cilia.Genetics. 2014 Jun;197(2):667-84. doi: 10.1534/genetics.114.161349. Epub 2014 Mar 18. Genetics. 2014. PMID: 24646679 Free PMC article.
-
Measuring the primary cilium length: improved method for unbiased high-throughput analysis.Cilia. 2016 Feb 11;5:7. doi: 10.1186/s13630-016-0028-2. eCollection 2016. Cilia. 2016. PMID: 26870322 Free PMC article.
-
G-Protein-Coupled Receptor Signaling in Cilia.Cold Spring Harb Perspect Biol. 2017 Sep 1;9(9):a028183. doi: 10.1101/cshperspect.a028183. Cold Spring Harb Perspect Biol. 2017. PMID: 28159877 Free PMC article. Review.
Cited by
-
Physiological Condition-Dependent Changes in Ciliary GPCR Localization in the Brain.eNeuro. 2023 Mar 13;10(3):ENEURO.0360-22.2023. doi: 10.1523/ENEURO.0360-22.2023. Print 2023 Mar. eNeuro. 2023. PMID: 36849261 Free PMC article.
-
A protocol for generation and live-cell imaging analysis of primary cilia reporter cell lines.STAR Protoc. 2022 Mar 2;3(1):101199. doi: 10.1016/j.xpro.2022.101199. eCollection 2022 Mar 18. STAR Protoc. 2022. PMID: 35257113 Free PMC article.
-
Primary cilia and BBS4 are required for postnatal pituitary development.bioRxiv [Preprint]. 2025 Jul 18:2025.07.15.664994. doi: 10.1101/2025.07.15.664994. bioRxiv. 2025. PMID: 40791458 Free PMC article. Preprint.
-
Postnatal Dynamic Ciliary ARL13B and ADCY3 Localization in the Mouse Brain.Cells. 2024 Jan 30;13(3):259. doi: 10.3390/cells13030259. Cells. 2024. PMID: 38334651 Free PMC article.
-
Fluorescence imaging of beta cell primary cilia.Front Endocrinol (Lausanne). 2022 Sep 23;13:1004136. doi: 10.3389/fendo.2022.1004136. eCollection 2022. Front Endocrinol (Lausanne). 2022. PMID: 36213262 Free PMC article.
References
Publication types
MeSH terms
Substances
Grants and funding
LinkOut - more resources
Full Text Sources
