

Using Flow Cytometry to Detect and Quantitate Altered Blood Formation in the Developing Zebrafish
- PMID: 33999034
- PMCID: PMC8500172
- DOI: 10.3791/61035
Using Flow Cytometry to Detect and Quantitate Altered Blood Formation in the Developing Zebrafish
Abstract
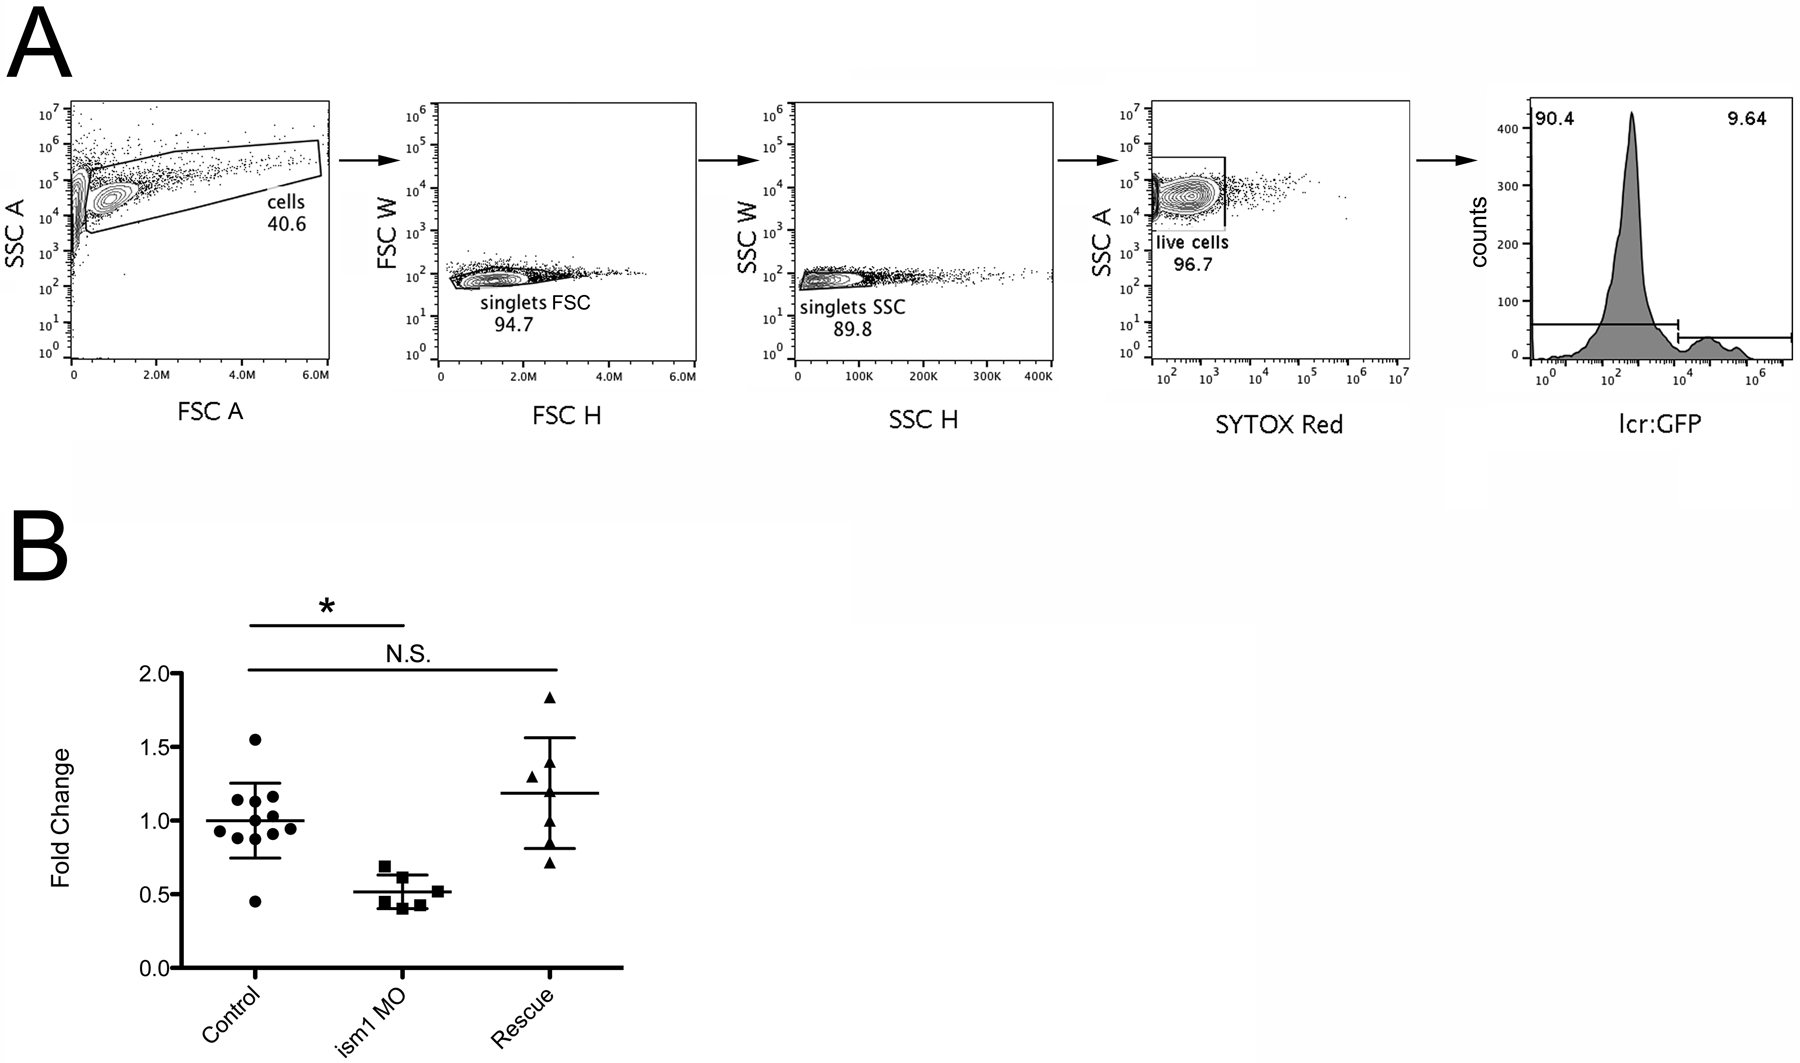
The diversity of cell lineages that comprise mature blood in vertebrate animals arise from the differentiation of hematopoietic stem and progenitor cells (HSPCs). This is a critical process that occurs throughout the lifespan of organisms, and disruption of the molecular pathways involved during embryogenesis can have catastrophic long-term consequences. For a multitude of reasons, zebrafish (Danio rerio) has become a model organism to study hematopoiesis. Zebrafish embryos develop externally, and by 7 days postfertilization (dpf) have produced most of the subtypes of definitive blood cells that will persist for their lifetime. Assays to assess the number of hematopoietic cells have been developed, mainly utilizing specific histological stains, in situ hybridization techniques, and microscopy of transgenic animals that utilize blood cell-specific promoters driving the expression of fluorescent proteins. However, most staining assays and in situ hybridization techniques do not accurately quantitate the number of blood cells present; only large differences in cell numbers are easily visualized. Utilizing transgenic animals and analyzing individuals with fluorescent or confocal microscopy can be performed, but the quantitation of these assays relies on either counting manually or utilizing expensive imaging software, both of which can make errors. Development of additional methods to assess blood cell numbers would be economical, faster, and could even be automated to quickly assess the effect of CRISPR-mediated genetic modification, morpholino-mediated transcript reduction, and the effect of drug compounds that affect hematopoiesis on a large scale. This novel assay to quantitate blood cells is performed by dissociating whole zebrafish embryos and analyzing the amount of fluorescently labelled blood cells present. These assays should allow elucidation of molecular pathways responsible for blood cell generation, expansion, and regulation during embryogenesis, which will allow researchers to further discover novel factors altered during blood diseases, as well as pathways essential during the evolution of vertebrate hematopoiesis.
Conflict of interest statement
DISCLOSURES:
D.L.S. is a scientific consultant and has received compensation from Finless Foods, Inc. and Xytogen Biotech, Inc. K.F.R. declares no competing interests.
Figures
References
-
- Driever W et al. A genetic screen for mutations affecting embryogenesis in zebrafish. Development 123, 37–46 (1996). - PubMed
-
- Weinstein BM et al. Hematopoietic mutations in the zebrafish. Development 123, 303–309 (1996). - PubMed
-
- Ransom DG et al. Characterization of zebrafish mutants with defects in embryonic hematopoiesis. Development 123, 311–319 (1996). - PubMed
Publication types
MeSH terms
Substances
Grants and funding
LinkOut - more resources
Full Text Sources
Other Literature Sources
