. 2021 Jul 5;220(7):e202008060.
doi: 10.1083/jcb.202008060. Epub 2021 May 17.

Rab40-Cullin5 complex regulates EPLIN and actin cytoskeleton dynamics during cell migration

Affiliations

Rab40-Cullin5 complex regulates EPLIN and actin cytoskeleton dynamics during cell migration

Erik S Linklater et al. J Cell Biol. .

Abstract

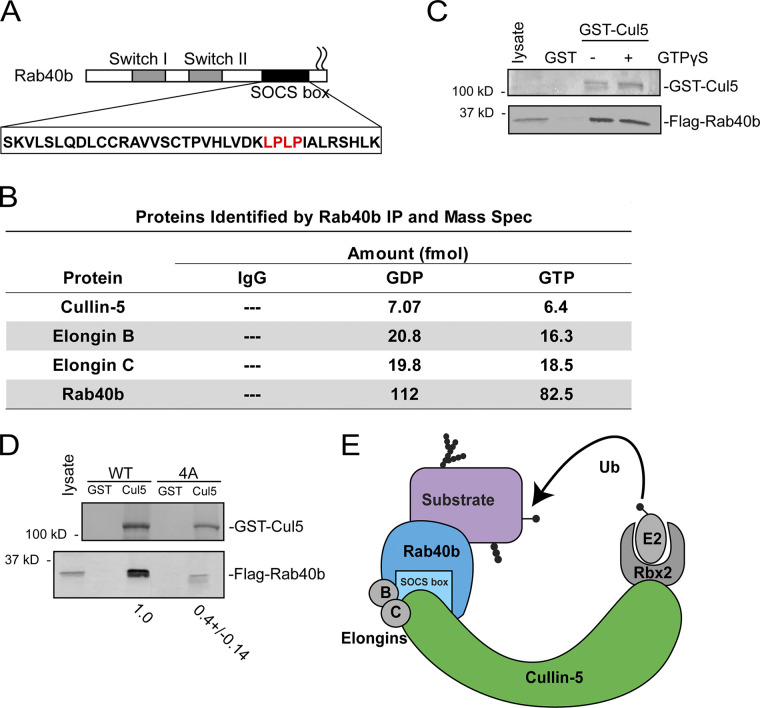
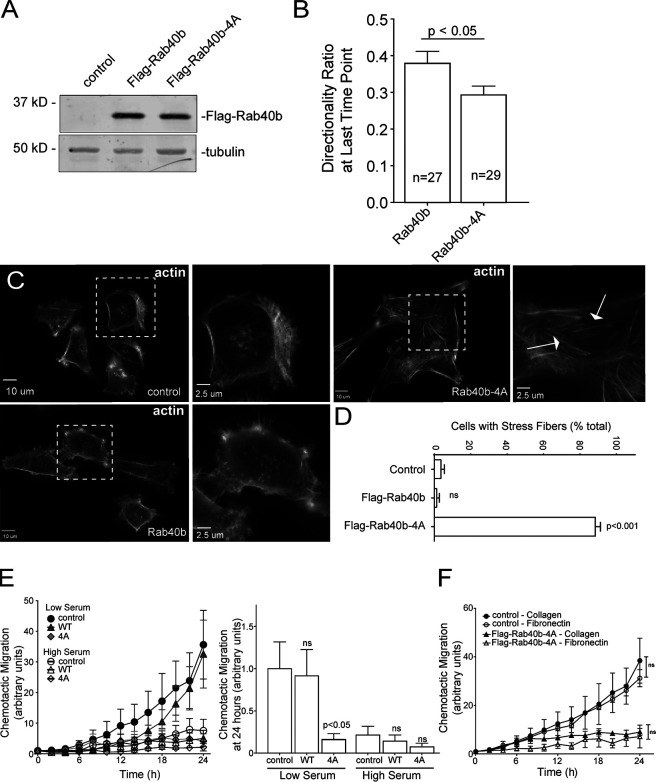
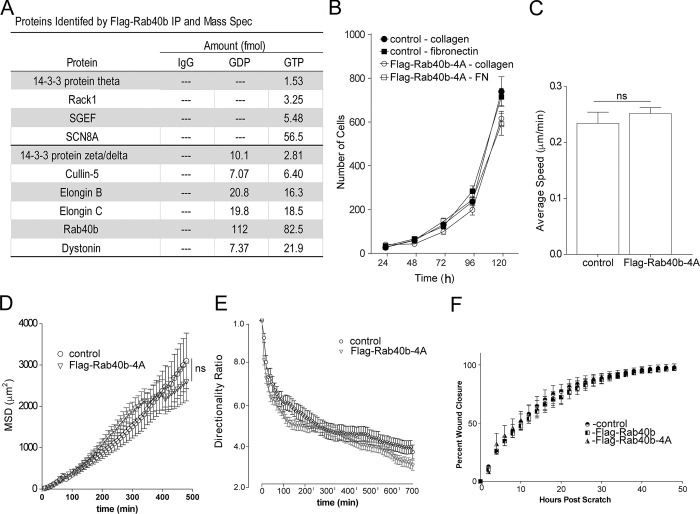
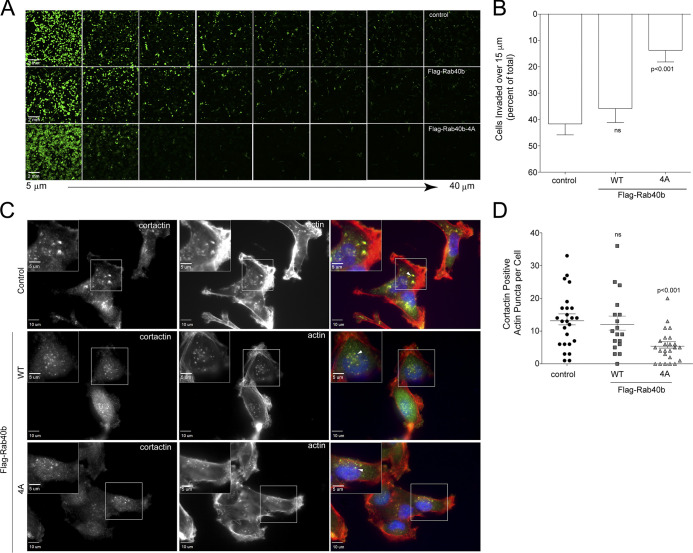
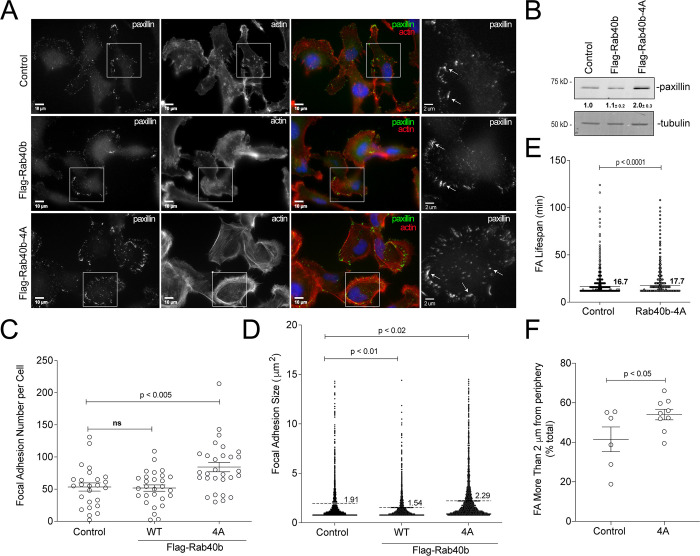
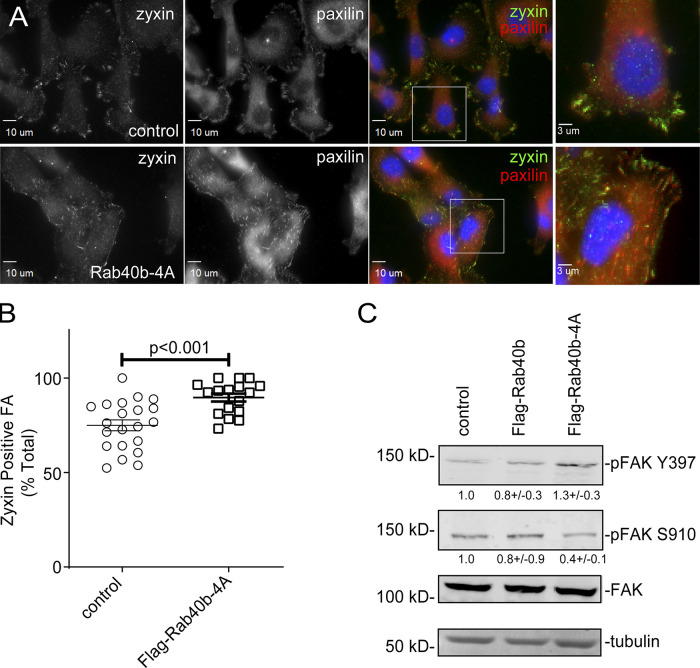
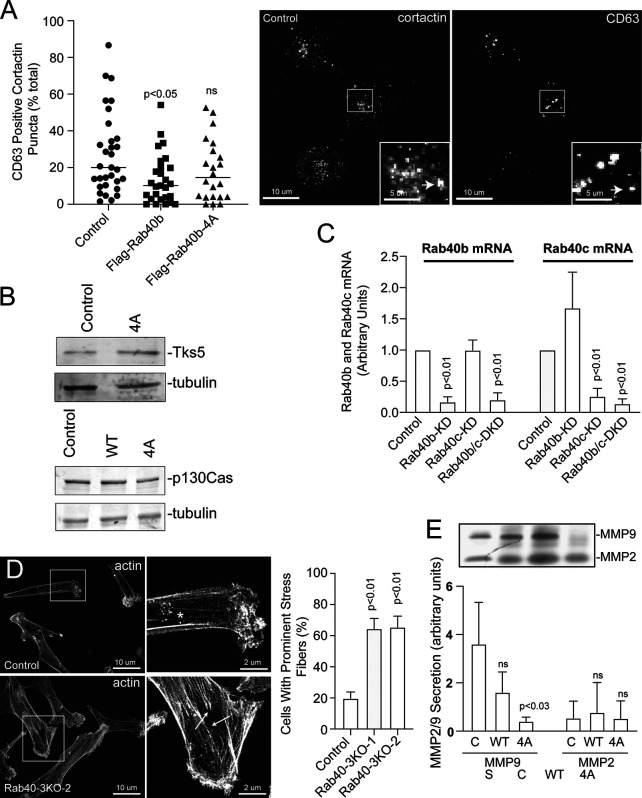
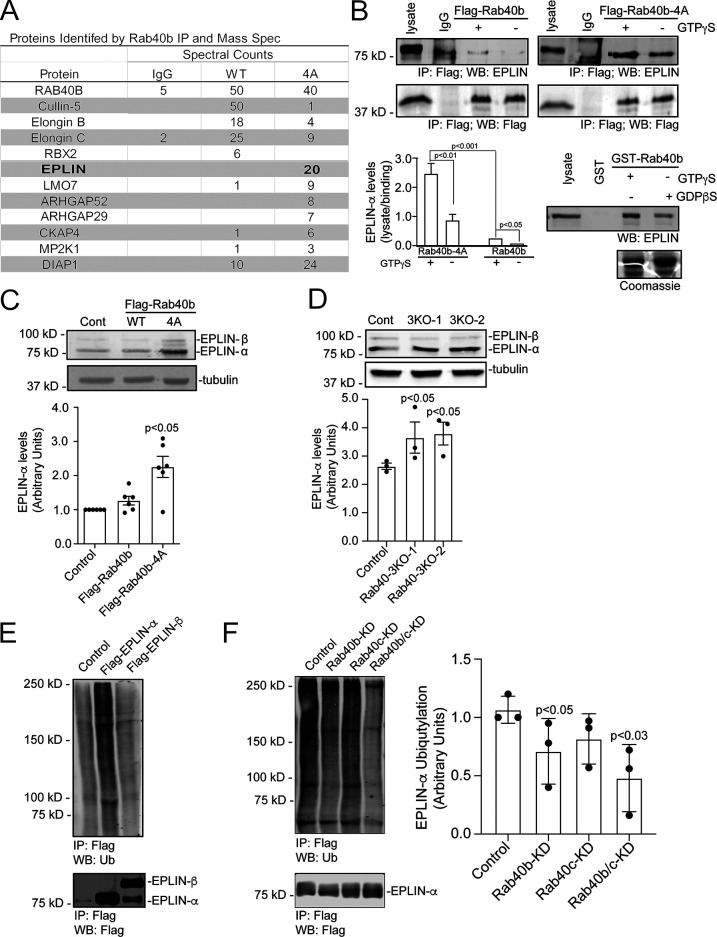
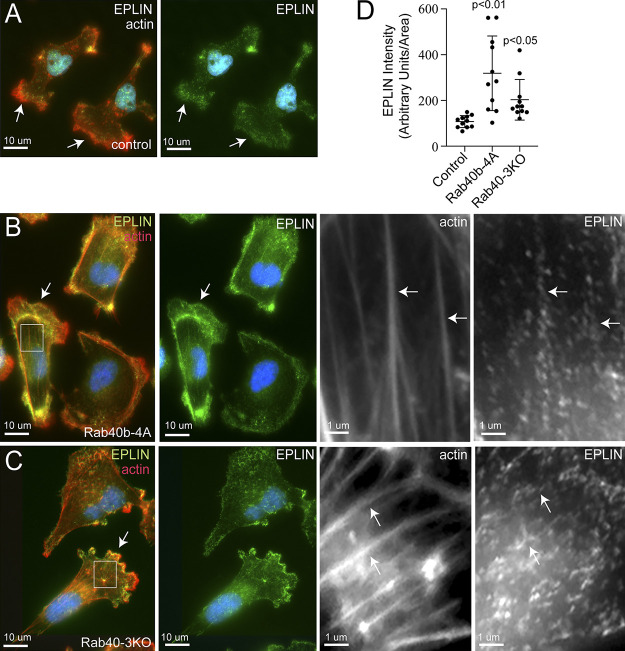
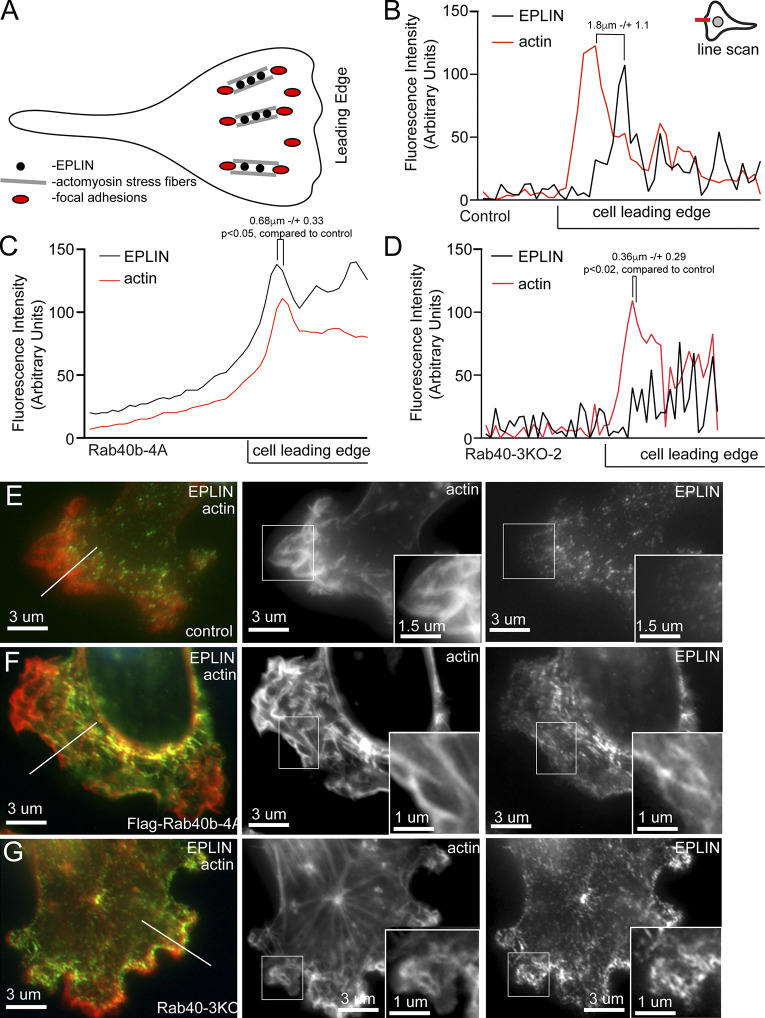
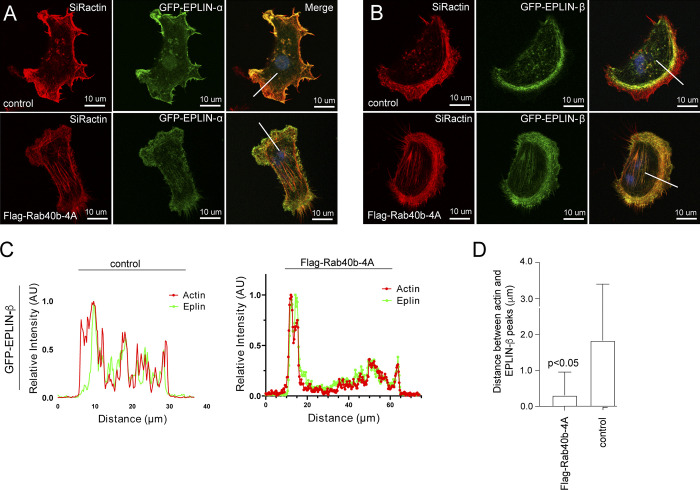
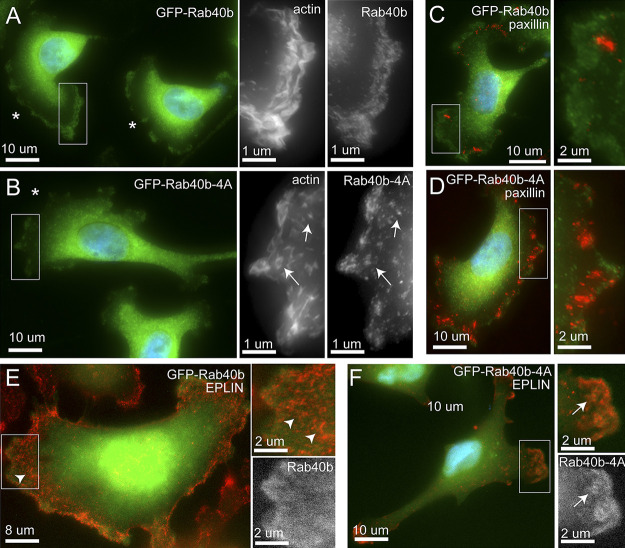
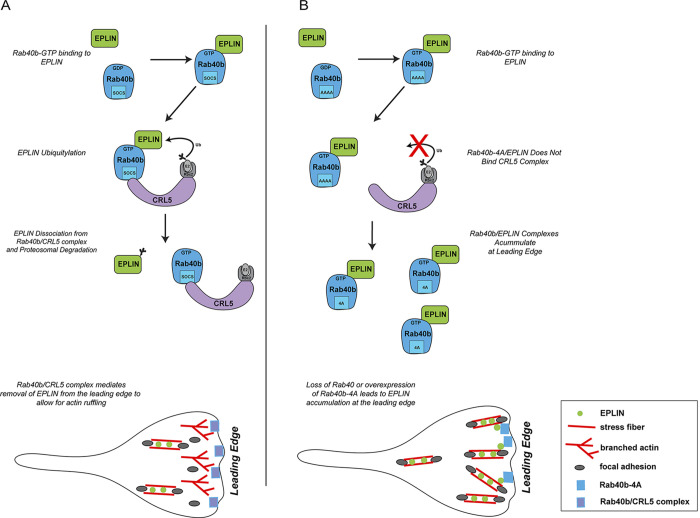
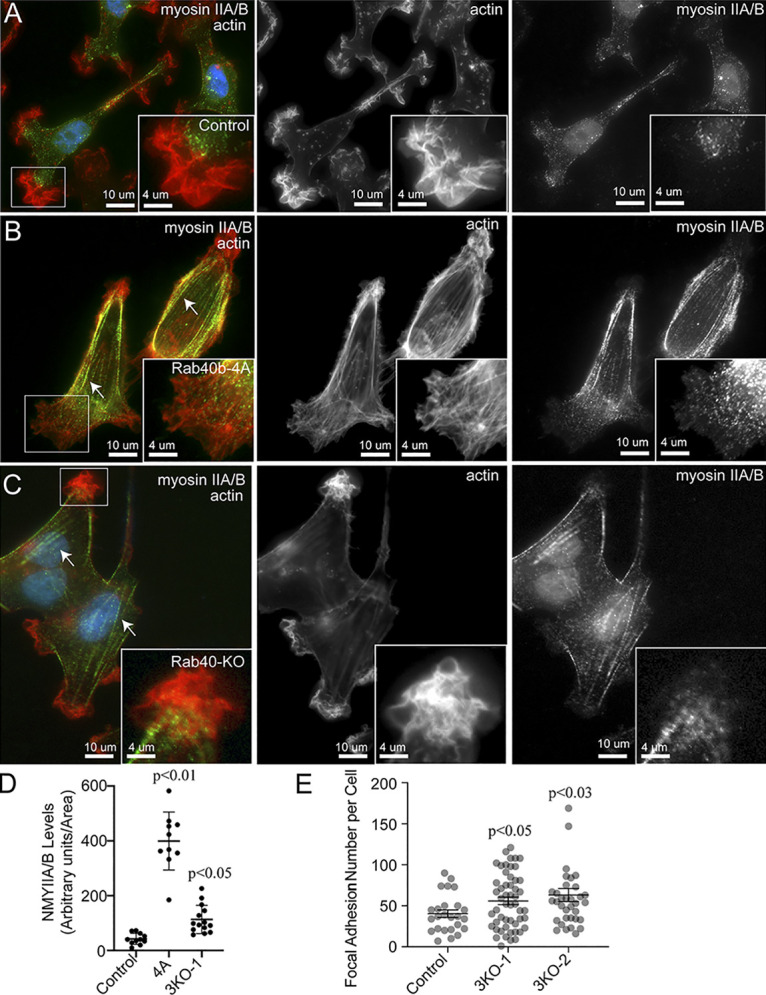
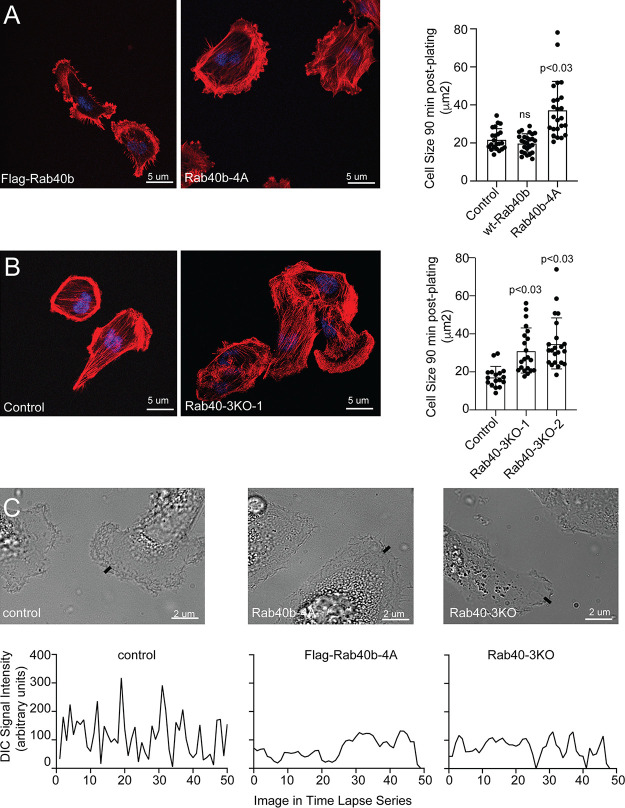
Rab40b is a SOCS box-containing protein that regulates the secretion of MMPs to facilitate extracellular matrix remodeling during cell migration. Here, we show that Rab40b interacts with Cullin5 via the Rab40b SOCS domain. We demonstrate that loss of Rab40b-Cullin5 binding decreases cell motility and invasive potential and show that defective cell migration and invasion stem from alteration to the actin cytoskeleton, leading to decreased invadopodia formation, decreased actin dynamics at the leading edge, and an increase in stress fibers. We also show that these stress fibers anchor at less dynamic, more stable focal adhesions. Mechanistically, changes in the cytoskeleton and focal adhesion dynamics are mediated in part by EPLIN, which we demonstrate to be a binding partner of Rab40b and a target for Rab40b-Cullin5-dependent localized ubiquitylation and degradation. Thus, we propose a model where Rab40b-Cullin5-dependent ubiquitylation regulates EPLIN localization to promote cell migration and invasion by altering focal adhesion and cytoskeletal dynamics.


Figures

Figure 1.
Figure 1.
Rab40b binds to Cullin5 in SOCS-dependent and GTP-independent manner. (A) Schematic diagram of Rab40b. (B) List of proteins identified in both GDP- and GTPγS-bound FLAG-Rab40b immunoprecipitates from MDA-MB-231 lysate followed by mass spectroscopy analysis. (C) FLAG-Rab40b binding to GST-Cullin5 as analyzed by glutathione bead pull-down assay. Top panel: Coomassie staining. Bottom panel: WB with anti-FLAG. (D) FLAG-Rab40b (WT and 4A mutants) binding to GST-Cullin5 as analyzed by glutathione bead pull-down assay followed by WB with anti-FLAG (bottom blot) and Coomassie stain (top blot). Numbers shown are the average densitometry analysis derived from three independent experiments, standardized to WT FLAG-Rab40b. WT::4A, P < 0.001. (E) Model showing CRL5 E3 ligase complex partners. Ub, ubiquitin.
Figure 2.
Figure 2.
Rab40bCullin5 affects individual cell migration. (A) WB analysis of lysates from MDA-MB-231 cells stably expressing WT FLAG-Rab40b or FLAG-Rab40b-4A. (B) Directionality of migrating cells derived from time-lapse analysis of control or FLAG-Rab40b-4A cells (see Videos 1 and 2) for cells that remained in frame for the duration of the experiment. Data are shown as means and SEM. n is the number of cells analyzed. (C and D) Control, FLAG-Rab40b, and FLAG-Rab40b-4A cells were plated on collagen-coated coverslips and then fixed and stained with phalloidin–Alexa Fluor 594. Zoomed regions of interest highlight differences in cytoskeletal architecture, and arrows point to stress fibers. (D) Quantification of cells with prominent stress fibers. n ≥ 100 cells per condition. (E) Chemotactic assays of control, FLAG-Rab40b, or FLAG-Rab40b-4A cells on collagen coating, plated in either low- or high-serum conditions. Results are of three separate runs, with at least three wells per condition per run. Left panel: Grouped scatter plot of relative migration over the entire time course. Right panel: Bar graph showing relative migration at 24 h. (F) Chemotactic assays of control or FLAG-Rab40b-4A cells plated on either collagen or fibronectin. Results are of three separate runs, with at least three wells per condition per run.
Figure S1.
Figure S1.
Cell migration analysis. (A) Table listing other proteins (in addition to Fig. 1) identified by mass spectroscopy analysis from FLAG-Rab40b pull-down. (B) Rates of cell proliferation of control and FLAG-Rab40b-4A cells on either collagen or fibronectin (FN). Data represent the means and SEM derived from three different experiments. (C) Average speed calculated from time-lapse analysis of parental (control) and FLAG-Rab40b-4A cells (also see Videos 1 and 2). Control, 0.24 µm/min ± 0.0 SEM, n = 51 cells; FLAG-Rab40b-4A, 0.25 µm/min ± 0.01 SEM, n = 121. (D) MSD calculated from time-lapse analysis of parental (control) and FLAG-Rab40b-4A cells (also see Videos 1 and 2). Data represent means and SEM derived from n = 39 control cells and n = 79 FLAG-Rab40b-4A cells. P = 0.75. For power-law equation fitting to MSD(Δt) = C*Δtα, where the exponent α is indicative of type of movement: control, MSD(Δt) = 0.8337Δt1.3212, α = 1.3212; FLAG-Rab40b-4A, MSD(Δt) = 0.6652Δt1.3743, α = 1.3743. (E) Directionality ratios control and FLAG-Rab40b-4A cells were calculated from time-lapse analysis (also see Videos 1 and 2). Only cells that remained in frame for the duration of the entire time-lapse experiment were analyzed. Directionality at the last time point is 0.38 ± 0.03 SEM for control cells and 0.29 ± 0.02 SEM for FLAG-Rab40b-4A cells. P < 0.05. (F) Migration analysis of control, FLAG-Rab40b, and FLAG-Rab40b-4A cells by scratch assay. Right: Representative images of cells at various time points. Blue boxes designate computer generated boundaries of original scratch border. Left: Quantification of three separate runs, with at least five wells per condition per run.
Figure 3.
Figure 3.
Rab40bCullin5 regulates chemotactic migration and cell invasion. (A and B) Matrigel invasion assay of control, FLAG-Rab40b, and FLAG-Rab40b-4A cells. Representative field-of-view images of Calcein-stained cells at 5-µm increments throughout the plug. (B) Quantification of cell migration through Matrigel plug. Results are of three separate runs, with at least three fields-of-view per condition per run. (C and D) Control, FLAG-Rab40b, or FLAG-Rab40b-4A cells plated on collagen-coated coverslips and then fixed and stained with phalloidin–Alexa Fluor 594 (red), cortactin (green), and DAPI (blue). Inset regions of interest highlight phalloidin/cortactin dual-positive puncta. Arrows point to actin/cortactin puncta. (D) Quantification of dual-positive actin/cortactin puncta. n ≥ 18 cells per condition.
Figure 4.
Figure 4.
Rab40bCullin5 regulates localization and dynamics of FA sites. (A) Representative images of control, FLAG-Rab40b, and FLAG-Rab40b-4A MDA-MB-231 cells fixed and stained with phalloidin–Alexa Fluor 594 (red), anti-paxillin (green, FA marker), and DAPI (blue). Insets highlight anti-paxillin–stained regions of interest. (B) WB analysis of cell lysates using anti-paxillin (top blot) and anti-tubulin (bottom blot) antibodies. Numbers shown are densitometry analysis from at least three separate experiments relative to tubulin and standardized to control levels. Control::FLAG-Rab40b-4A, P < 0.05. (C) Quantification of number of FAs per cell for control, FLAG-Rab40b, and FLAG-Rab40b-4A cells. n ≥ 20 cells per condition. (D) Quantification of FA size in control, FLAG-Rab40b, and FLAG-Rab40b-4A cells. n = 2,479 total adhesions analyzed. (E) Quantification of FA average life span in control and FLAG-Rab40b-4A cells. Average life span of FAs was calculated from time-lapse images, with three cells per condition. (F) Quantification of percentage of FAs within 2 µm of cell border in control and FLAG-Rab40b-4A cells.
Figure S2.
Figure S2.
FA maturation analysis. (A) Images of control and FLAG-Rab40b-4A cells stained with zyxin (green) and paxillin (red). Boxes mark regions that are shown as higher-resolution images. (B) Quantification of percentage of zyxin-positive FAs in control and FLAG-Rab40b-4A cells. n ≥ 15 cells per cell line were analyzed. Control, 76.2 ± 2.9 SEM; FLAG-Rab40b-4A, 89.7 ± 2.1 SEM. (C) WB images of cell lysates blotted with anti-FAK, anti-Y397 pFAK, or anti-S910 pFAK antibodies. Numbers shown are the average densitometry analysis derived from three independent experiments relative to tubulin and standardized to control levels. Control::FLAG-Rab40b, S910 P = 0.05; Control::FLAG-Rab40b-4A, S910 P < 0.005, Y397 P < 0.05.
Figure S3.
Figure S3.
Stress fiber formation and MMP secretion analysis in Rab40b-4A and Rab40-3KO cells. (A) Control, FLAG-Rab40b, and FLAG-Rab40-4A cell lines were plated on collagen-coated coverslips and fixed and stained with anti-cortactin (image on left) and anti-CD63 antibodies (image on right). Boxes mark the region that is displayed as higher-resolution image. Arrows point to organelles positive for both cortactin and CD63. Quantification on the left are the means and SEM. (B) WB images of Tks5 and p130Cas from control and FLAG-Rab40b-4A cells. Numbers represent densitometry analysis from one biological replicate relative to tubulin and standardized to control levels. (C) The knockdown efficiency for Rab40b siRNA and Rab40c siRNA as determined by RT-qPCR. (D) Control, Rab40-3KO-1, and Rab40-3KO-2 cell lines were plated on collagen-coated coverslips and then fixed and stained using phalloidin–Alexa Fluor 594. Boxes mark the region that is displayed as higher-resolution image. Arrows point to stress fibers. Quantification on the right shows the means and SEM derived from three independent analyses. A total of 150 cells were analyzed for each condition. (E) Gelatin zymography analysis of MMP2 and MMP9 secretion from control, FLAG-Rab40b, and FLAG-Rab40b-4A cells grown in serum-free media for 24 h. FBS (serum) contains MMP2/9 and was used as a positive control. The data shown are the means and SEM derived from three independent experiments. The data were normalized against serum (S) levels of MMP2 and MMP9. DKD, double knockdown.
Figure 5.
Figure 5.
Rab40bCullin5 regulates EPLIN stability and localization. (A) Abbreviated list of proteins identified by IP of FLAG-Rab40b and FLAG-Rab40b-4A cells, followed by mass spectroscopy analysis. (B) Rab40b and EPLIN interaction analysis. Top panels: Cell lysates of FLAG-Rab40b and FLAG-Rab40b-4A cells in the presence or absence of GTPγS were incubated with either IgG or an anti-FLAG antibody and immunoprecipitated with Protein G beads. Immunoprecipitates were analyzed by WB with anti-FLAG and anti-EPLIN antibodies. Bottom left: Quantification of EPLIN and FLAG-Rab40b binding. Data are the means and SEM derived from three independent experiments. In all cases, signal was normalized to the EPLIN signal in lysate. Bottom right: MDA-MB-231 control cell lysates were incubated with glutathione beads coated with either GST or GST-Rab40b, in the presence of GDPβS or GTPγS. Bound EPLIN was eluted and analyzed by WB. (C) WBs of endogenous EPLIN in control, FLAG-Rab40b, and FLAG-Rab40b-4A cells. Quantification below are the means and SEM derived from three different experiments and normalized against tubulin levels. (D) WBs of endogenous EPLIN in control and Rab40-3KO cells. Two different 3KO lines were used in these experiments. Quantification below are the means and SEM derived from three different experiments and normalized against tubulin levels. (E) WB images of 293t cells transfected with empty vector control (CNT), FLAG-EPLIN-α, or FLAG-EPLIN-β for 24 h; treated with 10 µm MG132 overnight; harvested and immunoprecipitated for FLAG; and then blotted for either ubiquitin (top) or FLAG (bottom). (F) WB images of 293t cells treated with siRNAs for nontargeting control (siCNT), Rab40b, Rab40c, or both Rab40b and Rab40c; transfected with FLAG-EPLIN-α; treated with MG132 overnight; harvested and immunoprecipitated for FLAG; and then blotted for either ubiquitin (top) or FLAG (bottom). Quantification on the right shows the means and SEM derived from three different experiments. KD, knockdown.
Figure 6.
Figure 6.
Rab40a/b/c depletion or Rab40b-4A overexpression leads to increase in plasma membrane– and stress fiber–associated EPLIN. (A–C) IF images of control (A), FLAG-Rab40b-4A (B), and Rab40-3KO (C) cells plated on collagen-coated coverslips and then fixed and stained with anti-EPLIN antibodies (green) and phalloidin–Alexa Fluor 594 (red). Boxes mark regions of interest. Arrows in whole-field images indicate the lamellipodia leading edge. Arrows in boxed regions indicate stress fibers. (D) Quantification of EPLIN fluorescence in control, FLAG-Rab40b-4A, and Rab40-3KO cells. The data shown are the means and SEM derived from three different experiments. Dots represent individual cells analyzed.
Figure 7.
Figure 7.
Rab40b inhibits EPLIN accumulation at the lamellipodia leading edge. (A) Schematic representation of FA and stress fiber distribution in lamellipodia. (B–G) Representative line scans from control (E), FLAG-Rab40b-4A (F), and Rab40-3KO (G) cells plated on collagen-coated coverslips and then fixed and stained with phalloidin–Alexa Fluor 594 (red) and anti-EPLIN (green) antibodies. Boxes mark the region of interest shown in inset. Line marks the region analyzed by line scan (quantifications shown in B–D). EPLIN distance from actin front: control, 1.8 µm ± 1.1; FLAG-Rab40b-4A, 0.68 µm ± 0.33 (P < 0.05); and Rab40-3KO, 0.36 µm ± 0.29 (P < 0.02). n = 5 cells for each cell line.
Figure 8.
Figure 8.
Rab40b regulates subcellular localization of EPLIN-β. (A) Control or FLAG-Rab40b-4A–expressing cells were transfected with either GFP-EPLIN-α (green) or GFP-EPLIN-β (green). Cells were then fixed and stained with phalloidin–Alexa Fluor 594 (red). Line indicates the area analyzed by line scan and shown in B. (B and C) EPLIN and actin distribution in lamellipodia was analyzed by line scan. The location of line-scan analysis is shown in A. Panel C shows the analysis of the distance between actin front at the leading edge and EPLIN front. The data shown are the means and SEM derived from five different cells. (D) Representative images of immunohistological stains of EPLIN from tumors grown from each cell line. AU, arbitrary units.
Figure 9.
Figure 9.
GFP-Rab40b colocalizes at the actin ruffles at the leading edge of lamellipodia. (A–F) Representative images of GFP-Rab40b (A, C, and E) or GFP-Rab40b-4A (B, D, and F) expressing MDA-MB-231 cells plated on collagen-coated coverslips and then fixed and stained with phalloidin–Alexa Fluor 594 (see insets in A and B), anti-paxillin (C and D), or anti-EPLIN antibodies (E and F). Boxes mark the region of interest shown in the inset. Asterisks mark the leading edge of lamellipodia. Arrowheads mark EPLIN staining that does not colocalize with GFP-Rab40b. Arrows point to structures positive for both EPLIN and GFP-Rab40b-4A.
Figure 10.
Figure 10.
Proposed model for Rab40b function during cell migration. (A) GTP-bound Rab40b binds to EPLIN. Rab40b/EPLIN is then recognized by the CRL5 complex via the Rab40b SOCS box. Binding of EPLIN with the Rab40b–CRL5 complex leads to EPLIN ubiquitylation, disassociation of EPLIN of Rab40b and EPLIN complex, and eventual degradation by the proteasome. Rab40b is enriched at the leading edge of lamellipodia, which leads to the exclusion of EPLIN from lamellipodia, thus allowing actin ruffling. (B) Rab40b-4A mutation blocks Rab40b association with the CRL5 complex, leading to inhibition of EPLIN ubiquitylation and stabilization of the Rab40b-4A–EPLIN complex. Consequently, EPLIN accumulates at the leading edge of the lamellipodia, thus resulting in inhibition of actin ruffling and an increase in actoMyosin stress fibers.
Figure S4.
Figure S4.
The effect of Rab40 in regulating non-muscle Myosin IIA/B. (A–D)Control, Rab40b-4A, and Rab40-3KO cell lines were plated on collagen-coated coverslips, fixed and stained using phalloidin–Alexa Fluor 594 and anti-nonmuscle Myosin IIA/B antibodies. Boxes mark the region that is displayed as higher-resolution image. Arrows point to stress fibers. Quantification in D shows the means and SEM derived from three independent analyses. Dots represent individual cells analyzed. (E) Quantification of number of FAs per cell for control, Rab40b-3KO-1, and Rab40b-3KO-2 cells. n ≥ 20 cells per condition. NMY, nonmuscle Myosin.
Figure S5.
Figure S5.
The role of Rab40 in regulating cell–ECM adherance and lamellipdia dynamics. (A and B)Control, FLAG-Rab40b, Rab40b-4A, and Rab40-3KO cell lines were seeded on collagen-coated coverslips and incubated for 90 min. Cells were then fixed and stained using phalloidin–Alexa Fluor 594. Quantification on the right shows the means and SEM derived from three independent analyses. Dots represent individual cells analyzed. (C) Control, FLAG-Rab40b-4A, and Rab40-3KO cell lines were seeded on collagen-coated coverslips. Invadopodia dynamics was then imaged by time-lapse microscopy/DIC. Small line marks the location of quantification shown on the bottom. To visualize the dynamics of the entire lamellipodia, see Videos 5, 6, and 7.
Figure S6.
Figure S6.
Uncropped WB images shown in previous figures.

Similar articles

Cited by

References

    1. Ameka, M., Kahle M.P., Perez-Neut M., Gentile S., Mirza A.A., and Cuevas B.D.. 2014. MEKK2 regulates paxillin ubiquitylation and localization in MDA-MB 231 breast cancer cells. Biochem. J. 464:99–108. 10.1042/BJ20140420 - DOI - PMC - PubMed
    1. Badowski, C., Pawlak G., Grichine A., Chabadel A., Oddou C., Jurdic P., Pfaff M., Albigès-Rizo C., and Block M.R.. 2008. Paxillin phosphorylation controls invadopodia/podosomes spatiotemporal organization. Mol. Biol. Cell. 19:633–645. 10.1091/mbc.e06-01-0088 - DOI - PMC - PubMed
    1. Berg, A., Frey I., Baumstark M., and Keul J.. 1988. Influence of probucol administration on lipoprotein cholesterol and apolipoproteins in normolipemic males. Atherosclerosis. 72:49–54. 10.1016/0021-9150(88)90061-5 - DOI - PubMed
    1. Berginski, M.E., and Gomez S.M.. 2013. The Focal Adhesion Analysis Server: a web tool for analyzing focal adhesion dynamics. F1000 Res. 2:68. 10.12688/f1000research.2-68.v1 - DOI - PMC - PubMed
    1. Bravo-Cordero, J.J., Marrero-Diaz R., Megías D., Genís L., García-Grande A., García M.A., Arroyo A.G., and Montoya M.C.. 2007. MT1-MMP proinvasive activity is regulated by a novel Rab8-dependent exocytic pathway. EMBO J. 26:1499–1510. 10.1038/sj.emboj.7601606 - DOI - PMC - PubMed

Publication types