. 2021 Jun;148(3):101-136.
doi: 10.1007/s11120-021-00840-4. Epub 2021 May 17.

The role of Cytochrome b6f in the control of steady-state photosynthesis: a conceptual and quantitative model

Affiliations

The role of Cytochrome b6f in the control of steady-state photosynthesis: a conceptual and quantitative model

J E Johnson et al. Photosynth Res. 2021 Jun.

Abstract

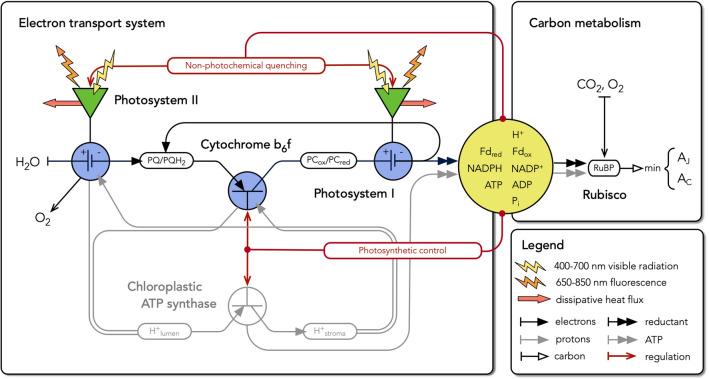
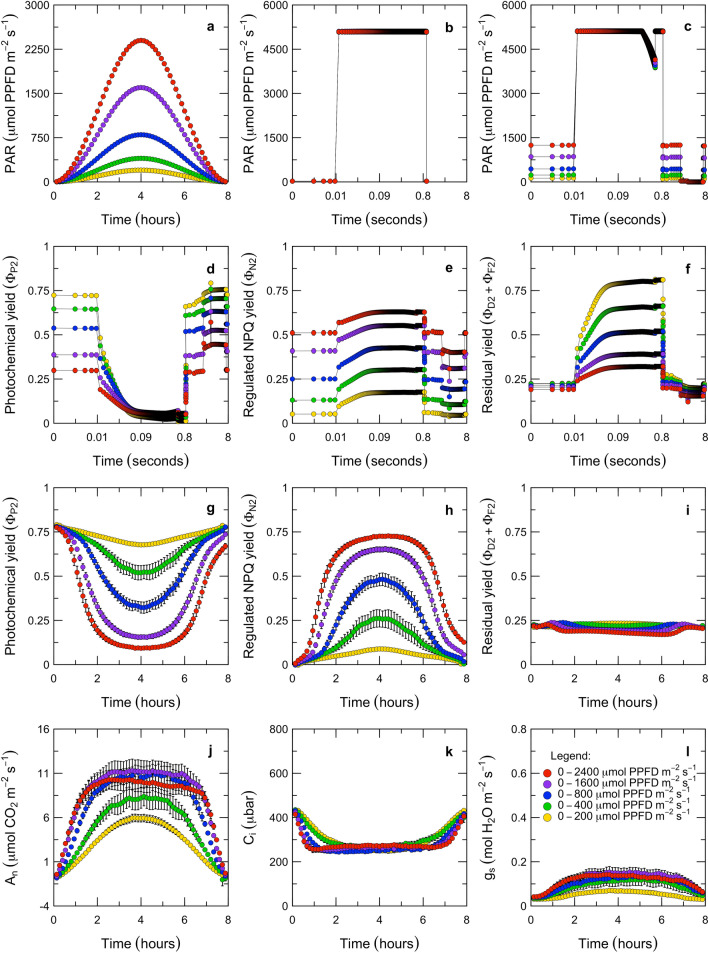
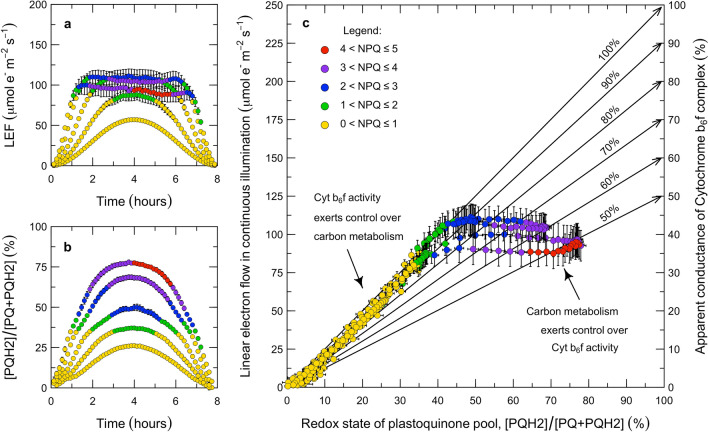
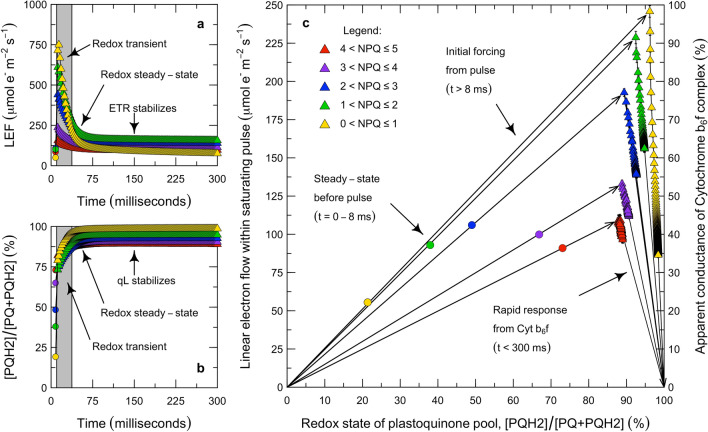
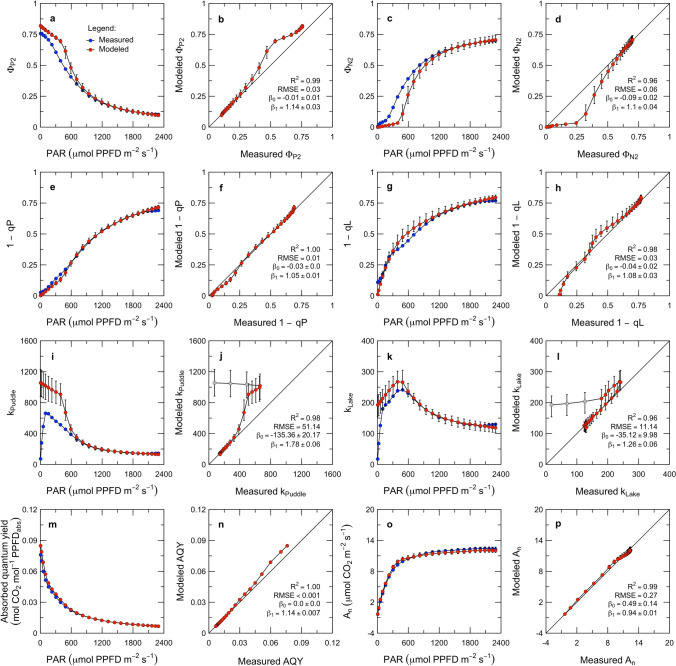
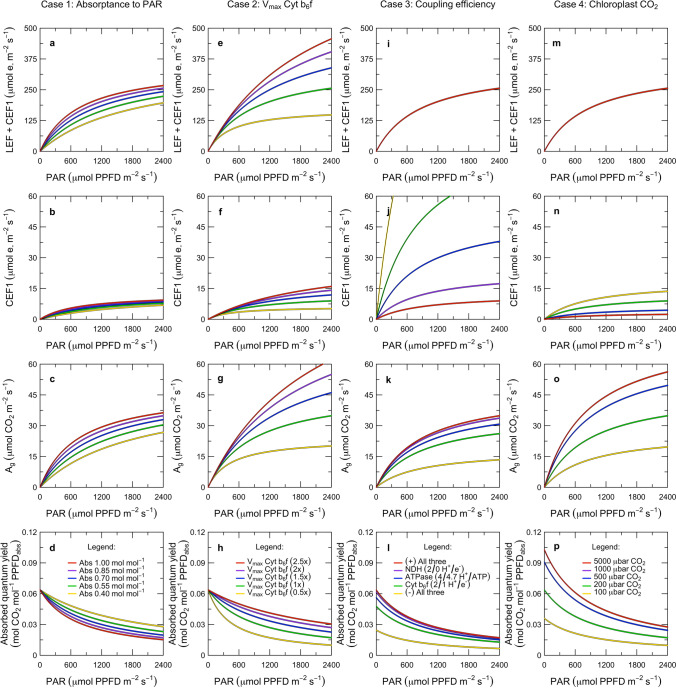
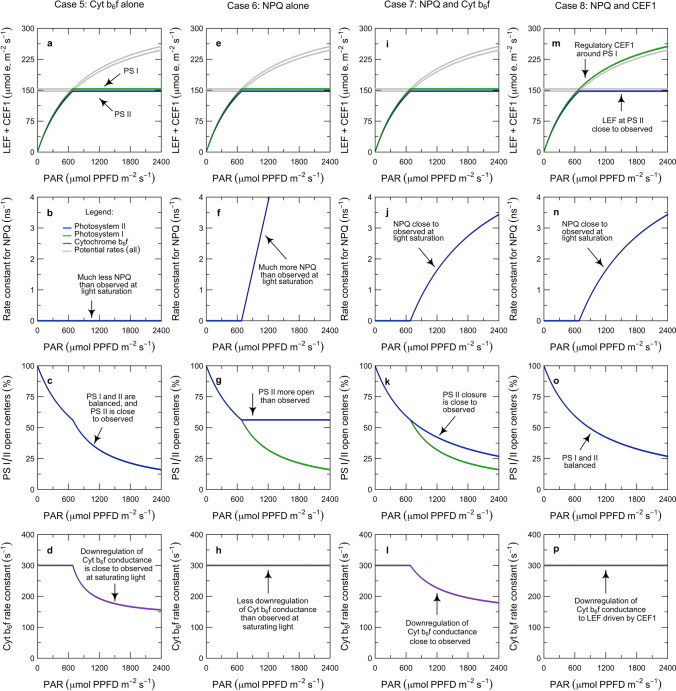
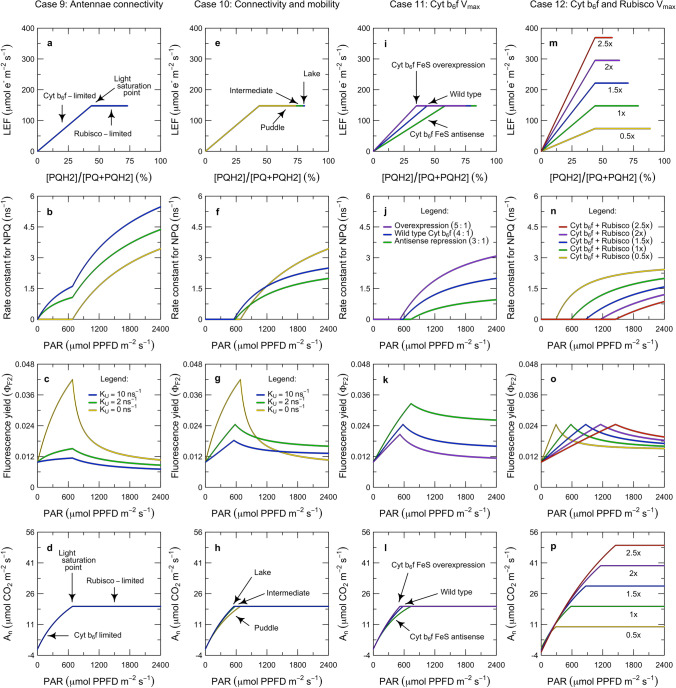
Here, we present a conceptual and quantitative model to describe the role of the Cytochrome [Formula: see text] complex in controlling steady-state electron transport in [Formula: see text] leaves. The model is based on new experimental methods to diagnose the maximum activity of Cyt [Formula: see text] in vivo, and to identify conditions under which photosynthetic control of Cyt [Formula: see text] is active or relaxed. With these approaches, we demonstrate that Cyt [Formula: see text] controls the trade-off between the speed and efficiency of electron transport under limiting light, and functions as a metabolic switch that transfers control to carbon metabolism under saturating light. We also present evidence that the onset of photosynthetic control of Cyt [Formula: see text] occurs within milliseconds of exposure to saturating light, much more quickly than the induction of non-photochemical quenching. We propose that photosynthetic control is the primary means of photoprotection and functions to manage excitation pressure, whereas non-photochemical quenching functions to manage excitation balance. We use these findings to extend the Farquhar et al. (Planta 149:78-90, 1980) model of [Formula: see text] photosynthesis to include a mechanistic description of the electron transport system. This framework relates the light captured by PS I and PS II to the energy and mass fluxes linking the photoacts with Cyt [Formula: see text], the ATP synthase, and Rubisco. It enables quantitative interpretation of pulse-amplitude modulated fluorometry and gas-exchange measurements, providing a new basis for analyzing how the electron transport system coordinates the supply of Fd, NADPH, and ATP with the dynamic demands of carbon metabolism, how efficient use of light is achieved under limiting light, and how photoprotection is achieved under saturating light. The model is designed to support forward as well as inverse applications. It can either be used in a stand-alone mode at the leaf-level or coupled to other models that resolve finer-scale or coarser-scale phenomena.

Keywords: Cytochrome; Electron transport; Model; Photosystem I; Photosystem II; Rubisco.


Conflict of interest statement

The authors have no relevant financial or non-financial interests to disclose.

Figures

Fig. 1
Fig. 1
Electron transport system as an electrical circuit. In this model, we conceptualize Cyt b6f as a transistor, i.e., a regulated circuit element that uses variable conductance to control current flow. The linear flow of electrons from water to reductant is viewed as a light-driven current that is under the control of a hierarchy of regulatory feedbacks stemming from carbon metabolism. In limiting light, Cyt b6f presents maximal conductance to flow, and feedback from carbon metabolism adjusts the excitation of PS I and PS II in such a way as to balance the relative rates of linear and cyclic electron flow to the NADPH, Fd, and ATP requirements of the sinks. When light becomes saturating, feedback from carbon metabolism also decreases the apparent conductance of Cyt b6f, controlling the linear flow of electrons through the plastoquinone pool and the associated flow of protons into the thylakoid lumen. In this way, the regulation of Cyt b6f simultaneously permits efficient photosynthesis and protects the system from photodamage. By expressing these concepts quantitatively, this model is able to simulate the steady-state gas-exchange and fluorescence fluxes that are associated with photosynthesis over the range of conditions experienced by leaves in nature
Fig. 2
Fig. 2
Response of Populus fremontii leaves to light sine waves. In this experiment, we varied the steady-state light intensity over the range of natural sunlight at different speeds and directions (a), and applied periodic saturating pulses at an intensity that was approximately double the maximum steady-state light intensity (b, c). We then characterized the transient fluorescence associated with each pulse (df), the steady-state fluorescence (gi), and the steady-state gas-exchange (jl). In (a, gl), each point represents the mean of n=6 replicates ± std. error, measured in 8 min increments over an 8 h period (N = 1830). In bf, each point represents the mean of n = 343–354 replicates ± std. error, measured at 2 to 20 ms increments over each pulse (N 900,000). In di, the measured PS II yields are calculated as: ΦP2=1-Fs/Fm (Genty et al. 1989); ΦN2=Fs·(1/Fm-1/Fm) and ΦD2+ΦF2=Fs/Fm (Hendrickson et al. 2004)
Fig. 3
Fig. 3
Role of Cytochrome b6f in the control of electron transport during continuous illumination. Under continuous illumination, the relationship between LEF and the redox state of the PQ pool differs between limiting and saturating light intensities (a, b). Under limiting intensities, LEF is linearly proportional to the redox state of the PQ pool (a, b) because the apparent conductance of Cyt b6f is maximal (c). Once illumination is saturating, LEF is constant and independent of the redox state of the PQ pool (a, b) because the apparent conductance of Cyt b6f is downregulated (c). In these plots, the apparent LEF is the product of the light intensity, Q; an estimated absorption cross-section, α2=0.85·0.5; and the photochemical yield, ΦP2 (Genty et al. 1989). The apparent redox state of the PQ pool is 1-qL (Kramer et al. 2004). The apparent conductance of Cyt b6f is estimated by extrapolating from the LEF that corresponds to the completely oxidized state of the PQ pool, through a given observation, to the LEF that corresponds to the completely reduced state of the PQ pool (sloped lines in c; kLake=LEF/(1-qL)). The responses are grouped by NPQ, given as Fm/Fm-1 (Bilger and Björkman 1990). Each point represents the mean of n=6 replicates ± std. error, measured in 8 min increments over an 8 h period (N=1830)
Fig. 4
Fig. 4
Role of Cytochrome b6f in the control of electron transport during saturating pulses. During each pulse, LEF initially increases (a), the PQ pool becomes more reduced (b), and then LEF decreases as the apparent conductance of Cyt b6f decreases (c). The extent of the surge in LEF, the over-reduction of PQ, and the decrease in Cyt b6f conductance are all inversely proportional to the level of NPQ developed before the pulse (a, b, c). In c, the data are filtered to exclude the initial redox transient using the criterion Δ|qL|<0.0025 ms-1. As in the previous figure, the apparent LEF is the product of the light intensity, Q; an estimated absorption cross-section, α2=0.85·0.5; and the photochemical yield, ΦP2 (Genty et al. 1989). The apparent redox state of the PQ pool is 1-qL (Kramer et al. 2004). The apparent conductance of Cyt b6f is kLake=LEF/(1-qL). The responses are grouped by NPQ, given as Fm/Fm-1 (Bilger and Björkman 1990). Each point represents the mean ± std. error across all of the observations in a given NPQ group, but in many cases the uncertainties are so small as to be obscured by the points. There were n=912, 209, 208, 274, and 83 observations in each of the NPQ groups, from lowest to highest NPQ. This represented 97% of the ramped pulses in Fig. 2c; the remaining 3% were discarded after filtering with quality-control criteria (N = 1686 of 1732)
Fig. 5
Fig. 5
Example of model inversion with measurements from sine wave experiment. These plots illustrate the fit of the model to fluorescence and gas-exchange measurements of a single leaf of P. fremontii over the ascending phase of the highest light intensity treatment in the sine wave experiment. For each parameter, the modeled and measured values are illustrated as a function of light intensity, and relative to an ideal 1:1 relationship. The modeled values are given as the median and interquartile range across a set of simulations based on a population of Pareto optimal parameter estimates. The quality of fit is assessed with Type I regressions and summarized with the coefficient of determination (R2), root mean square error (RMSE), and intercept and slope (β0, β1). Outliers shaded in gray are excluded from the quality-of-fit statistics. Note that the apparent redox state of the PQ pool is given both as 1-qP (Schreiber et al. 1986) and 1-qL (Kramer et al. 2004). Analogously, the apparent conductance of Cyt b6f is given both as kPuddle=LEF/(1-qP) and kLake=LEF/(1-qL). The input parameters are given in Table 1, and other details as described in ‘Model inversion’
Fig. 6
Fig. 6
Key model predictions related to the structure of the electron transport system. These simulations illustrate the effects of variation in parameters that control electron transport under limiting light intensities: the absorptance to PAR (Case 1), the maximum activity of Cyt b6f (Case 2), the efficiency of coupling between electron transport and ATP production (Case 3), and the chloroplast CO2 (Case 4). Results are plotted for the potential rates of LEF and CEF1 together, the potential rate of CEF1 alone, the potential rate of gross CO2 assimilation, and the potential absorbed quantum yield for CO2 assimilation. Note that the rates are described as ‘potential’ because they all correspond to the Cyt b6f-limited state. The input parameters are given in Table 2, and other details as described in ‘Limits of electron transport (Cases 1–4)’
Fig. 7
Fig. 7
Key model predictions related to the regulation of the electron transport system. These simulations examine the effects of variation in assumptions about how electron transport is coordinated with carbon metabolism: via feedback regulation of Cyt b6f alone (Case 5), via feedback regulation of NPQ alone (Case 6), via feedback regulation of NPQ and Cyt b6f together (Case 7), and via feedback regulation of NPQ and CEF1 together (Case 8). Results are plotted for the potential and actual rates of LEF and CEF1, the rate constant for NPQ, the fraction of open reaction centers for PS II and PS I, and the rate constant for Cyt b6f. The input parameters are given in Table 2, and other details are as described in ‘Regulation of electron transport (Cases 5–8)’
Fig. 8
Fig. 8
Key model predictions related to the interactions between electron transport and carbon metabolism. These simulations address how the interactions between electron transport and carbon metabolism are expressed in observable fluorescence and gas-exchange parameters. The simulations examine the effects of: the connectivity of the PS II antennae (Case 9), the interaction between the connectivity of the PS II antennae and the redistribution of excitation from PS II to PS I via state transitions (Case 10), the maximum activity of Cyt b6f alone (Case 11), and the interaction between the maximum activities of Cyt b6f and Rubisco (Case 12). Results are plotted in terms of the relationship between PQH2 and LEF, and the light responses of NPQ, the steady-state fluorescence yield of PS II, and net CO2 assimilation. The input parameters are given in Table 2, with one exception: for Cases 11-12, KU2=2 ns-1 and state transitions are permitted. Other details are as described in ‘Parameterization of the model (Cases 9–12)’

Similar articles

Cited by

References

    1. Amarnath K, Bennett DIG, Schneider AR, Fleming GR. Multiscale model of light harvesting by photosystem II in plants. Proc Natl Acad Sci. 2016;113:1156–1161. doi: 10.1073/pnas.1524999113. - DOI - PMC - PubMed
    1. Anderson JM. Cytochrome b6f complex: dynamic molecular organization, function and acclimation. Photosynth Res. 1992;34:341–357. doi: 10.1007/BF00029810. - DOI - PubMed
    1. Anderson JM, Price GD, Chow WS, Hope AB, Badger MR. Reduced levels of cytochrome bf complex in transgenic tobacco leads to marked photochemical reduction of the plastoquinone pool, without significant change in acclimation to irradiance. Photosynth Res. 1997;53:215–227. doi: 10.1023/A:1005856615915. - DOI
    1. Avenson TJ, Saathoff AJ (2018) Sub-saturating multiphase flash irradiances to estimate maximum fluorescence yield. In: Covshoff S (ed) Photosynthesis: methods and protocols. Humana Press, New York, pp 105–120 - PubMed
    1. Baker NR, Oxborough K. Chlorophyll fluorescence as a probe of photosynthetic productivity. In: Papageorgiou GC, Govindjee, editors. Chlorophyll a fluorescence: a signature of photosynthesis. Berlin: Springer; 2004. pp. 65–82.

MeSH terms

Substances

LinkOut - more resources