. 2021 May 17;16(5):e0243675.
doi: 10.1371/journal.pone.0243675. eCollection 2021.

Genome-wide association mapping identifies yellow rust resistance loci in Ethiopian durum wheat germplasm

Affiliations

Genome-wide association mapping identifies yellow rust resistance loci in Ethiopian durum wheat germplasm

Sisay Kidane Alemu et al. PLoS One. .

Abstract

Durum wheat is an important cereal grown in Ethiopia, a country which is also its center for genetic diversity. Yellow (stripe) rust caused by Puccinia striiformis fsp tritici is one of the most devastating diseases threatening Ethiopian wheat production. To identify sources of genetic resistance and combat this pathogen, we conducted a genome wide association study of yellow rust resistance on 300 durum wheat accessions comprising 261 landraces and 39 cultivars. The accessions were evaluated for their field resistance using a modified Cobb scale at Meraro, Kulumsa and Chefe Donsa in the 2015 and 2016 main growing seasons. Analysis of the 35K Axiom Array genotyping data of the panel resulted in a total of 8,797 polymorphic SNPs of which 7,093 were used in subsequent analyses. Population structure analysis suggested two groups in which the cultivars clearly stood out separately from the landraces. Eleven SNPs significantly associated with yellow rust resistance were identified on four chromosomes (1A, 1B, 2B, and 5A) which defined at least five genomic loci. Six of the SNPs were consistently identified on chromosome 1B singly at each and combined overall environments which explained 62.6-64.0% of the phenotypic variation (R2). Resistant allele frequency ranged from 14.0-71.0%; Zooming in to the identified resistance loci revealed the presence of disease resistance related genes involved in the plant defense system such as the ABC transporter gene family, disease resistance protein RPM1 (NBS-LRR class), Receptor kinases and Protein kinases. This study has provided SNPs for tracking the loci associated with yellow rust resistance and a diversity panel which can be used for association study of other agriculturally important traits in durum wheat.


Conflict of interest statement

The authors have declared that no competing interests exist.

Figures
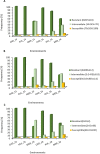
Fig 1
Fig 1. Reaction to yellow rust of 293 Ethiopian durum wheat accessions obtained from field experiments in six environments.
A) severity, B) Field Response and C) Coefficient of Infection. The reaction data of severity and field response was used to classify the panel in to Resistant, Intermediate and Susceptible groups as described in Liu et al. [17] and taking the corresponding values for Coefficient of Infection as well.
Fig 2
Fig 2. Distributions of disease severity (SEV), response (RES) and coefficient of infection (CI) combined over four environments.
A, B and C represents distributions of best linear unbiased estimates (BLUEs) of original for SEV, RES and CI data while D, E and F represents transformed data in their respective order. “W” is Shapiro—Wilks Statistic indicating the correlation between observed values and normal scores both for the original and transformed values.
Fig 3
Fig 3. Examples of cluster plots of durum association panel resulted from axiom analysis suit V.2 with best practice workflow.
QC Threshold passed accessions are 296 and 8 samples are control; AX-95238778 & AX-95685405 are Axiom SNP probes with which the accessions are genotyped.
Fig 4
Fig 4. Chromosomal distribution of 7093 SNPs across genome A and B.
They are a subset of the 8797 SNPs (Table 4) and are selected based on their MAF values of > 5% for all subsequent analysis.
Fig 5
Fig 5. Population structure and relatedness among the 293 accessions used for the GWAS.
A) population structure plot as reveled by STRUCTURE analysis. B) Delta K plot from STRUCTRUE HARVESTER analysis. C) 293x293 Kinship matrix plot using genetic similarity matching where outside the matrix is a clustering tree of the panel in to 2 main groups (in global view) while a bit of detailed view gave four clusters: CL = Cultivars and three Land Races sub- groups (LR-I, LR-II and LR-III). At the top left corner of the plot is the distribution of estimated kinship values. D) 3D PCA plot of the first three principal components where improved varieties still stood out in a distinct group at the very right end in the plot while the rest grouped in a similar way to the Kinship plot. E) 2D PCA plot elaborating sub-groups along with the variation explained by the components.
Fig 6
Fig 6. Genome-wide linkage disequilibrium as dictated by physical distance.
Average pair-wise inter-SNP LD (r2) values plotted against physical distance in base pairs based on the wheat reference genome RefSeq v.1.0. The red line indicates the threshold LD.
Fig 7
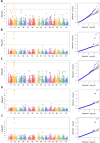
Fig 7. Genome-wise Manhattan and QQ plots of GWAS of yellow rust resistance in Ethiopian durum wheat.
Results represent association analysis of CI data from 293 durum wheat accessions at CHD-16 (A), KUL-16 (B) MER-15 (C), MER-16 (D) and combined over the four environments (E). The panel were genotyped with Breeders’ 35K Axiom Array for wheat.

Similar articles

Cited by

References

    1. Kilian B, Özkan H, Deusch O, Effgen S, Brandolini A, Kohl J, et al.. Independent wheat B and G genome origins in outcrossing Aegilops progenitor haplotypes. Mol Biol Evol. 2007; 24(1): 217–227. 10.1093/molbev/msl151 - DOI - PubMed
    1. Chris G, World Durum Outlook. Available online: http://www.internationalpasta.org/ resources/ IPO%20BOARD%202013/2%20Chris%20Gillen.pdf.
    1. Vavilov NI. The origin, variation, immunity and breeding of cultivated plants. Soil Sci. 1951; 72:482.
    1. Vavilov NI, Dorofeev VF. Origin and Geography of Cultivated Plants. Cambridge: Cambridge University Press. 1992.
    1. Harlain JR. Ethiopia: a centre of diversity. Econ Bot. 1969; 23: 309–314.

Publication types

MeSH terms