. 2021 May 17;17(5):e1009021.
doi: 10.1371/journal.pcbi.1009021. eCollection 2021 May.

MiMeNet: Exploring microbiome-metabolome relationships using neural networks

Affiliations

MiMeNet: Exploring microbiome-metabolome relationships using neural networks

Derek Reiman et al. PLoS Comput Biol. .

Abstract

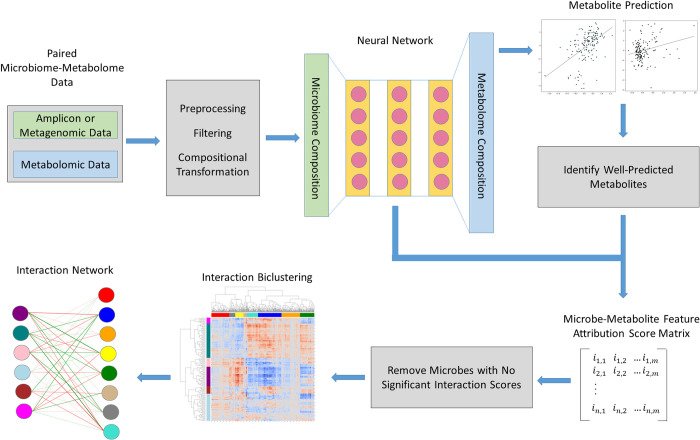
The advance in microbiome and metabolome studies has generated rich omics data revealing the involvement of the microbial community in host disease pathogenesis through interactions with their host at a metabolic level. However, the computational tools to uncover these relationships are just emerging. Here, we present MiMeNet, a neural network framework for modeling microbe-metabolite relationships. Using ten iterations of 10-fold cross-validation on three paired microbiome-metabolome datasets, we show that MiMeNet more accurately predicts metabolite abundances (mean Spearman correlation coefficients increase from 0.108 to 0.309, 0.276 to 0.457, and -0.272 to 0.264) and identifies more well-predicted metabolites (increase in the number of well-predicted metabolites from 198 to 366, 104 to 143, and 4 to 29) compared to state-of-art linear models for individual metabolite predictions. Additionally, we demonstrate that MiMeNet can group microbes and metabolites with similar interaction patterns and functions to illuminate the underlying structure of the microbe-metabolite interaction network, which could potentially shed light on uncharacterized metabolites through "Guilt by Association". Our results demonstrated that MiMeNet is a powerful tool to provide insights into the causes of metabolic dysregulation in disease, facilitating future hypothesis generation at the interface of the microbiome and metabolomics.


Conflict of interest statement

The authors have declared that no competing interests exist.

Figures

Fig 1
Fig 1. Framework of MiMeNet learning model.
MiMeNet uses paired microbiome and metabolome data for model training. Microbiome abundance features (green) are used to train a neural network to predict metabolite abundance features (blue). Well-predicted metabolites are identified, and the trained models are used to learn a microbe-metabolite attribution score matrix. The attribution score matrix is biclustered into microbe and metabolite modules which are then used to construct a module-based interaction network.
Fig 2
Fig 2. Distributions of correlations (Background and observed) and evaluation of multivariate learning.
Background (blue) and observed (orange) distributions are shown for the (A) IBD (PRISM), (B) cystic fibrosis, and (C) soil datasets. The red vertical line denotes the 95th percentile of the background correlations and the gray area represents the well-predicted region using this threshold. (D) Scatter plot comparing the annotated metabolite correlations between models trained on just the annotated set and models trained on the full set of metabolites. (E) Mean correlation and (F) number of well-predicted metabolites found in models trained on the annotated set of metabolites and full set of metabolties as Gaussian noise is added to the annotated metabolite set input. All results in (D)-(F) are for prediction of the annotated metabolites.
Fig 3
Fig 3. Mean correlation analysis using different amounts of training data.
Correlations for 10-, 5-, 3-, and 2- fold cross-validation evaluations are shown for the (A) IBD (PRISM) and (B) cystic fibrosis datasets. (C) Subsets of the IBD (PRISM) and cystic fibrosis corresponding to 100%, 80%, 60%, and 40% of the total samples are used as an input for MiMeNet. Three random datasets for each level of subsetting were created and then mean correlation using 10 iterations of 10-fold cross-validation is calculated across the three. In addition, models trained on the complete subsets of the IBD (PRISM) data are used to evaluate the IBD (External) test set.
Fig 4
Fig 4. Scatter plots comparing MiMeNet to MelonnPan prediction correlations.
Scatter plots showing the metabolite prediction correlations of MiMeNet against MelonnPan for (A) PRISM IBD dataset, (B) cystic fibrosis dataset, and (C) soil dataset, each trained using 10 iterations of 10-fold cross-validation. (D) In addition, 10 iterations of both models were trained on the PRISM dataset to evaluate the external IBD dataset. Each point represents the average correlation of a metabolite across 10 iterations of training. (E) The top 20 best correlated metabolites identified from the PRISM IBD dataset are shown.
Fig 5
Fig 5. Clustering of microbes and metabolites in the IBD datasets.
(A) Clustering of microbes (row) and metabolites (column) based on the feature attribution scores obtained from the IBD (PRISM) dataset. Row and column colors represent assigned modules. (B) Network connecting microbial modules with metabolomic modules. The most abundant genera are annotated for microbe modules. The most abundant metabolite classes are annotated for the metabolite modules. Red connections indicate negative attributions and green edges indicate positive attributions. Node color represents module color from (A). (C) Jaccard Index and (D) Spearman correlation between module features of WGCNA and MiMeNet. Jaccard Index values and Spearman correlation p-values shown in the boxes. (E) IBD status prediction of IBD (External) using models trained on WGCNA module feature values, MiMeNet module feature values, and original abundance from IBD (PRISM) microbial and metabolomic data.
Fig 6
Fig 6. Microbial and metabolic module abundance by patient status in the IBD (PRISM) dataset.
The mean normalized abundance of members within modules are shown here for healthy patients and IBD patients from the IBD (PRISM) dataset using (A) microbial and (B) metabolic modules and from the IBD (External) dataset using (C) microbial and (D) metabolic modules identified by MiMeNet. P-values from a two-sided Wilcoxon rank-sum test are shown on the bottom.

Similar articles

Cited by

References

    1. Kau AL, Ahern PP, Griffin NW, Goodman AL, Gordon JI. Human nutrition, the gut microbiome and the immune system. Nature. 2011;474(7351):327–36. 10.1038/nature10213 - DOI - PMC - PubMed
    1. Wang J, Jia H. Metagenome-wide association studies: fine-mining the microbiome. Nature Reviews Microbiology. 2016;14(8):508–22. 10.1038/nrmicro.2016.83 - DOI - PubMed
    1. Ghaisas S, Maher J, Kanthasamy A. Gut microbiome in health and disease: Linking the microbiome–gut–brain axis and environmental factors in the pathogenesis of systemic and neurodegenerative diseases. Pharmacology & therapeutics. 2016;158:52–62. 10.1016/j.pharmthera.2015.11.012 - DOI - PMC - PubMed
    1. Brown CT, Davis-Richardson AG, Giongo A, Gano KA, Crabb DB, Mukherjee N, et al.. Gut microbiome metagenomics analysis suggests a functional model for the development of autoimmunity for type 1 diabetes. PloS one. 2011;6(10).r 10.1371/journal.pone.0025792 - DOI - PMC - PubMed
    1. Tilg H, Kaser A. Gut microbiome, obesity, and metabolic dysfunction. The Journal of clinical investigation. 2011;121(6):2126–32. 10.1172/JCI58109 - DOI - PMC - PubMed

Publication types

LinkOut - more resources