. 2021 Jan-Jun:296:100784.
doi: 10.1016/j.jbc.2021.100784. Epub 2021 May 14.

Generation of an isoform-level transcriptome atlas of macrophage activation

Affiliations

Generation of an isoform-level transcriptome atlas of macrophage activation

Apple Cortez Vollmers et al. J Biol Chem. 2021 Jan-Jun.

Abstract

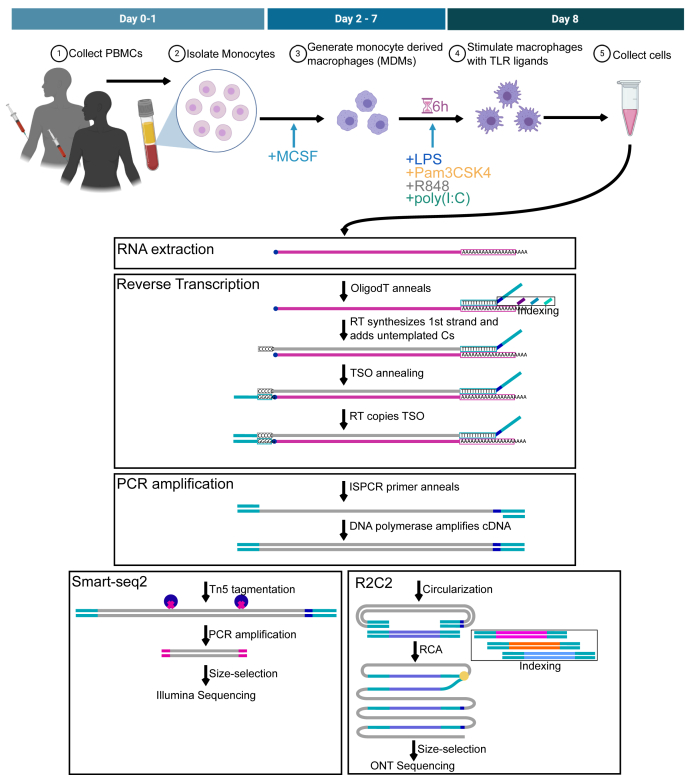
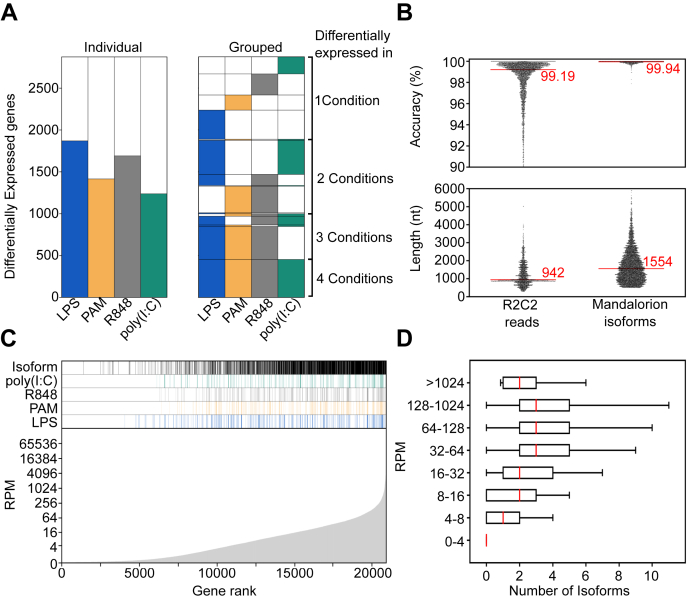
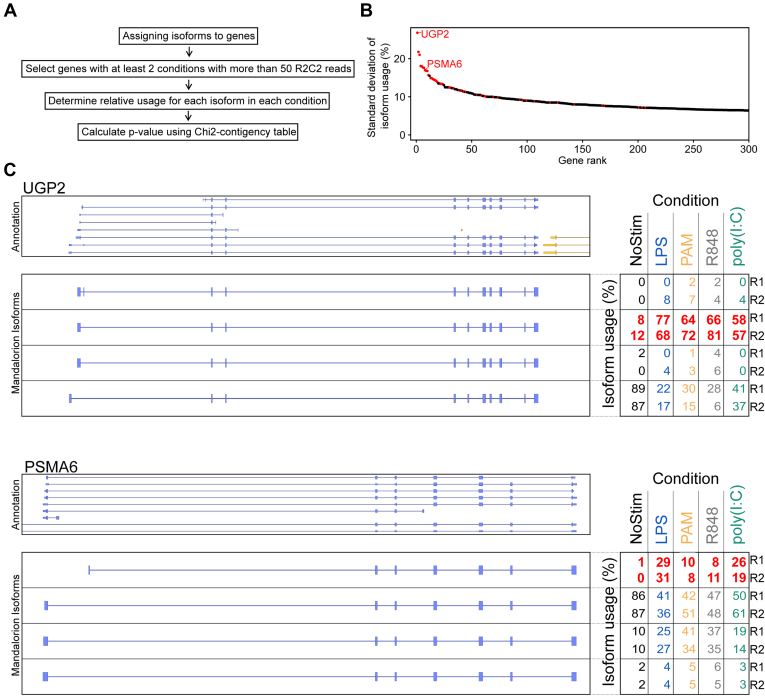
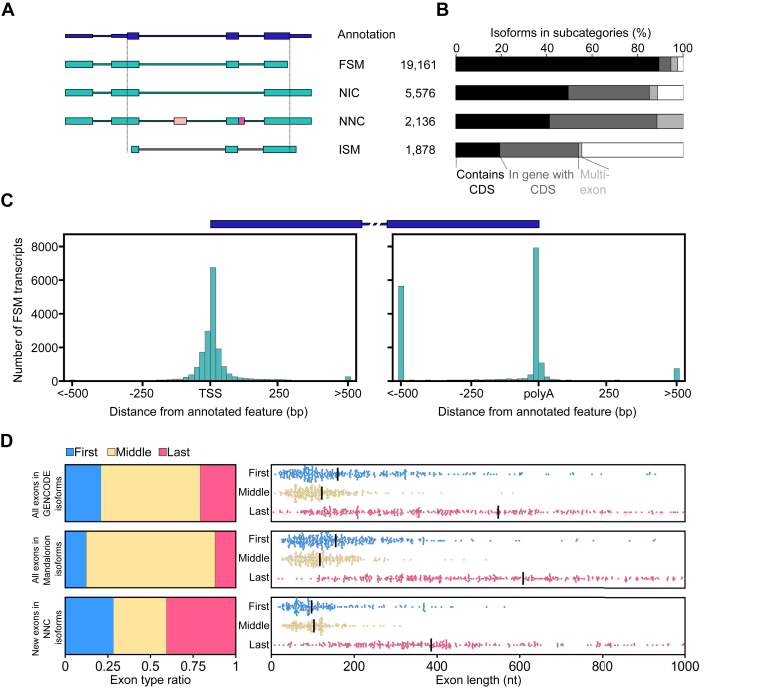
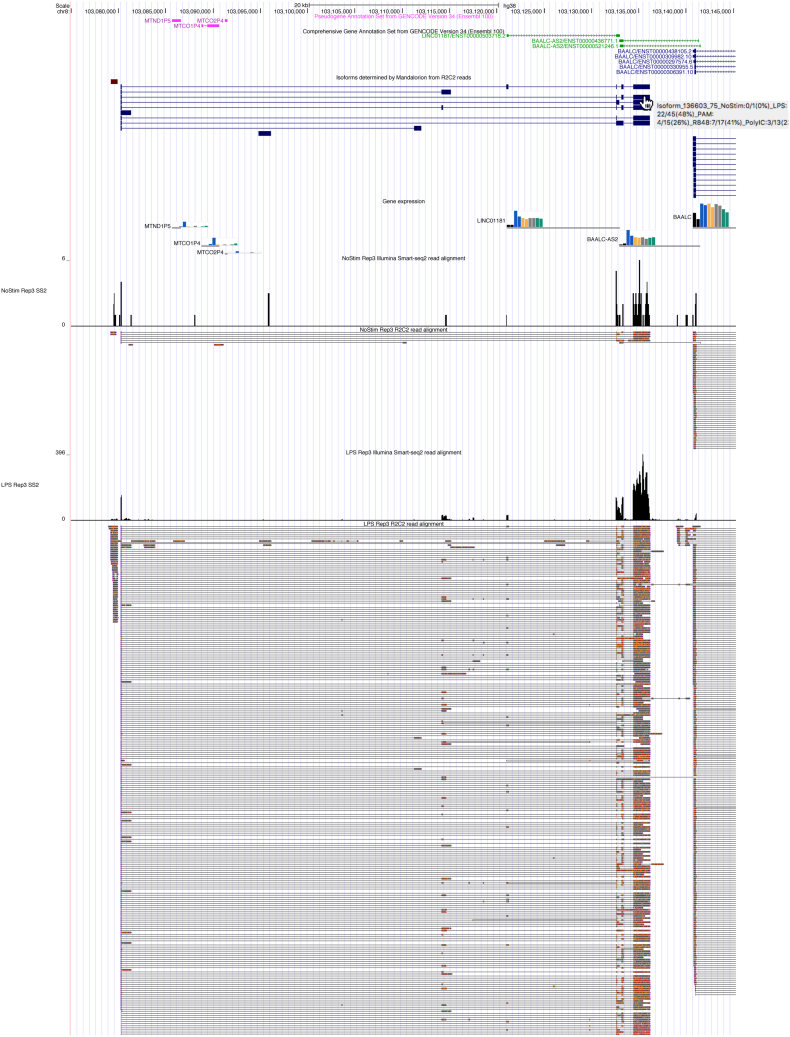
RNA-seq is routinely used to measure gene expression changes in response to cell perturbation. Genes upregulated or downregulated following some perturbation are designated as genes of interest, and their most expressed isoform(s) would then be selected for follow-up experimentation. However, because of its need to fragment RNA molecules, RNA-seq is limited in its ability to capture gene isoforms and their expression patterns. This lack of isoform-specific data means that isoforms would be selected based on annotation databases that are incomplete, not tissue specific, or do not provide key information on expression levels. As a result, minority or nonexistent isoforms might be selected for follow-up, leading to loss in valuable resources and time. There is therefore a great need to comprehensively identify gene isoforms along with their corresponding levels of expression. Using the long-read nanopore-based R2C2 method, which does not fragment RNA molecules, we generated an Isoform-level transcriptome Atlas of Macrophage Activation that identifies full-length isoforms in primary human monocyte-derived macrophages. Macrophages are critical innate immune cells important for recognizing pathogens through binding of pathogen-associated molecular patterns to toll-like receptors, culminating in the initiation of host defense pathways. We characterized isoforms for most moderately-to-highly expressed genes in resting and toll-like receptor-activated monocyte-derived macrophages, identified isoforms differentially expressed between conditions, and validated these isoforms by RT-qPCR. We compiled these data into a user-friendly data portal within the UCSC Genome Browser (https://genome.ucsc.edu/s/vollmers/IAMA). Our atlas represents a valuable resource for innate immune research, providing unprecedented isoform information for primary human macrophages.

Keywords: full-length cDNA sequencing; macrophages; transcriptome analysis.


Conflict of interest statement

Conflicts of interest The authors declare that they have no conflicts of interest with the contents of this article.

Figures

Figure 1
Figure 1
Experimental Design. A schematic of macrophage differentiation and activation is shown on top. A workflow for data generation is shown at the bottom. Top, we generated monocyte-derived macrophages (MDMs) from the peripheral blood mononuclear cells of two individuals (Rep1 and Rep2) by first isolating monocytes and treating them with macrophage colony-stimulating factor (M-CSF). The resulting macrophages were stimulated with TLR ligands for 6 h and then collected. Bottom, we extracted RNA and synthesized full-length cDNA which we then processed to generate Smart-seq2 and R2C2 libraries for Illumina and Oxford Nanopore Technologies (ONT) sequencing, respectively. We then performed gene and isoform level analysis of the resulting sequencing data. TLR, toll-like receptor.
Figure 2
Figure 2
Gene and isoform level analysis.A, on the left, the numbers of genes differentially expressed between nonstimulated macrophages and macrophages stimulated with the indicated TLR ligands. On the right, genes are grouped if they were differentially expressed in more than one condition. For example, the 454 genes differentially expressed in all four conditions are shown at the bottom. Above those, the number of genes differentially expressed in LPS, PAM, and R848, but not poly(I:C) are shown. B, accuracy and length of individual R2C2 reads and Mandalorion isoforms are shown as swarmplots, with median values indicated by red lines and numeric values. C, different characteristics of genes ordered by expression are shown in this panel. From the bottom to top, this panel shows the average gene expression in reads per million (RPM) across all conditions, whether a gene is differentially expressed following LPS, Pam3CSK4 (PAM), R848, or poly(I:C) stimulation and whether we identified an isoform for the gene. D, the number of isoforms we detect for genes is shown as box plots for genes with different expression levels. TLR, toll-like receptor.
Figure 3
Figure 3
Differential isoform expression.A, workflow of differential isoform expression analysis. Genes were subselected based on expression, and differential expression was determined using a Chi-squared contingency table. B, genes are sorted by the maximum standard deviation of relative isoform usage among its isoforms. This maximum standard deviation is plotted (red if the gene has been identified as containing differentially expressed isoforms.) C, on the left, a Genome Browser view of the indicated genes is shown with GENCODE v34 annotation on top and identified isoforms below. On the right, the relative usage of each isoform in each replicate and condition is shown. Relative usage of the most variable isoform for each gene is highlighted in red.
Figure 4
Figure 4
Isoform characterization.A, on the left, models of different isoform categories are shown. The models shown for full-splice matches (FSM), novel in catalog (NIC), novel not in catalog (NNC), and incomplete splice-matches (ISM) isoforms all do not contain the CDS of the annotation shown on top. The NNC model contains a new exon (light pink) and an extension of an annotated exon (dark pink). On the right, the numbers of identified isoforms that fall into each category are shown. B, the percentage of isoforms in the different categories that contain more than one exon fall within a gene that has a CDS and contain a CDS of that gene are shown as nested bar plots. C, the distance of 5’ and 3’ ends of FSM isoform to the TSS and poly(A) site of the transcript they are associated with is shown as a histogram. A transcript model is shown on top to give context to the histograms. D, on the left, the ratio of first, middle, and last exons within GENCODE isoforms, all isoforms identified by Mandalorion, and newly identified exons in NNC isoforms are shown. On the right, the lengths of first, middle, and last exons within these isoform groups are shown as swarm plots with black bars indicating the median. CDS, full coding sequence; TSS, transcription start site.
Figure 5
Figure 5
Data exploration. A screenshot of the IAMA session in the UCSC genome browser is shown. From the top, GENCODE annotation, Mandalorion Isoforms, Smart-seq2 based gene expression (bar graphs), Smart-seq2 (histogram), and R2C2 reads. Highlighted are Smart-seq2 and R2C2 reads for just one replicate and two conditions to demonstrate the IAMA browser session and for space-saving purposes. The complete IAMA session for both replicates and all TLR-activated conditions are available here (https://genome.ucsc.edu/s/vollmers/IAMA). IAMA, Isoform-level transcriptome Atlas of Macrophage Activation; TLR, toll-like receptor.

References

    1. Pertea M., Pertea G.M., Antonescu C.M., Chang T.-C., Mendell J.T., Salzberg S.L. StringTie enables improved reconstruction of a transcriptome from RNA-seq reads. Nat. Biotechnol. 2015;33:290–295. - PMC - PubMed
    1. Bankevich A., Nurk S., Antipov D., Gurevich A.A., Dvorkin M., Kulikov A.S., Lesin V.M., Nikolenko S.I., Pham S., Prjibelski A.D., Pyshkin A.V., Sirotkin A.V., Vyahhi N., Tesler G., Alekseyev M.A. SPAdes: A new genome assembly algorithm and its applications to single-cell sequencing. J. Comput. Biol. 2012;19:455–477. - PMC - PubMed
    1. Grabherr M.G., Haas B.J., Yassour M., Levin J.Z., Thompson D.A., Amit I., Adiconis X., Fan L., Raychowdhury R., Zeng Q., Chen Z., Mauceli E., Hacohen N., Gnirke A., Rhind N. Full-length transcriptome assembly from RNA-seq data without a reference genome. Nat. Biotechnol. 2011;29:644–652. - PMC - PubMed
    1. Gupta I., Collier P.G., Haase B., Mahfouz A., Joglekar A., Floyd T., Koopmans F., Barres B., Smit A.B., Sloan S.A., Luo W., Fedrigo O., Ross M.E., Tilgner H.U. Single-cell isoform RNA sequencing characterizes isoforms in thousands of cerebellar cells. Nat. Biotechnol. 2018 doi: 10.1038/nbt.4259. - DOI - PubMed
    1. Workman R.E., Tang A.D., Tang P.S., Jain M., Tyson J.R., Razaghi R., Zuzarte P.C., Gilpatrick T., Payne A., Quick J., Sadowski N., Holmes N., de Jesus J.G., Jones K.L., Soulette C.M. Nanopore native RNA sequencing of a human poly(A) transcriptome. Nat. Methods. 2019;16:1297–1305. - PMC - PubMed

Publication types

Substances