

Genome-wide detection of CNVs and their association with performance traits in broilers
- PMID: 34001004
- PMCID: PMC8130382
- DOI: 10.1186/s12864-021-07676-1
Genome-wide detection of CNVs and their association with performance traits in broilers
Abstract
Background: Copy number variations (CNVs) are a major type of structural genomic variants that underlie genetic architecture and phenotypic variation of complex traits, not only in humans, but also in livestock animals. We identified CNVs along the chicken genome and analyzed their association with performance traits. Genome-wide CNVs were inferred from Affymetrix® high density SNP-chip data for a broiler population. CNVs were concatenated into segments and association analyses were performed with linear mixed models considering a genomic relationship matrix, for birth weight, body weight at 21, 35, 41 and 42 days, feed intake from 35 to 41 days, feed conversion ratio from 35 to 41 days and, body weight gain from 35 to 41 days of age.
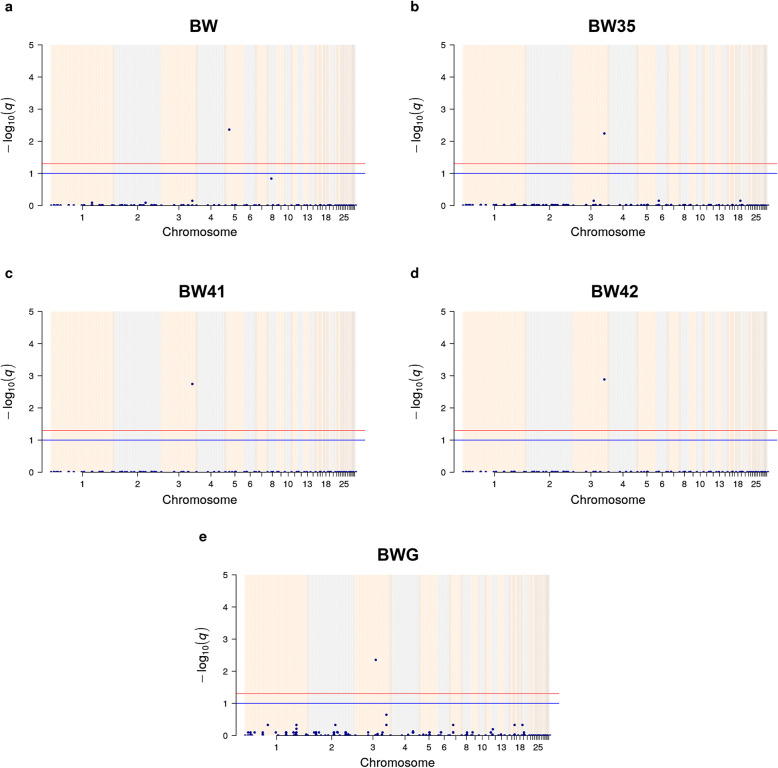
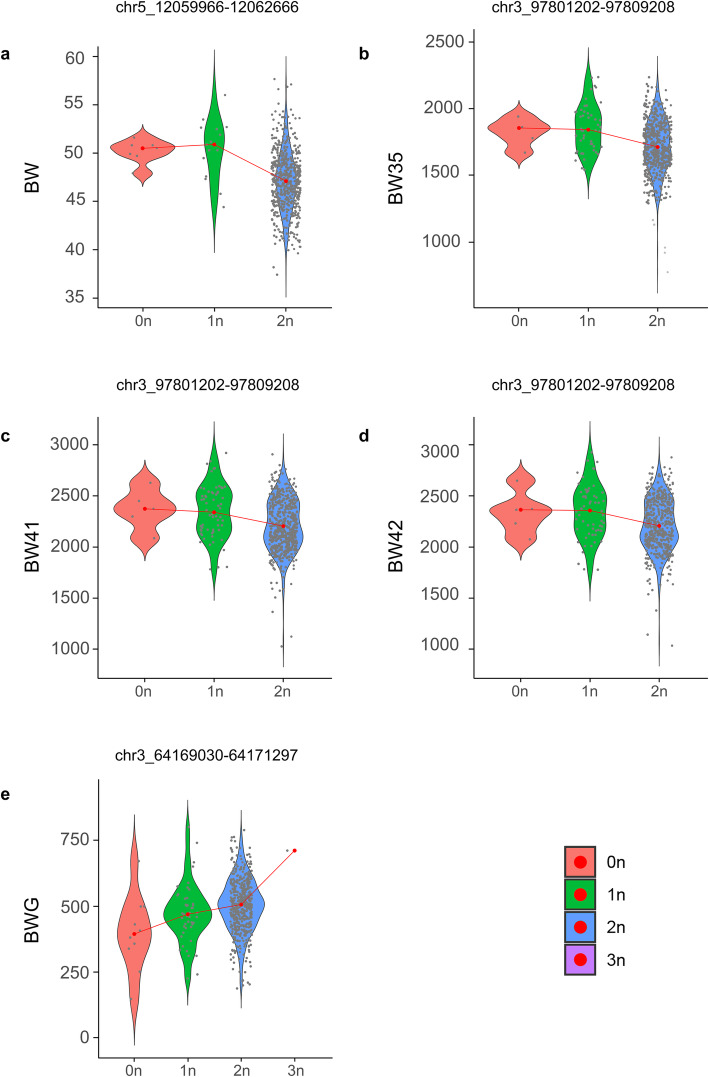
Results: We identified 23,214 autosomal CNVs, merged into 5042 distinct CNV regions (CNVRs), covering 12.84% of the chicken autosomal genome. One significant CNV segment was associated with BWG on GGA3 (q-value = 0.00443); one significant CNV segment was associated with BW35 (q-value = 0.00571), BW41 (q-value = 0.00180) and BW42 (q-value = 0.00130) on GGA3, and one significant CNV segment was associated with BW on GGA5 (q-value = 0.00432). All significant CNV segments were verified by qPCR, and a validation rate of 92.59% was observed. These CNV segments are located nearby genes, such as KCNJ11, MyoD1 and SOX6, known to underlie growth and development. Moreover, gene-set analyses revealed terms linked with muscle physiology, cellular processes regulation and potassium channels.
Conclusions: Overall, this CNV-based GWAS study unravels potential candidate genes that may regulate performance traits in chickens. Our findings provide a foundation for future functional studies on the role of specific genes in regulating performance in chickens.
Keywords: CNVs; GWAS; Performance; QTLs; qPCR.
Conflict of interest statement
The authors declare that they have no competing interests.
Figures


Similar articles
-
Genome wide detection of CNV and their association with body size in Danzhou chickens.Poult Sci. 2024 Dec;103(12):104266. doi: 10.1016/j.psj.2024.104266. Epub 2024 Aug 25. Poult Sci. 2024. PMID: 39293262 Free PMC article.
-
Genome-wide association study of copy number variations with shank traits in a F2 crossbred chicken population.Anim Genet. 2024 Aug;55(4):559-574. doi: 10.1111/age.13447. Epub 2024 May 19. Anim Genet. 2024. PMID: 38764135
-
Genome-wide copy number variation (CNV) detection in Nelore cattle reveals highly frequent variants in genome regions harboring QTLs affecting production traits.BMC Genomics. 2016 Jun 13;17:454. doi: 10.1186/s12864-016-2752-9. BMC Genomics. 2016. PMID: 27297173 Free PMC article.
-
Copy Number Variation in Chickens: A Review and Future Prospects.Microarrays (Basel). 2014 Feb 5;3(1):24-38. doi: 10.3390/microarrays3010024. Microarrays (Basel). 2014. PMID: 27605028 Free PMC article. Review.
-
Copy number polymorphism in plant genomes.Theor Appl Genet. 2014 Jan;127(1):1-18. doi: 10.1007/s00122-013-2177-7. Epub 2013 Aug 29. Theor Appl Genet. 2014. PMID: 23989647 Free PMC article. Review.
Cited by
-
Genetic Association Analysis of Copy Number Variations for Meat Quality in Beef Cattle.Foods. 2023 Oct 31;12(21):3986. doi: 10.3390/foods12213986. Foods. 2023. PMID: 37959106 Free PMC article.
-
Fourth Report on Chicken Genes and Chromosomes 2022.Cytogenet Genome Res. 2022;162(8-9):405-528. doi: 10.1159/000529376. Epub 2023 Jan 30. Cytogenet Genome Res. 2022. PMID: 36716736 Free PMC article. Review. No abstract available.
-
Digital Phenotyping: A Game Changer for the Broiler Industry.Animals (Basel). 2023 Aug 10;13(16):2585. doi: 10.3390/ani13162585. Animals (Basel). 2023. PMID: 37627376 Free PMC article. Review.
-
Genetic Architecture of Abdominal Fat Deposition Revealed by a Genome-Wide Association Study in the Laying Chicken.Genes (Basel). 2023 Dec 20;15(1):10. doi: 10.3390/genes15010010. Genes (Basel). 2023. PMID: 38275592 Free PMC article.
-
Genome-wide association studies for economically important traits in mink using copy number variation.Sci Rep. 2024 Jan 2;14(1):24. doi: 10.1038/s41598-023-50497-3. Sci Rep. 2024. PMID: 38167844 Free PMC article.
References
-
- Wolpert L. Much more from the chicken's egg than breakfast--a wonderful model system. Mech Dev. 2004;121(9):1015–7. - PubMed
-
- USDA . Livestock and Poultry: World Markets and Trade. 2020.
-
- Dodgson J, Delany M, Cheng H. Poultry genome sequences: progress and outstanding challenges. Cytogenet Genome Res. 2011;134(1):19–26. - PubMed
MeSH terms
Grants and funding
- 481755/2007-1/Conselho Nacional de Desenvolvimento Científico e Tecnológico
- 407970/2018-5/Conselho Nacional de Desenvolvimento Científico e Tecnológico
- 134211/2019-7/Conselho Nacional de Desenvolvimento Científico e Tecnológico
- 01.11.07.002.04.02/Empresa Brasileira de Pesquisa Agropecuária
- 2014/08704-0/Fundação de Amparo à Pesquisa do Estado de São Paulo
LinkOut - more resources
Full Text Sources
Other Literature Sources
