

Clinical characteristics and longitudinal changes of patients with non-alcoholic fatty liver disease in 2 decades: the NAGALA study
- PMID: 34001028
- PMCID: PMC8130346
- DOI: 10.1186/s12876-021-01809-2
Clinical characteristics and longitudinal changes of patients with non-alcoholic fatty liver disease in 2 decades: the NAGALA study
Abstract
Background: In this study, to clarify the evolving background of people with non-alcoholic fatty liver disease (NAFLD), we compared the current prevalence of NAFLD with that of 2 decades ago.
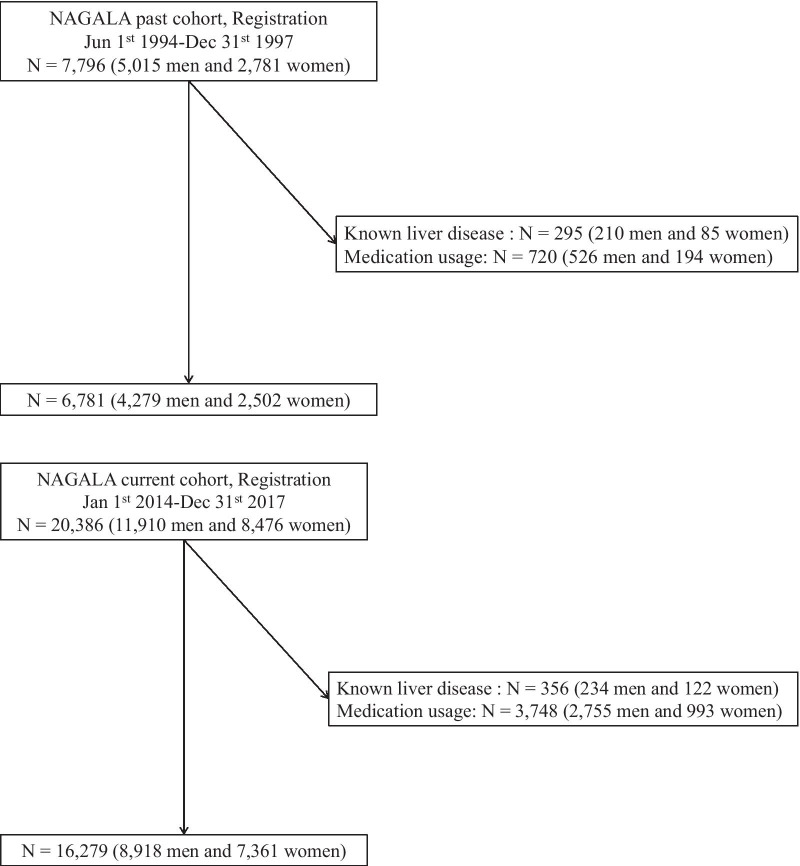
Methods: We included two cohorts. The past cohort was from 1994 to 1997 and included 4279 men and 2502 women. The current cohort was from 2014 to 2017 and included 8918 men and 7361 women. NAFLD was diagnosed by abdominal ultrasonography.
Results: The prevalence of NAFLD increased in both genders throughout these 2 decades (18.5% in the past cohort and 27.1% in the current cohort for men; and 8.0% in the past cohort and 9.4% in the current cohort for women). The prevalence of hyperglycemia increased, whereas the prevalence of low high-density lipoprotein cholesterol levels and hypertriglyceridemia significantly decreased. There was no significant difference in the mean body mass index. Multivariate analysis revealed that the prevalence of obesity and body mass index were significantly associated with the prevalence of NAFLD in both the past and current cohorts.
Conclusions: The incidence of NAFLD significantly increased throughout these 2 decades, and obesity is the most prevalent factor. Thus, body weight management is an essential treatment option for NAFLD.
Keywords: Cohort; Epidemiology; NAFLD; Non-alcoholic fatty liver disease; Trend.
Conflict of interest statement
Y. Hashimoto received grants from Asahi Kasei Corporation outside the submitted work. M. Fukui received grants from AstraZeneca plc, Astellas Pharma Inc., Nippon Boehringer Ingelheim Co., Ltd., Daiichi Sankyo Co., Ltd., Eli Lilly Japan K.K., Kyowa Hakko Kirin Co. Ltd., Kissei Pharmaceutical Co., Ltd., MSD K.K., Mitsubishi Tanabe Pharma Corp., Novo Nordisk Pharma Ltd., Sanwa Kagaku Kenkyusho Co., Ltd., Sanofi K.K., Ono Pharmaceutical Co., Ltd, and Takeda Pharmaceutical Co., Ltd., outside the submitted work. The sponsors were not involved in the study design; in the collection, analysis, interpretation of data; in the writing of this manuscript; or in the decision to submit the article for publication. The authors, their immediate families, and any research foundations with which they are affiliated have not received any financial payments or other benefits from any commercial entity related to the subject of this article. The authors declare that although they are affiliated with a department that is supported financially by pharmaceutical company, the authors received no current funding for this study, and this does not alter their adherence to all the journal policies on sharing data and materials. The other authors have nothing to disclose.
Figures
References
-
- Williams CD, Stengel J, Asike MI, Torres DM, Shaw J, Contreras M, et al. Prevalence of nonalcoholic fatty liver disease and nonalcoholic steatohepatitis among a largely middle-aged population utilizing ultrasound and liver biopsy: a prospective study. Gastroenterology. 2011;140:124–131. doi: 10.1053/j.gastro.2010.09.038. - DOI - PubMed
-
- Radu C, Grigorescu M, Crisan D, Lupsor M, Constantin D, Dina L. Prevalence and associated risk factors of non-alcoholic fatty liver disease in hospitalized patients. J Gastrointestin Liver Dis. 2008;17:255–260. - PubMed
MeSH terms
LinkOut - more resources
Full Text Sources
Other Literature Sources
Medical
Miscellaneous
