. 2021 May 17;13(1):112.
doi: 10.1186/s13148-021-01096-4.

NEFM DNA methylation correlates with immune infiltration and survival in breast cancer

Affiliations

NEFM DNA methylation correlates with immune infiltration and survival in breast cancer

Dandan Li et al. Clin Epigenetics. .

Abstract

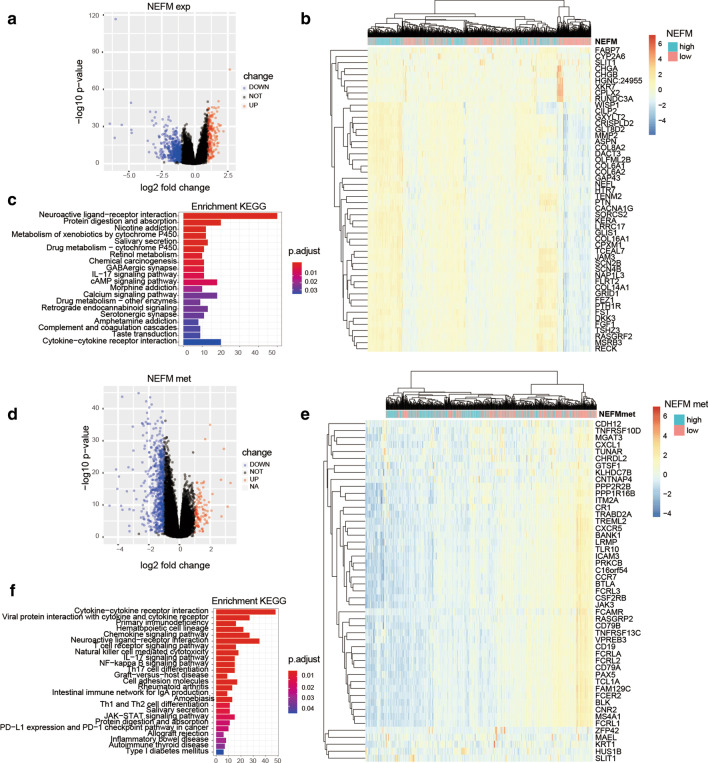
Background: This study aims to determine whether NEFM (neurofilament medium) DNA methylation correlates with immune infiltration and prognosis in breast cancer (BRCA) and to explore NEFM-connected immune gene signature.

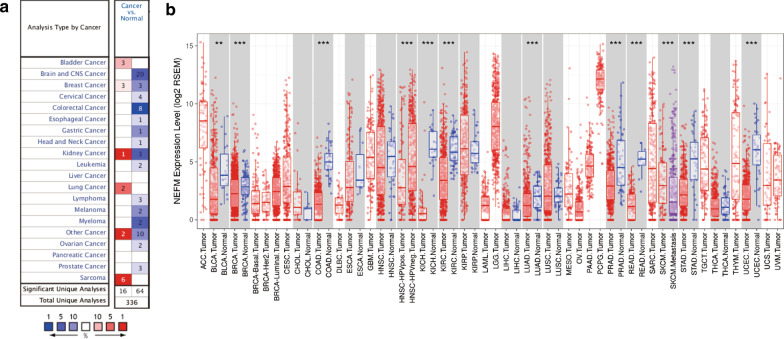
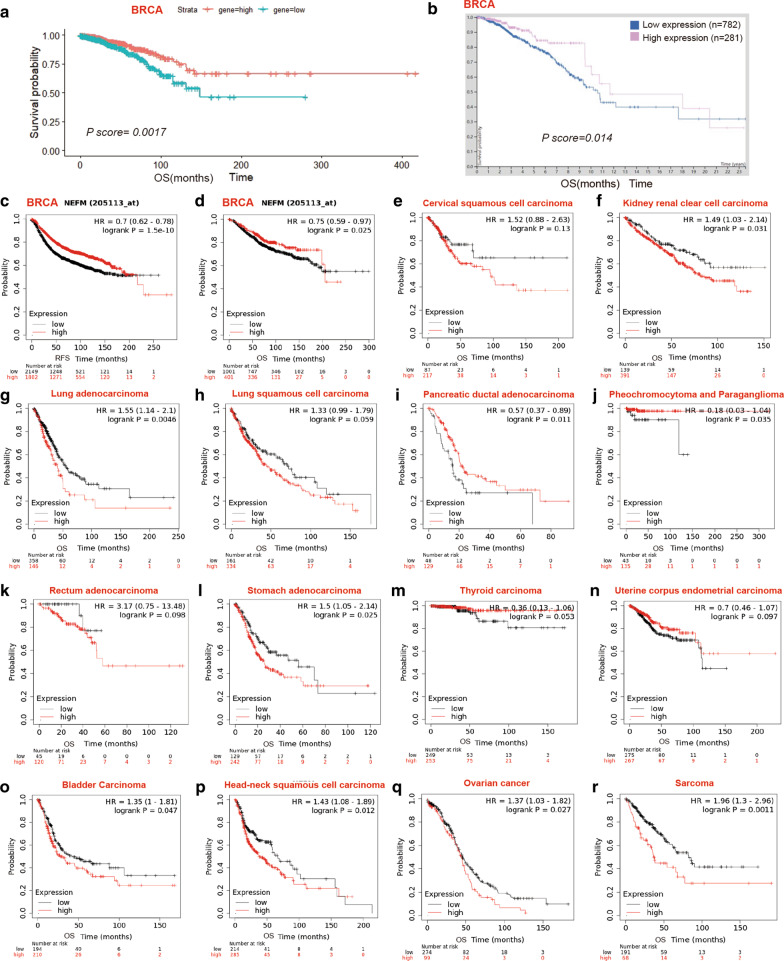
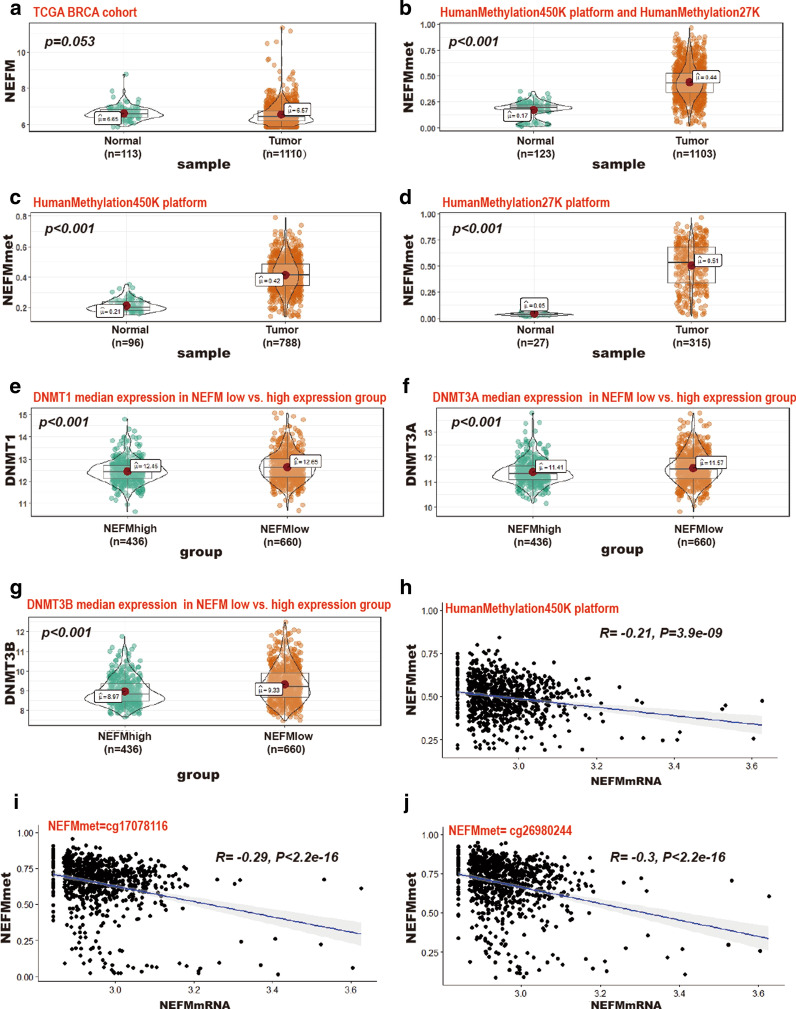
Methods: NEFM transcriptional expression was analyzed in BRCA and normal breast tissues using Oncomine and Tumor Immune Estimation Resource (TIMER) databases. The relationship between NEFM DNA methylation and NEFM transcriptional expression was investigated in TCGA. Potential influence of NEFM DNA methylation/expression on clinical outcome was evaluated using TCGA BRCA, The Human Protein Atlas and Kaplan-Meier plotter databases. Association of NEFM transcriptional expression/DNA methylation with cancer immune infiltration was investigated using TIMER and TISIDB databases.

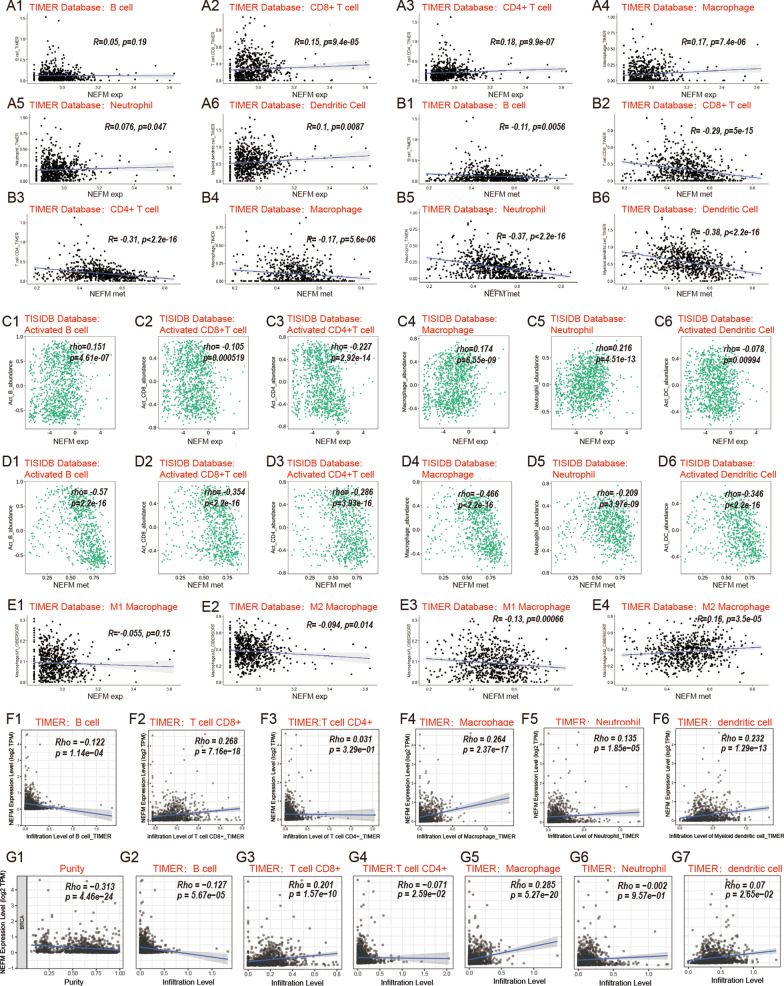
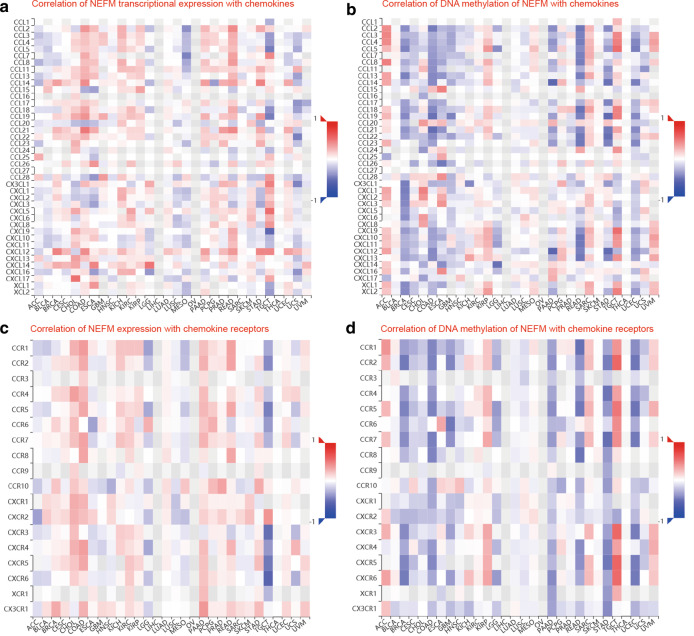
Results: High expression of NEFM correlated with better overall survival (OS) and recurrence-free survival (RFS) in TCGA BRCA and Kaplan-Meier plotter, whereas NEFM DNA methylation with worse OS in TCGA BRCA. NEFM transcriptional expression negatively correlated with DNA methylation. NEFM DNA methylation significantly negatively correlated with infiltrating levels of B, CD8+ T/CD4+ T cells, macrophages, neutrophils and dendritic cells in TIMER and TISIDB. NEFM expression positively correlated with macrophage infiltration in TIMER and TISIDB. After adjusted with tumor purity, NEFM expression weekly negatively correlated with infiltration level of B cells, whereas positively correlated with CD8+ T cell infiltration in TIMER gene modules. NEFM expression/DNA methylation correlated with diverse immune markers in TCGA and TISIDB.

Conclusions: NEFM low-expression/DNA methylation correlates with poor prognosis. NEFM expression positively correlates with macrophage infiltration. NEFM DNA methylation strongly negatively correlates with immune infiltration in BRCA. Our study highlights novel potential functions of NEFM expression/DNA methylation in regulation of tumor immune microenvironment.

Keywords: Breast cancer; DNA methylation; Lymphocytes; NEFM; Prognosis; Tumor-infiltrating.


Conflict of interest statement

Not applicable.

Figures

Fig. 1
Fig. 1
NEFM transcriptional expression levels in different types of human cancers. a Increased or decreased NEFM in different cancers compared with normal tissues in Oncomine database. b Human NEFM transcriptional expression levels in different tumor types from TCGA database as determined by TIMER. (*p < 0.05; **p < 0.01; ***p < 0.001)
Fig. 2
Fig. 2
Kaplan–Meier survival curves of high versus low expression of NEFM in TCGA, Human Protein Atlas and Kaplan–Meier plotter databases. (OS: overall survival; NA: not applicable; RFS: recurrence-free survival). a OS curves of BRCA in TCGA. Low NEFM mRNA expression correlated with poor OS in TCGA_BRCA cohort (median OS: 149 vs. NA months, p = 0.0017). b OS curves of BRCA in Human Protein Atlas database. NEFM protein expression correlated with favorable OS (p = 0.0014). c RFS curves of BRCA in Kaplan–Meier plotter databases (median RFS: 37.8 vs. 69.2 months, p = 1.5e-10). d OS curves of BRCA in Kaplan–Meier plotter databases (median OS: 88.67 vs. 143 months p = 0.025). er. OS curves of pan_cancer in Kaplan–Meier plotter databases. e Cervical squamous cell carcinoma; f kidney renal clear cell carcinoma; g lung adenocarcinoma; h lung squamous cell carcinoma; i pancreatic ductal adenocarcinoma; j pheochromocytoma and paraganglioma; k rectum adenocarcinoma; l stomach adenocarcinoma; m thyroid carcinoma; n uterine corpus endometrial carcinoma; o bladder carcinoma; p head–neck squamous cell carcinoma; q ovarian cancer; r Sarcoma. High NEFM expression correlated with favorable OS of pancreatic ductal adenocarcinoma, pheochromocytoma and paraganglioma, whereas with poor OS of kidney renal clear cell carcinoma, lung adenocarcinoma, stomach adenocarcinoma, bladder carcinoma, head–neck squamous cell carcinoma, ovarian cancer and sarcoma in Kaplan–Meier plotter databases
Fig. 3
Fig. 3
The correlation between NEFM transcriptional expression and DNA methylation of NEFM in TCGA BRCA cohort. a NEFM transcriptional expression was downregulated in BRCA compared with normal breast tissue. bd NEFM DNA methylation was enhanced in BRCA compared with normal breast tissue (b NEFMmet = mean beta value of NEFM DNA methylation using 24 probe of HumanMethylation450K platform and 2 probe of HumanMethylation27K; c NEFMmet = mean beta value of NEFM DNA methylation of HumanMethylation450K platform; d NEFMmet = mean beta value of NEFM DNA methylation of HumanMethylation27K platform). eg Significant higher DNA methyltransferase was connected with NEFM low expression. e DNMT1 median expression 12.65 vs. 12.45 in NEFM low vs. high-expression group, p < 0.001; f DNMT3A median expression 11.57 vs. 11.41 in NEFM low vs. high-expression group, p < 0.001; g DNMT1 median expression 9.33 vs. 8.97 in NEFM low- vs. high-expression group, p < 0.001). hj. DNA methylation of NEFM inversely correlated with NEFM expression. h NEFMmet = log2 mean beta value of NEFM DNA methylation of 24 probe of HumanMethylation450K platform, HR = − 0.21, p = 3.9e−09; i NEFMmet = log2 beta value of cg17078116 probe, HR = − 0.29, p < 2.2e−16; j NEFMmet = log2 beta value of cg26980244 probe, HR = − 0.30, p < 2.2e−16
Fig. 4
Fig. 4
Genes and pathways connected with NEFM transcriptional expression/DNA methylation in TCGA BRCA cohort. a Volcano plot of differentially expressed gene profiles between NEFM high-expression group and NEFM low-expression group (absolute log2 (fold change) > 1, adjp < 0.05). b Expression heatmap of the top 50 NEFM-associated genes. The top curve described NEFM's expression distribution of 1096 BRCA samples. c Bar plot of the NEFM expression_related signaling pathways derived from KEGG Eenrichment analysis. d Volcano plot of differentially expressed gene profiles between NEFM high DNA methylation group and NEFM low DNA methylation group (absolute log2 (fold change) > 1, adjp < 0.05). e Expression heatmap of the top 50 NEFM DNA methylation-associated genes. The top curve described NEFM methylation distribution of 691 BRCA samples. f Bar plot of NEFM methylation-related signaling pathways derived from KEGG enrich analysis
Fig. 5
Fig. 5
Correlation of NEFM transcriptional expression/DNA methylation with immune infiltration levels in BRCA. a NEFM transcriptional expression weakly positively correlated to infiltration levels of CD8 + T cells, CD4 + T cells and macrophages in BRCA in TIMER database by correlation analysis. NEFM expression showed very weak positive association with infiltration levels of neutrophils and dendritic cells in TCGA BRCA in TIMER database (n = 703). b DNA methylation of NEFM had significant negative association with infiltration levels of B cells, CD8 + T cells, CD4 + T cells, macrophages, neutrophils, and dendritic cells in TIMER database by correlation analysis (n = 703). c NEFM expression had weak positive association with infiltration levels of activated B cells, macrophages and moderate positive association with infiltration levels of neutrophils, whereas negative association with infiltration levels of activated CD8 + T cells, activated CD4 + T cells and activated dendritic cells in BRCA in TISIDB database (n = 1100). d DNA methylation of NEFM significantly negatively correlated with infiltration levels of activated B cells, activated CD8 + T cells, activated CD4 + T cells, macrophages, neutrophils, and activated dendritic cells in TISIDB database (n = 785). e NEFM expression weakly negatively correlated with infiltration levels of M2 macrophage; DNA methylation of NEFM negatively correlated with infiltration levels of M1 macrophage whereas positively correlated with infiltration levels of M2 macrophage in TIMER database (n = 703). f NEFM transcriptional expression positively correlated with infiltration levels of CD8 + T cells, macrophages, neutrophils, dendritic cells and negatively correlated with infiltration level of B cells in TIMER gene modules (n = 1100). e After adjusted by tumor purity, NEFM expression weekly negatively correlated with infiltration level of B cell and positively correlated with infiltration levels of macrophages and CD8 + T cells in TIMER gene modules (n = 1100)
Fig. 6
Fig. 6
The correlation of NEFM transcriptional expression/DNA methylation with chemokines and receptors in TISIDB database. a Correlation of NEFM transcriptional expression with chemokines; b correlation of DNA methylation of NEFM with chemokines; c correlation of NEFM expression with chemokine receptors; d correlation of DNA methylation of NEFM with chemokine receptors

Similar articles

Cited by

References

    1. Esteva F, Hubbard-Lucey V, Tang J, Pusztai L. Immunotherapy and targeted therapy combinations in metastatic breast cancer. Lancet Oncol. 2019;20(3):175–186. doi: 10.1016/S1470-2045(19)30026-9. - DOI - PubMed
    1. Jeschke J, Bizet M, Desmedt C, Calonne E, Dedeurwaerder S, Garaud S, et al. DNA methylation-based immune response signature improves patient diagnosis in multiple cancers. J Clin Invest. 2017;127(8):3090–3102. doi: 10.1172/JCI91095. - DOI - PMC - PubMed
    1. Ignatiadis M, Singhal S, Desmedt C, Haibe-Kains B, Criscitiello C, Andre F, et al. Gene modules and response to neoadjuvant chemotherapy in breast cancer subtypes: a pooled analysis. J Clin Oncol. 2012;30(16):1996–2004. doi: 10.1200/JCO.2011.39.5624. - DOI - PubMed
    1. Adams S, Gatti-Mays M, Kalinsky K, Korde L, Sharon E, Amiri-Kordestani L, et al. Current landscape of immunotherapy in breast cancer: a review. JAMA Oncol. 2019;5(8):1205–1214. doi: 10.1001/jamaoncol.2018.7147. - DOI - PMC - PubMed
    1. Schmid P, Adams S, Rugo H, Schneeweiss A, Barrios C, Iwata H, et al. Atezolizumab and nab-paclitaxel in advanced triple-negative breast cancer. N Engl J Med. 2018;379(22):2108–2121. doi: 10.1056/NEJMoa1809615. - DOI - PubMed

Publication types