. 2021 May 17;13(1):83.
doi: 10.1186/s13073-021-00904-z.

An atlas connecting shared genetic architecture of human diseases and molecular phenotypes provides insight into COVID-19 susceptibility

Affiliations

An atlas connecting shared genetic architecture of human diseases and molecular phenotypes provides insight into COVID-19 susceptibility

Liuyang Wang et al. Genome Med. .

Abstract

Background: While genome-wide associations studies (GWAS) have successfully elucidated the genetic architecture of complex human traits and diseases, understanding mechanisms that lead from genetic variation to pathophysiology remains an important challenge. Methods are needed to systematically bridge this crucial gap to facilitate experimental testing of hypotheses and translation to clinical utility.

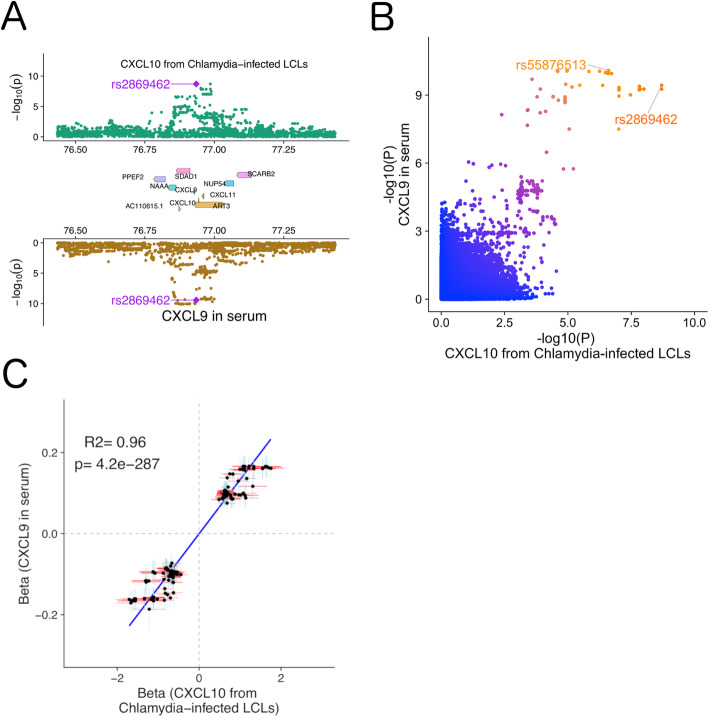
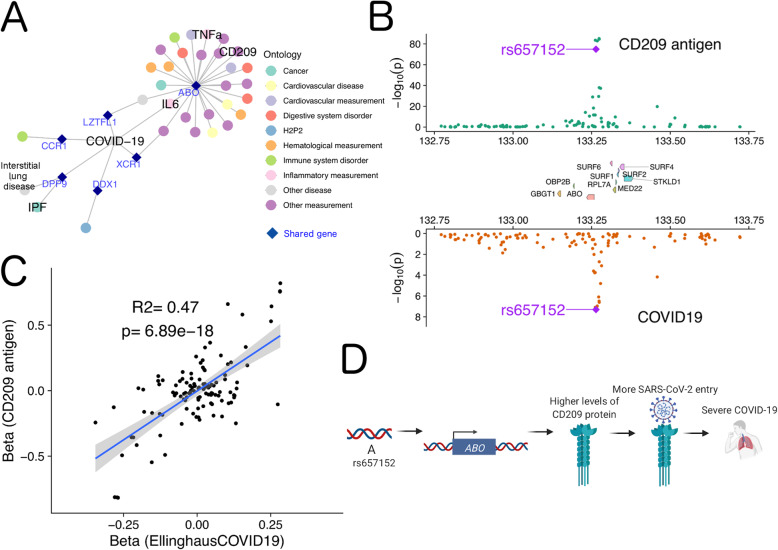
Results: Here, we leveraged cross-phenotype associations to identify traits with shared genetic architecture, using linkage disequilibrium (LD) information to accurately capture shared SNPs by proxy, and calculate significance of enrichment. This shared genetic architecture was examined across differing biological scales through incorporating data from catalogs of clinical, cellular, and molecular GWAS. We have created an interactive web database (interactive Cross-Phenotype Analysis of GWAS database (iCPAGdb)) to facilitate exploration and allow rapid analysis of user-uploaded GWAS summary statistics. This database revealed well-known relationships among phenotypes, as well as the generation of novel hypotheses to explain the pathophysiology of common diseases. Application of iCPAGdb to a recent GWAS of severe COVID-19 demonstrated unexpected overlap of GWAS signals between COVID-19 and human diseases, including with idiopathic pulmonary fibrosis driven by the DPP9 locus. Transcriptomics from peripheral blood of COVID-19 patients demonstrated that DPP9 was induced in SARS-CoV-2 compared to healthy controls or those with bacterial infection. Further investigation of cross-phenotype SNPs associated with both severe COVID-19 and other human traits demonstrated colocalization of the GWAS signal at the ABO locus with plasma protein levels of a reported receptor of SARS-CoV-2, CD209 (DC-SIGN). This finding points to a possible mechanism whereby glycosylation of CD209 by ABO may regulate COVID-19 disease severity.

Conclusions: Thus, connecting genetically related traits across phenotypic scales links human diseases to molecular and cellular measurements that can reveal mechanisms and lead to novel biomarkers and therapeutic approaches. The iCPAGdb web portal is accessible at http://cpag.oit.duke.edu and the software code at https://github.com/tbalmat/iCPAGdb .

Keywords: Colocalization; Cross-phenotype association; Gout; Hi-HOST; Idiopathic pulmonary fibrosis; LD-score; Macular telangiectasia; PheWAS; Pleiotropy; rs12610495; rs2869462; rs505922.


Conflict of interest statement

The authors declare that they have no competing interests.

Figures

Fig. 1
Fig. 1
An improved method for finding shared genetic architecture of human traits. a The overall framework of the iCPAGdb pipeline. GWAS summary statistics (from published GWAS datasets or from user-uploaded GWAS) undergo LD clumping to obtain a lead variant for each signal below a specified p value threshold. These SNPs are queried against an LD proxy database generated from 1000 Genomes African, Asian, or European population to identify cross-phenotype associations through direct overlap or LD proxy at R2 > 0.4. Significance of overlap for each trait pair was calculated using Fisher’s exact test. Outputs can be visualized/downloaded from the iCPAGdb web browser. b Comparison of the number of shared SNPs for each NHGRI-EBI GWAS catalog trait pair identified through direct overlap vs. both direct and indirect (LD-proxy) overlap. c iCPAGdb detected more significant cross-phenotypes associations than CPAG1 at FDR < 0.1. Expansion of the NHGRI-EBI GWAS catalog and improvements in capturing by LD proxy in iCPAGdb fueled a large increase in detected cross-phenotype associations across human traits. Comparisons between CPAG1 and iCPAGdb on the same 2013 dataset are in Additional file 5: Figure S3. d Circle plot of cross-phenotype associations detected by iCPAGdb in the NHGRI-EBI GWAS catalog. After excluding compound phenotypes (phenotypes described by NHGRI-EBI GWAS catalog as > 1 comma-separated phenotype in their ontology), a total of 1709 traits involved in a total of 53314 cross-phenotype associations were left. These were categorized into 17 EFO Parental groups. Inner ribbons link phenotypes connected by cross-phenotype associations with the width of ribbon corresponding to the number of cross-phenotype associations. The axis outside the circle represents the cumulative number of associations for each group vs all other groups. e Comparison of genetic correlation from LD score regression (LDSC) and the Chao-Sorensen similarity index implemented in iCPAG demonstrates significant correlation. The genetic correlation rg of 24 diseases/trait were obtained from [23]. Since Chao-Sorensen values are bounded from 0 to 1 and rg ranges from − 1 to 1, we used the absolute value of rg here. Colored * indicates significant trait-pair for LDSC, iCPAGdb, or both at false discovery rate of 0.1. f A model demonstrating how SNPs regulate uric acid levels to impact the development of kidney stones and gout. g Riverplot of gout cross-phenotype associations generated from iCPAGdb output shows mapped genes associated with gout by GWAS (left) connected with NHGRI-EBI GWAS phenotypes grouped into EFO categories (right; colors are different categories). Cross-phenotype associations include causal connections (such as uric acid levels), comorbid outcomes (such as kidney stones), and regulators of disease (such as alpha-1-antitrypsin levels)
Fig. 2
Fig. 2
iCPAGdb integrates GWAS of different scales to reveal a biological connection between MacTel 2 and serine. a Multi-dataset network of cross-phenotype associations detected by iCPAGdb. Phenotypes that demonstrated significant overlap (FDR ≤0.1) are color-coded in the indicated colors. b Riverplot of macular telangiectasia type 2 (MacTel type 2) cross-phenotype associations generated from iCPAGdb shows mapped genes associated with MacTel type 2 (left) connected with NHGRI-EBI GWAS phenotypes grouped into EFO categories (right; colors are different categories). SNPs in CPS1 and PHGDH are associated with MacTel type 2 and are also associated with serine levels, which are believed to play a causal role in the disease. Other connections may represent causal connections, comorbid outcomes, and regulators of disease. c Cross-phenotype associations connecting MacTel type 2 and serine. One locus demonstrated direct SNP overlap (rs715). A second locus demonstrated indirect overlap based on 4 SNPs in LD as visualized in the heatmap color-coded by LD. d A model for how SNPs regulate serine levels to impact pathogenesis of MacTel type 2 based on iCPAGdb and prior work described in the text
Fig. 3
Fig. 3
Cross-phenotype association analysis reveals the same genetic locus impacts both Chlamydia-induced CXCL10 levels and MIG level in serum. a Regional Miami colocalization plot demonstrates a genetic locus that impacts both CXCL10 level in lymphoblastoid cell lines following Chlamydia trachomatis infection and CXCL9 (MIG) levels in serum. b Comparison of -log10(p value) for GWAS of CXCL10 following C. trachomatis infection and levels of CXCL9 (MIG) in serum. The lead SNP in the region for each phenotype is marked. c Scatter plot demonstrates a highly positive correlation of the effect coefficients of cellular CXCL10 after C. trachomatis infection and of SNPs associated with blood CXCL9 levels. Each dot represents a SNP which has p value < 0.01 for both phenotypes. A total of 413 SNPs from a 4-mb window surrounding the leading SNP rs2869462 was selected. The blue vertical or red horizontal bar shows the standard error of the beta value for each SNP
Fig. 4
Fig. 4
Cross-phenotype association of ABO reveals a possible role for CD209 in severe COVID-19. a A network of genetic associations involving severe COVID-19. Each node represents either a disease/trait (filled circles) or a gene (dark blue diamond). The ABO locus was associated with multiple other diseases and levels of specific proteins, while DPP9 connects COVID-19 only with IPF and interstitial lung disease (idiopathic interstitial pneumonia). b Regional Miami colocalization plot demonstrates the ABO locus impacts both CD209 protein levels and risk of severe COVID-19. c A significant positive correlation for effect size of SNPs in the ABO locus on CD209 protein levels and risk of severe COVID-19. d Model of how ABO may affect CD209 and severe COVID-19
Fig. 5
Fig. 5
Cross-phenotype analysis and COVID-19 patient transcriptomics reveals a role for DPP9 in severe COVID-19. a Lung eQTL data from GTEx shows rs12610495 “G” allele is associated with reduced expression of DPP9. b Regional Miami colocalization plot demonstrates the DPP9 locus impacts both idiopathic pulmonary fibrosis and risk of severe COVID-19. c A significant positive correlation for effect size of SNPs in the DPP9 locus on idiopathic pulmonary fibrosis and risk of severe COVID-19. d Model of how DPP9 may affect idiopathic pulmonary fibrosis and risk of severe COVID-19. e DPP9 expression in peripheral blood is significantly higher in COVID-19 patients (n = 77 samples) compared to healthy (n = 19) and bacteria-infected patients (n = 23). The p values were calculated using the Wilcoxon rank-sum test. f COVID-19 patients demonstrate significantly higher DPP9 expression compared to healthy controls during early (days 1–10; n = 19 samples), middle (days 11–20; n = 36), and late (21+ days; n=22) stages of SARS-CoV-2 infection. The p values were calculated using the Wilcoxon rank-sum test. g DPP9 demonstrates increased expression during recovery from COVID-19. A total of 11 patients were measured sequentially at enrollment (day 0), day 7, and day 14. The colored dash line connects measurements from the same patient across time points. p value was calculated using Friedman test. h Decreased symptom severity scores of COVID-19 patients over time. The eleven subjects in G were assessed for symptom severity at days 0, 7, and 14. The colored dash line connects measurements from the same patient across time points. p value was calculated using Friedman test

Update of

References

    1. Visscher PM, Wray NR, Zhang Q, Sklar P, McCarthy MI, Brown MA, et al. 10 years of GWAS discovery: biology, function, and translation. Am J Hum Genet. 2017;101(1):5–22. doi: 10.1016/j.ajhg.2017.06.005. - DOI - PMC - PubMed
    1. Bycroft C, Freeman C, Petkova D, Band G, Elliott LT, Sharp K, Motyer A, Vukcevic D, Delaneau O, O’Connell J, Cortes A, Welsh S, Young A, Effingham M, McVean G, Leslie S, Allen N, Donnelly P, Marchini J. The UK Biobank resource with deep phenotyping and genomic data. Nature. 2018;562(7726):203–209. doi: 10.1038/s41586-018-0579-z. - DOI - PMC - PubMed
    1. McCarty CA, Chisholm RL, Chute CG, Kullo IJ, Jarvik GP, Larson EB, et al. The eMERGE Network: a consortium of biorepositories linked to electronic medical records data for conducting genomic studies. BMC Med Genomics. 2011;4(1):13. doi: 10.1186/1755-8794-4-13. - DOI - PMC - PubMed
    1. Bulik-Sullivan BK, Loh PR, Finucane HK, Ripke S, Yang J, Schizophrenia Working Group of the Psychiatric Genomics C et al. LD Score regression distinguishes confounding from polygenicity in genome-wide association studies. Nat Genet. 2015;47(3):291–295. doi: 10.1038/ng.3211. - DOI - PMC - PubMed
    1. Lee SH, Yang J, Goddard ME, Visscher PM, Wray NR. Estimation of pleiotropy between complex diseases using single-nucleotide polymorphism-derived genomic relationships and restricted maximum likelihood. Bioinformatics. 2012;28(19):2540–2542. doi: 10.1093/bioinformatics/bts474. - DOI - PMC - PubMed

Publication types