. 2021 May 25;118(21):e2002486118.
doi: 10.1073/pnas.2002486118.

Pharmacological inhibition of PI5P4Kα/β disrupts cell energy metabolism and selectively kills p53-null tumor cells

Affiliations

Pharmacological inhibition of PI5P4Kα/β disrupts cell energy metabolism and selectively kills p53-null tumor cells

Song Chen et al. Proc Natl Acad Sci U S A. .

Erratum in

Abstract

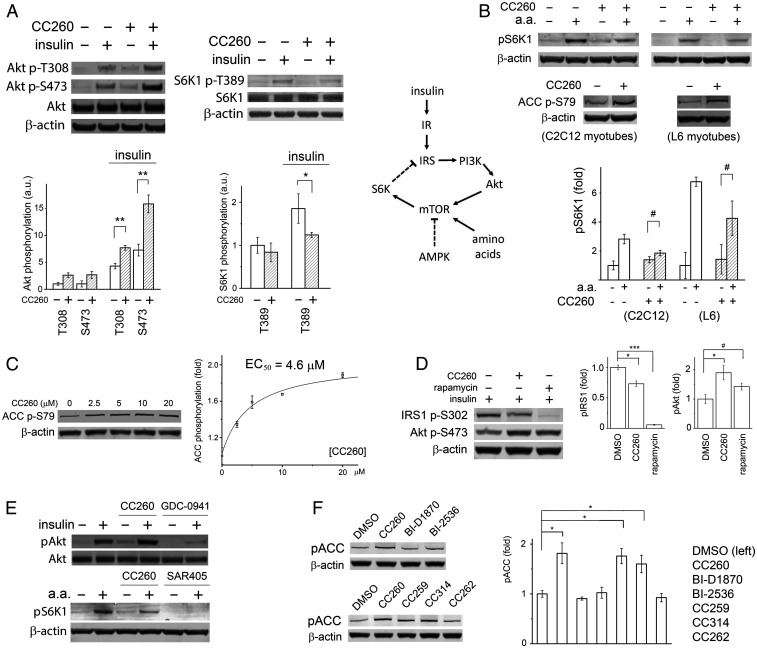
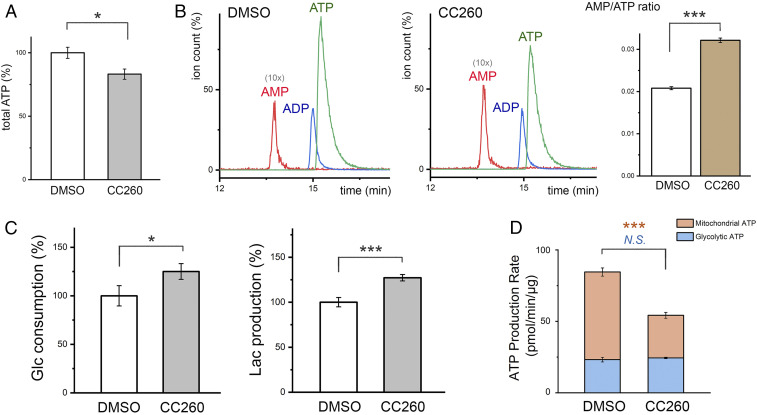
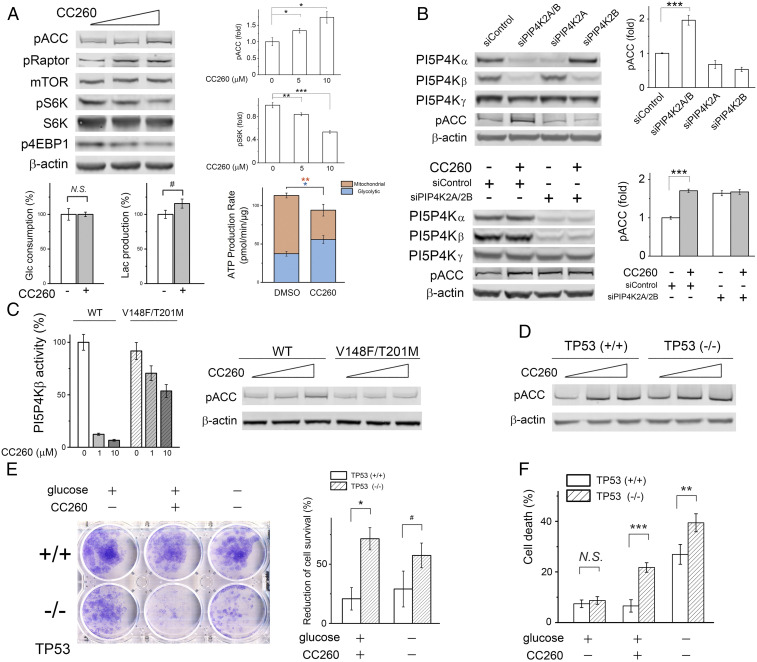
Most human cancer cells harbor loss-of-function mutations in the p53 tumor suppressor gene. Genetic experiments have shown that phosphatidylinositol 5-phosphate 4-kinase α and β (PI5P4Kα and PI5P4Kβ) are essential for the development of late-onset tumors in mice with germline p53 deletion, but the mechanism underlying this acquired dependence remains unclear. PI5P4K has been previously implicated in metabolic regulation. Here, we show that inhibition of PI5P4Kα/β kinase activity by a potent and selective small-molecule probe disrupts cell energy homeostasis, causing AMPK activation and mTORC1 inhibition in a variety of cell types. Feedback through the S6K/insulin receptor substrate (IRS) loop contributes to insulin hypersensitivity and enhanced PI3K signaling in terminally differentiated myotubes. Most significantly, the energy stress induced by PI5P4Kαβ inhibition is selectively toxic toward p53-null tumor cells. The chemical probe, and the structural basis for its exquisite specificity, provide a promising platform for further development, which may lead to a novel class of diabetes and cancer drugs.

Keywords: chemical biology; lipid kinase; p53; pip4k; synthetic lethality.


Conflict of interest statement

The authors declare no competing interest.

Figures

Fig. 1.
Fig. 1.
Hit molecules with a 2-amino-dihydropteridinone core. (A) The chemical structures of the hit molecules and their Kis for PI5P4Kα (shown in the parentheses). The core structure of palbociclib is slightly different but engages in similar hydrogen-bonding interactions with the kinase. (B) Michaelis–Menten curves obtained at different BI-D1870 concentrations (based on ADP-Glo measurement of relative luminescence unit, or RLU; Left). BI-D1870 displaces a bound fluorescent ATP analog from PI5P4Kα, which provides an independent measurement of its Kd (RFU, relative fluorescence unit; Right) (66). (C) Difference Fourier analysis confirms inhibitor binding to the ATP-binding pocket of PI5P4Kα. Fo-Fc maps, contoured at 3σ, are shown in green. Red spheres represent water. The cyclohexane piperazine side chain of volasertib is largely disordered. (D) Key binding interactions exemplified by the crystal structure of PI5P4Kα in complex with BI-D1870. Hydrogen bonds are shown as dashed lines with distance labeled (italic). The numbering system for pteridine is also shown.
Fig. 2.
Fig. 2.
Potent and selective lipid kinase inhibitors. (A) Comparing the binding of BI-2536 to polo-like kinase 1 (PDB: 2RKU) and PI5P4Kα. The kinked αC helix as well as the absence of a conserved salt bridge create a pocket in the lipid kinase adjacent to the C7 side chain of the bound inhibitor (indicated by the red asterisk). (B) The chemical structures of the compounds used in the biological experiments. The Ki values for PI5P4Kα and PI5P4Kβ are shown in the parentheses. (C) Concentration-inhibition curves of CC260 (red) and BI-D1870 (black) for PI5P4Kα and PI5P4Kβ based on measurements of 32P-labled PI(4,5)P2 resolved by TLC. ATP concentration was fixed at 20 μM in both experiments (Km,ATP for PI5P4Kα is 13 μM; Km,ATP for PI5P4Kβ is 17 μM). (D) Difference Fourier analysis confirmed the binding of CC260 to the active site of PI5P4Kβ. Fo-Fc map, shown in green, was contoured at 3σ. Red spheres represent water.
Fig. 3.
Fig. 3.
PI5P4K inhibition activates AMPK in myotubes. (A) CC260 enhanced insulin-induced Akt phosphorylation at both Thr-308 and Ser-473 but suppressed S6K phosphorylation by mTORC1. C2C12 myotubes were treated with 10 μM CC260 in a serum-free DMEM overnight before being stimulated by 15 nM insulin for 30 min (n = 3). (B) mTORC1 receives major inputs from growth factors through the PI3K/Akt pathway, amino acids, AMPK, stress, and hypoxia (the latter two not shown in the simplified diagram) (44). IR, insulin receptor; IRS, insulin receptor substrate. In both C2C12 and L6 myotubes, CC260 did not prevent amino acids from activating mTORC1. The myotubes were treated with 10 μM CC260 overnight in serum- and amino acid–free media before being transferred to serum-free media with amino acids and cultured for an additional 30 min (n = 3). (C) CC260 activated AMPK in a dose-dependent manner. C2C12 myotubes were treated with various concentrations of CC260 in a serum-free DMEM overnight before Western blot analysis (n = 3). The y-axis represents the effect (fold change) of the compound on ACC phosphorylation relative to DMSO control. (D) Enhanced Akt phosphorylation correlated with reduced IRS1 phosphorylation at Ser-302, caused by either CC260 or rapamycin treatment. C2C12 myotubes were treated with either 10 μM CC260 (overnight) or 10 nM rapamycin (1 h) and then stimulated with 15 nM insulin for 30 min (n = 3). (E) PI3K-α inhibitor GDC-0941 eliminated insulin-induced Akt phosphorylation at Ser-473. Vps34 inhibitor SAR405 prevented mTORC1 activation by amino acids. CC260 had neither of these effects. Although CC260 reduced S6K phosphorylation in myotubes, it did not inhibit mTOR/FRAP1 from the protein kinase panel. C2C12 myotubes were treated with 10 μM CC260 or 1 μM GDC-0941 overnight before being stimulated by 15 nM insulin for 30 min (n = 3). C2C12 myotubes were treated with 10 μM CC260 or 10 μM SAR405 overnight in an amino acid–free medium before being transferred to a standard medium with amino acids for 30 min (n = 3). (F) Parent compounds BI-D1870 and BI-2536, and control compound CC262, did not increase ACC phosphorylation, whereas CC259 and CC260, equipotent toward PI5P4Kα and PI5P4Kβ, and CC314, more specific for PI5P4Kβ, activated AMPK. C2C12 myotubes were treated with 10 μM compound overnight in serum-free media before Western blot analysis (n = 3). Quantifications of the Western blots are shown as means ± SEM, * indicates P ≤ 0.01, ** indicates P ≤ 0.001, *** indicates P ≤ 0.0001, and # indicates P ≤ 0.05 based on Student’s t test.
Fig. 4.
Fig. 4.
PI5P4K inhibition perturbs energy metabolism. (A) Total cellular ATP measured using a luminescent ATP detection assay kit (Abcam) and normalized against total protein concentration. C2C12 myotubes were treated with 10 μM CC260 overnight before the assay (n = 3). (B) Levels of intracellular AMP, ADP, and ATP measured by LC-MS/MS. The elution profiles of the control and compound-treated samples are scaled according to total ATP determined by the luminescent assay. The AMP peak is shown as 10 times the actual height for easier visualization. C2C12 myotubes were treated with 10 μM CC260 overnight before nucleotide extraction (n = 3). AMP/ATP ratio was measured in triplicate. (C) After 16 h, glucose concentrations in the media were reduced by 2.3 and 2.9 mM for cultured C2C12 myotubes treated with DMSO or 10 μM CC260, respectively (n = 3). Lactate accumulated to 3.2 and 4.0 mM (∼70% of the consumed glucose was used for fermentation). The lactate in each well (∼300 μg) is several times greater in mass than the cells (total protein ∼50 μg), suggesting that it is mainly derived from glycolysis. (D) Metabolic flux analysis quantifying mitochondrial and glycolytic ATP production rates (n = 16). Results are shown as means ± SEM, * indicates P ≤ 0.01, and *** indicates P ≤ 0.0001 based on Student’s t test. N.S., nonstatistically significant.
Fig. 5.
Fig. 5.
PI5P4K inhibition reduces tumor cell survival. (A) CC260 (0, 5, and 10 μM) caused AMPK activation and mTORC1 inhibition in BT474 cells after overnight treatment in DMEM without serum (n = 4). To measure glucose consumption and lactate production, BT474 cells were cultured in DMEM without serum for 24 h (the medium did not contain pyruvate). In DMSO control, glucose concentration decreased by 7.0 mM, and the final lactate concentration was 11.9 mM (∼85% of the consumed glucose was used for lactate fermentation). With 10 μM CC260, glucose decreased by 7.0 mM while lactate accumulated to 13.8 mM (∼99% used for fermentation) (n = 3). Mitochondrial and glycolytic ATP production rates were shown as means ± SEM (n = 16). (B) Simultaneous knockdown of PI5P4Kα and PI5P4Kβ by siRNA caused AMPK activation. Oligo “siControl” is of random sequence. After 1 d of transfection, BT474 cells were transferred to an siRNA-free DMEM with 10% fetal bovine serum and cultured for 2 more days before Western blot analysis (n = 4). CC260 did not cause further AMPK activation when PI5P4Kα and PI5P4Kβ were both knocked down by siRNA (n = 3). After transfection, BT474 cells were treated with 10 μM CC260 overnight before Western blot analysis. (C) AMPK activation was abrogated in BT474 cells expressing a refractory PI5P4Kβ double mutant. Cells were treated with compound (0, 5, and 10 μM) overnight in serum-free DMEM. (Left) Comparing the in vitro activities of wild-type and mutant PI5P4Kβ at different inhibitor concentrations (n = 3). (D) CC260 caused AMPK activation in both p53+/+ and p53−/− MCF-10A cells. (E) CC260 or glucose starvation (12 h) was selectively toxic toward p53−/− cells, causing a greater reduction of the number of proliferative cells in the clonogenic assay. The area covered by the cell was quantified, and the percentage decrease was based on comparison with p53+/+ and p53−/− cells without compound treatment or glucose starvation, respectively (n = 3). (F) After overnight CC260 (10 μM) treatment or glucose starvation in serum-free DMEM/F12 medium supplemented with 0.5 μg/mL hydrocortisone, 100 ng/mL cholera toxin, and 10 μg/mL insulin, the dead cells were measured by propidium iodide staining (n = 6). Results are shown as means ± SEM, * indicates P ≤ 0.01, ** indicates P ≤ 0.001, *** indicates P ≤ 0.0001, and # indicates P ≤ 0.05 based on Student’s t test. N.S., nonstatistically significant.

Similar articles

Cited by

References

    1. Berridge M. J., Irvine R. F., Inositol phosphates and cell signalling. Nature 341, 197–205 (1989). - PubMed
    1. Cantley L. C., The phosphoinositide 3-kinase pathway. Science 296, 1655–1657 (2002). - PubMed
    1. Di Paolo G., De Camilli P., Phosphoinositides in cell regulation and membrane dynamics. Nature 443, 651–657 (2006). - PubMed
    1. Ling L. E., Schulz J. T., Cantley L. C., Characterization and purification of membrane-associated phosphatidylinositol-4-phosphate kinase from human red blood cells. J. Biol. Chem. 264, 5080–5088 (1989). - PubMed
    1. Bazenet C. E., Ruano A. R., Brockman J. L., Anderson R. A., The human erythrocyte contains two forms of phosphatidylinositol-4-phosphate 5-kinase which are differentially active toward membranes. J. Biol. Chem. 265, 18012–18022 (1990). - PubMed

Publication types

MeSH terms

Substances