. 2021 May 25;118(21):e2022713118.
doi: 10.1073/pnas.2022713118.

Genomic basis of parallel adaptation varies with divergence in Arabidopsis and its relatives

Affiliations

Genomic basis of parallel adaptation varies with divergence in Arabidopsis and its relatives

Magdalena Bohutínská et al. Proc Natl Acad Sci U S A. .

Abstract

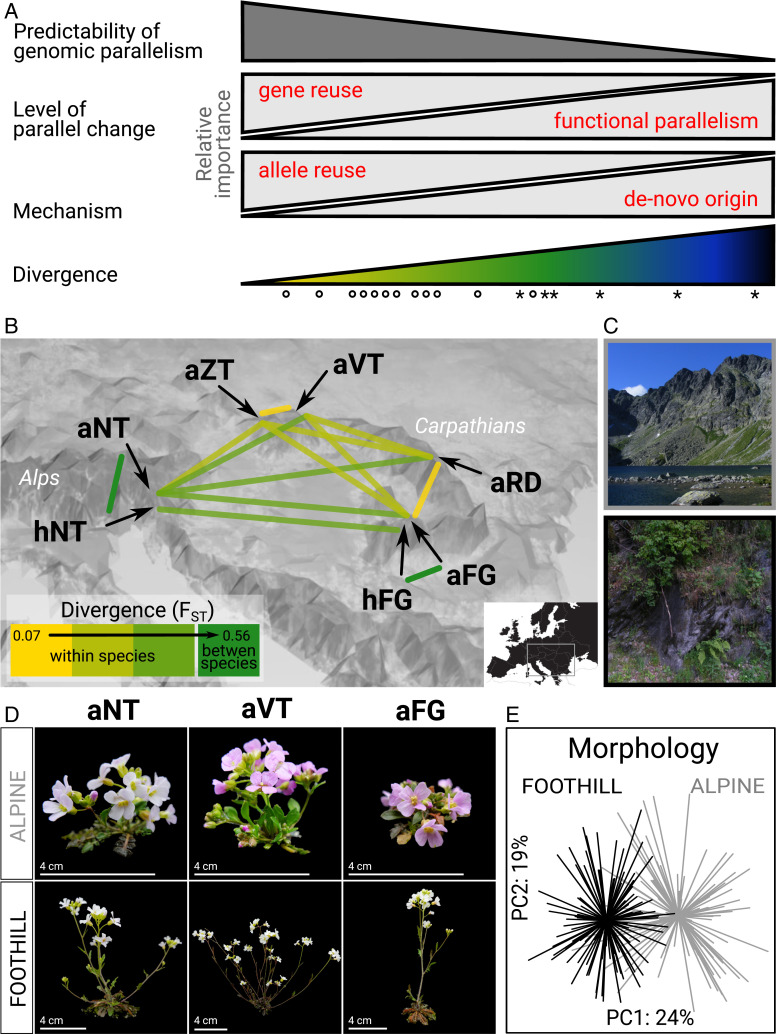
Parallel adaptation provides valuable insight into the predictability of evolutionary change through replicated natural experiments. A steadily increasing number of studies have demonstrated genomic parallelism, yet the magnitude of this parallelism varies depending on whether populations, species, or genera are compared. This led us to hypothesize that the magnitude of genomic parallelism scales with genetic divergence between lineages, but whether this is the case and the underlying evolutionary processes remain unknown. Here, we resequenced seven parallel lineages of two Arabidopsis species, which repeatedly adapted to challenging alpine environments. By combining genome-wide divergence scans with model-based approaches, we detected a suite of 151 genes that show parallel signatures of positive selection associated with alpine colonization, involved in response to cold, high radiation, short season, herbivores, and pathogens. We complemented these parallel candidates with published gene lists from five additional alpine Brassicaceae and tested our hypothesis on a broad scale spanning ∼0.02 to 18 My of divergence. Indeed, we found quantitatively variable genomic parallelism whose extent significantly decreased with increasing divergence between the compared lineages. We further modeled parallel evolution over the Arabidopsis candidate genes and showed that a decreasing probability of repeated selection on the same standing or introgressed alleles drives the observed pattern of divergence-dependent parallelism. We therefore conclude that genetic divergence between populations, species, and genera, affecting the pool of shared variants, is an important factor in the predictability of genome evolution.

Keywords: Arabidopsis; alpine adaptation; evolution; genomics; parallelism.


Conflict of interest statement

The authors declare no competing interest.

Figures

Fig. 1.
Fig. 1.
Hypotheses regarding relationships between genomic parallelism and divergence and the Arabidopsis system used to address these hypotheses. (A) Based on our literature review, we propose that genetically closer lineages adapt to a similar challenge more frequently by gene reuse, sampling suitable variants from the shared pool (allele reuse), which makes their adaptive evolution more predictable. Color ramp symbolizes rising divergence between the lineages (∼0.02 to 18 Mya in this study); the symbols denote different divergence levels tested here using resequenced genomes of 22 Arabidopsis populations (circles) and meta-analysis of candidates in Brassicaceae (asterisks). (B) Spatial arrangement of lineages of varying divergence (neutral FST; bins only aid visualization; all tests were performed on a continuous scale) encompassing parallel alpine colonization within the two Arabidopsis outcrossers from central Europe: A. arenosa (diploid: aVT; autotetraploid: aNT, aZT, aRD, and aFG) and A. halleri (diploid: hNT and hFG). Note that only two of the ten between-species pairs (dark green) are shown to aid visibility. The color scale corresponds to the left part of the color ramp used in A. (C) Photos of representative alpine and foothill habitat. (D) Representative phenotypes of originally foothill and alpine populations grown in common garden demonstrating phenotypic convergence. Scale bar corresponds to 4 cm. (E) Morphological differentiation among 223 A. arenosa individuals originating from foothill (black) and alpine (gray) populations from four regions after two generations in a common garden. Principal component analysis was run using 16 morphological traits taken from ref. .
Fig. 2.
Fig. 2.
Physiological responses to alpine stresses in A. arenosa and A. halleri, identified based on functional annotation of parallel gene candidates (circle) and signatures of parallel directional selection at the corresponding loci (surrounding dotplots). The circle scheme is based on the annotated list of 151 parallel gene candidates (Dataset S2) and corresponding enriched GO terms within the biological process category (Dataset S3). For purposes of functional interpretation and visualization, we also classified the enriched GO terms in the context of major alpine stressors following ref. , and list a subset of corresponding 47 well-annotated parallel gene candidates in the outer circle. For the complete list of all genes, refer to Dataset S2, and for more details on functional interpretations, refer to SI Appendix, Text S3. Dotplots show allele frequency difference (AFD) at SNPs between foothill and alpine populations summed over all lineages showing a parallel differentiation in a given gene (blue arrow). The lineage names are listed on the sides. Loci with two independently differentiated haplotypes likely representing independent de novo mutations (AT5G65750 and ATL12) are represented by peaks of black and gray dots, corresponding with the two parallel lineages. Red circles highlight nonsynonymous variants.
Fig. 3.
Fig. 3.
Variation in gene and function-level parallelism and their relationship with divergence in A. arenosa and A. halleri (AD) and across species from Brassicaceae family (E and F). (A and B) Number of overlapping candidate genes (A) and functions (B; enriched GO terms) for alpine adaptation colored by increasing divergence between the compared lineages. Only overlaps of >2 genes and >1 function are shown (for a complete overview, refer to Datasets S4–S7). Numbers in the bottom-right corner of each panel show the total number of candidates in each lineage. Categories indicated by an asterisk exhibited higher than random overlap of the candidates (P < 0.05, Fisher’s exact test). For lineage codes, see Fig. 1B. Categories with overlap over more than two lineages are framed in bold and filled by a gradient. (C and D) Proportions of parallel genes (C; gene reuse) and functions (D) among all candidates identified within each pair of lineages (dot) binned into categories of increasing divergence (bins correspond to Fig. 1B and only aid visualization; size of the dot corresponds to the number of parallel items). Significance of the association was inferred by Mantel test over continuous divergence scale. (E and F) Same as A and B but for species from Brassicaceae family, spanning higher divergence levels. Codes: aar: our data on A. arenosa; ahe: our data on A. halleri combined with A. halleri candidates from Swiss Alps (39); ahj: Arabidopsis halleri subsp. gemmifera from Japan (38); aly: A. lyrata from Northern Europe (40); ath: A. thaliana from Alps (43); chi: Crucihimalaya himalaica (42); and lme: Lepidium meyenii (41).
Fig. 4.
Fig. 4.
Decreasing probability of allele reuse with increasing divergence in A.arenosa and A. halleri. (A) Proportion of parallel candidate gene variants shared via gene flow between alpine populations from different lineages or recruited from ancestral standing variation (together describing the probability of allele reuse) and originated by independent de novo mutations within the same gene. Percentages represent mean proportions for lineages of a particular divergence category (color ramp; total number of parallel gene candidates is given within each plot). (B) Explained variation in gene reuse between lineages partitioned by divergence (green circle), allele reuse (orange circle), and shared components (overlaps between them). (C) Maximum composite log-likelihood estimate (MCLE) of median time (generations) for which the allele was standing in the populations prior to the onset of selection. (DF) Examples of SNP variation and MCL estimation of the evolutionary scenario describing the origin of parallel candidate allele. Two lineages in light and dark gray are compared in each plot. Shown is the entire region of each parallel candidate gene. (D) Parallel selection on variation shared via gene flow on gene ALA3, affecting vegetative growth and acclimation to temperature stresses (87). (E) Parallel recruitment of shared ancestral standing variation at gene AL730950, encoding heat shock protein. (F) Parallel selection on independent de novo mutations at gene PKS1, regulating phytochrome B signaling (88); here, de novo origin was prioritized over standing variation model based on very high MCLE of standing time (Materials and Methods). Note that each sweep includes multiple highly differentiated nonsynonymous SNPs (in C and D at the same positions in both population pairs, in line with reuse of the same allele). Dotplot (left y-axis): AFD between foothill and alpine population from each of the two lineages (range 0 to 1 in all plots). Lines (right y-axis): MCL difference from a neutral model assuming no parallel selection (all values above dotted gray line show the difference, higher values indicate higher support for the nonneutral model, and the final model selection is based on the genomic position with the highest likelihood within the gene).

Similar articles

Cited by

References

    1. Blount Z. D., Lenski R. E., Losos J. B., Contingency and determinism in evolution: Replaying life’s tape. Science 362, eaam5979 (2018). - PubMed
    1. Gould S. J., Wonderful Life : The Burgess Shale and the Nature of History (Norton, 1989).
    1. Agrawal A. A., Toward a predictive framework for convergent evolution: Integrating natural history, genetic mechanisms, and consequences for the diversity of Life. Am. Nat. 190 (S1), S1–S12 (2017). - PubMed
    1. Stern D. L., Orgogozo V., Is genetic evolution predictable? Science 323, 746–751 (2009). - PMC - PubMed
    1. Farhat M. R., et al. ., Genomic analysis identifies targets of convergent positive selection in drug-resistant Mycobacterium tuberculosis. Nat. Genet. 45, 1183–1189 (2013). - PMC - PubMed

Publication types

MeSH terms