. 2021 May 25;118(21):e2024446118.
doi: 10.1073/pnas.2024446118.

Gut microbiome contributions to altered metabolism in a pig model of undernutrition

Affiliations

Gut microbiome contributions to altered metabolism in a pig model of undernutrition

Hao-Wei Chang et al. Proc Natl Acad Sci U S A. .

Abstract

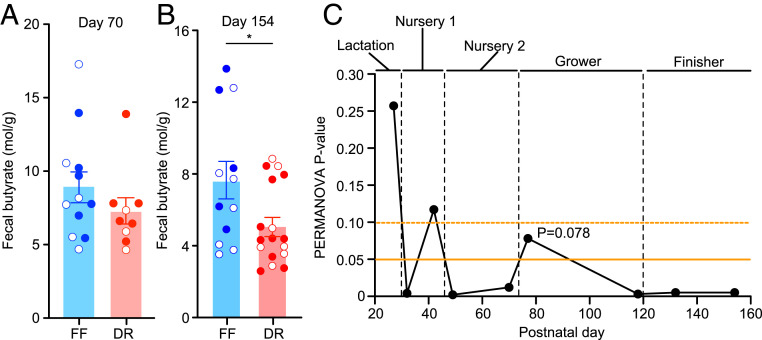
The concept that gut microbiome-expressed functions regulate ponderal growth has important implications for infant and child health, as well as animal health. Using an intergenerational pig model of diet restriction (DR) that produces reduced weight gain, we developed a feature-selection algorithm to identify representative characteristics distinguishing DR fecal microbiomes from those of full-fed (FF) pigs as both groups consumed a common sequence of diets during their growth cycle. Gnotobiotic mice were then colonized with DR and FF microbiomes and subjected to controlled feeding with a pig diet. DR microbiomes have reduced representation of genes that degrade dominant components of late growth-phase diets, exhibit reduced production of butyrate, a key host-accessible energy source, and are causally linked to reduced hepatic fatty acid metabolism (β-oxidation) and the selection of alternative energy substrates. The approach described could aid in the development of guidelines for microbiome stewardship in diverse species, including farm animals, in order to support their healthy growth.

Keywords: carbohydrate-active enzymes; feature selection/information theory; gut microbiome; malnutrition; metabolic regulation.


Conflict of interest statement

Competing interest statement: J.I.G. is a cofounder and N.P.M. is an employee of Matatu, Inc., a company characterizing the role of microbiota development and diet-by-microbiome interactions in animal health. This study received no funding from Matatu, Inc. No experimental or computational methods or datasets arising from this project were provided to Matatu, Inc., nor was any intellectual property belonging to Matatu, Inc. used in these studies. H-W.C., M.C.H., D.O., J.C., V.L., B.H., O.I., M.J.M., C.B.N., and M.J.B. are not affiliated with and do not receive financial support from Matatu. J.O. has conducted experimental animal trials for Matatu under research service agreements with his University (NCSU).

Figures

Fig. 1.
Fig. 1.
Applying diet restriction to sows and their offspring. (A) Experimental design. (BD) Weights at birth (B), postnatal day 28 (C), and from postnatal days 28 to 154 (D). Mean values ± SEM are shown. (E) Weight difference between FF and DR pigs. (F) Plasma IGF1 levels measured at the end of each dietary phase (postnatal day indicated in parenthesis). Open and closed circles distinguish the two litters within the DR and FF treatment groups (n = 17 and 13 animals, respectively). *P < 0.05; **P < 0.01; ***P < 0.005; ****P < 0.001 (Mann–Whitney U test in B, C, and F; linear mixed-effects model [treatment and time set as fixed effects and animals as the random effect] in D).
Fig. 2.
Fig. 2.
Effects of diet and diet restriction on fecal butyrate and fecal CAZyme gene abundances. (A and B) Fecal levels of butyrate measured at postnatal days 70 (A) and 154 (B). Open and closed circles indicate litter membership for each treatment group. Mean values ± SEM, are shown. *P < 0.05 (Mann–Whitney U test). (C) P values of PERMANOVA tests of DR versus FF microbiome configurations projected on PCA plots based on the abundances of information-rich CAZymes. Fecal samples collected at the indicated time points from both litters in each treatment group were included in the analysis.
Fig. 3.
Fig. 3.
The representation of information-rich CAZymes in the fecal microbiomes of DR versus FF animals as a function of diet and time. CAZymes associated with degradation of cellulose (A) and starch (BD), and sucrose metabolism (E and F). Gene numbers in the microbiome datasets are noted as are the corresponding CAZyme annotations. Mean values ± SEM are plotted. *P < 0.05; **P < 0.01; ***P < 0.005 (unpaired t test). CPM: read counts per million.
Fig. 4.
Fig. 4.
Metabolic phenotyping of DR and FF pigs. (AF) Plasma metabolites. Open and closed circles distinguish the two litters within the FF and DR treatment groups. Mean values ±SEM are plotted. *P < 0.05; ***P < 0.005; ****P < 0.001 (Mann–Whitney U test).
Fig. 5.
Fig. 5.
Functional characterization of the fecal microbiomes of DR and FF pigs in gnotobiotic mice. (A) Design of the ad libitum feeding experiment. Germ-free C57BL/6J mice (n = 6 per arm) were colonized at 4.5 wk of age with a representative fecal microbiome from a postnatal day 154 DR or FF pig. Mice were fed the pig finisher diet ad libitum for 21 d and were then killed after a 4-h fast. (B and C) Butyrate levels in cecal contents (B) and fecal samples (C) quantified by GC-MS. (D) Cecal glucose levels measured by LC-QQQ-MS. (E) Design of the controlled feeding experiment. Germ-free C57BL/6J mice (n = 6 per arm) were colonized at 4.5 wk of age with the same representative DR and FF microbiomes used in the ad libitum study. Both groups were subjected to a controlled feeding regimen where all animals in both groups were given the same amount of pig finisher diet each day for 17 d. Mice were then killed following a 4-h fast. (F and G) Levels of cecal (F) and fecal (G) butyrate. (HJ) Levels of cecal glucose (H), taurocholic acid (I), and amino acids (J). (K) Serum triglycerides. (L and M) Liver acylCoA and acylcarnitine concentrations. (N) Lactate concentration in gastrocnemius muscle. *P < 0.05; **P < 0.01; ***P < 0.005 (Mann–Whitney U test).

References

    1. World Health Organization , Global nutrition report. https://www.who.int/nutrition/globalnutritionreport/en/. Accessed 23 November 2020.
    1. Bartz S., et al. ., Severe acute malnutrition in childhood: Hormonal and metabolic status at presentation, response to treatment, and predictors of mortality. J. Clin. Endocrinol. Metab. 99, 2128–2137 (2014). - PMC - PubMed
    1. Giallourou N., et al. ., Metabolic maturation in the first 2 years of life in resource-constrained settings and its association with postnatal growths. Sci. Adv. 6, eaay5969 (2020). - PMC - PubMed
    1. Subramanian S., et al. ., Persistent gut microbiota immaturity in malnourished Bangladeshi children. Nature 510, 417–421 (2014). - PMC - PubMed
    1. Gehrig J. L., et al. ., Effects of microbiota-directed foods in gnotobiotic animals and undernourished children. Science 365, eaau4732 (2019). - PMC - PubMed

Publication types

MeSH terms

LinkOut - more resources