. 2021 May 17;5(5):322-335.
doi: 10.4049/immunohorizons.2100011.

One-Stop Serum Assay Identifies COVID-19 Disease Severity and Vaccination Responses

Affiliations

One-Stop Serum Assay Identifies COVID-19 Disease Severity and Vaccination Responses

Natalie S Haddad et al. Immunohorizons. .

Abstract

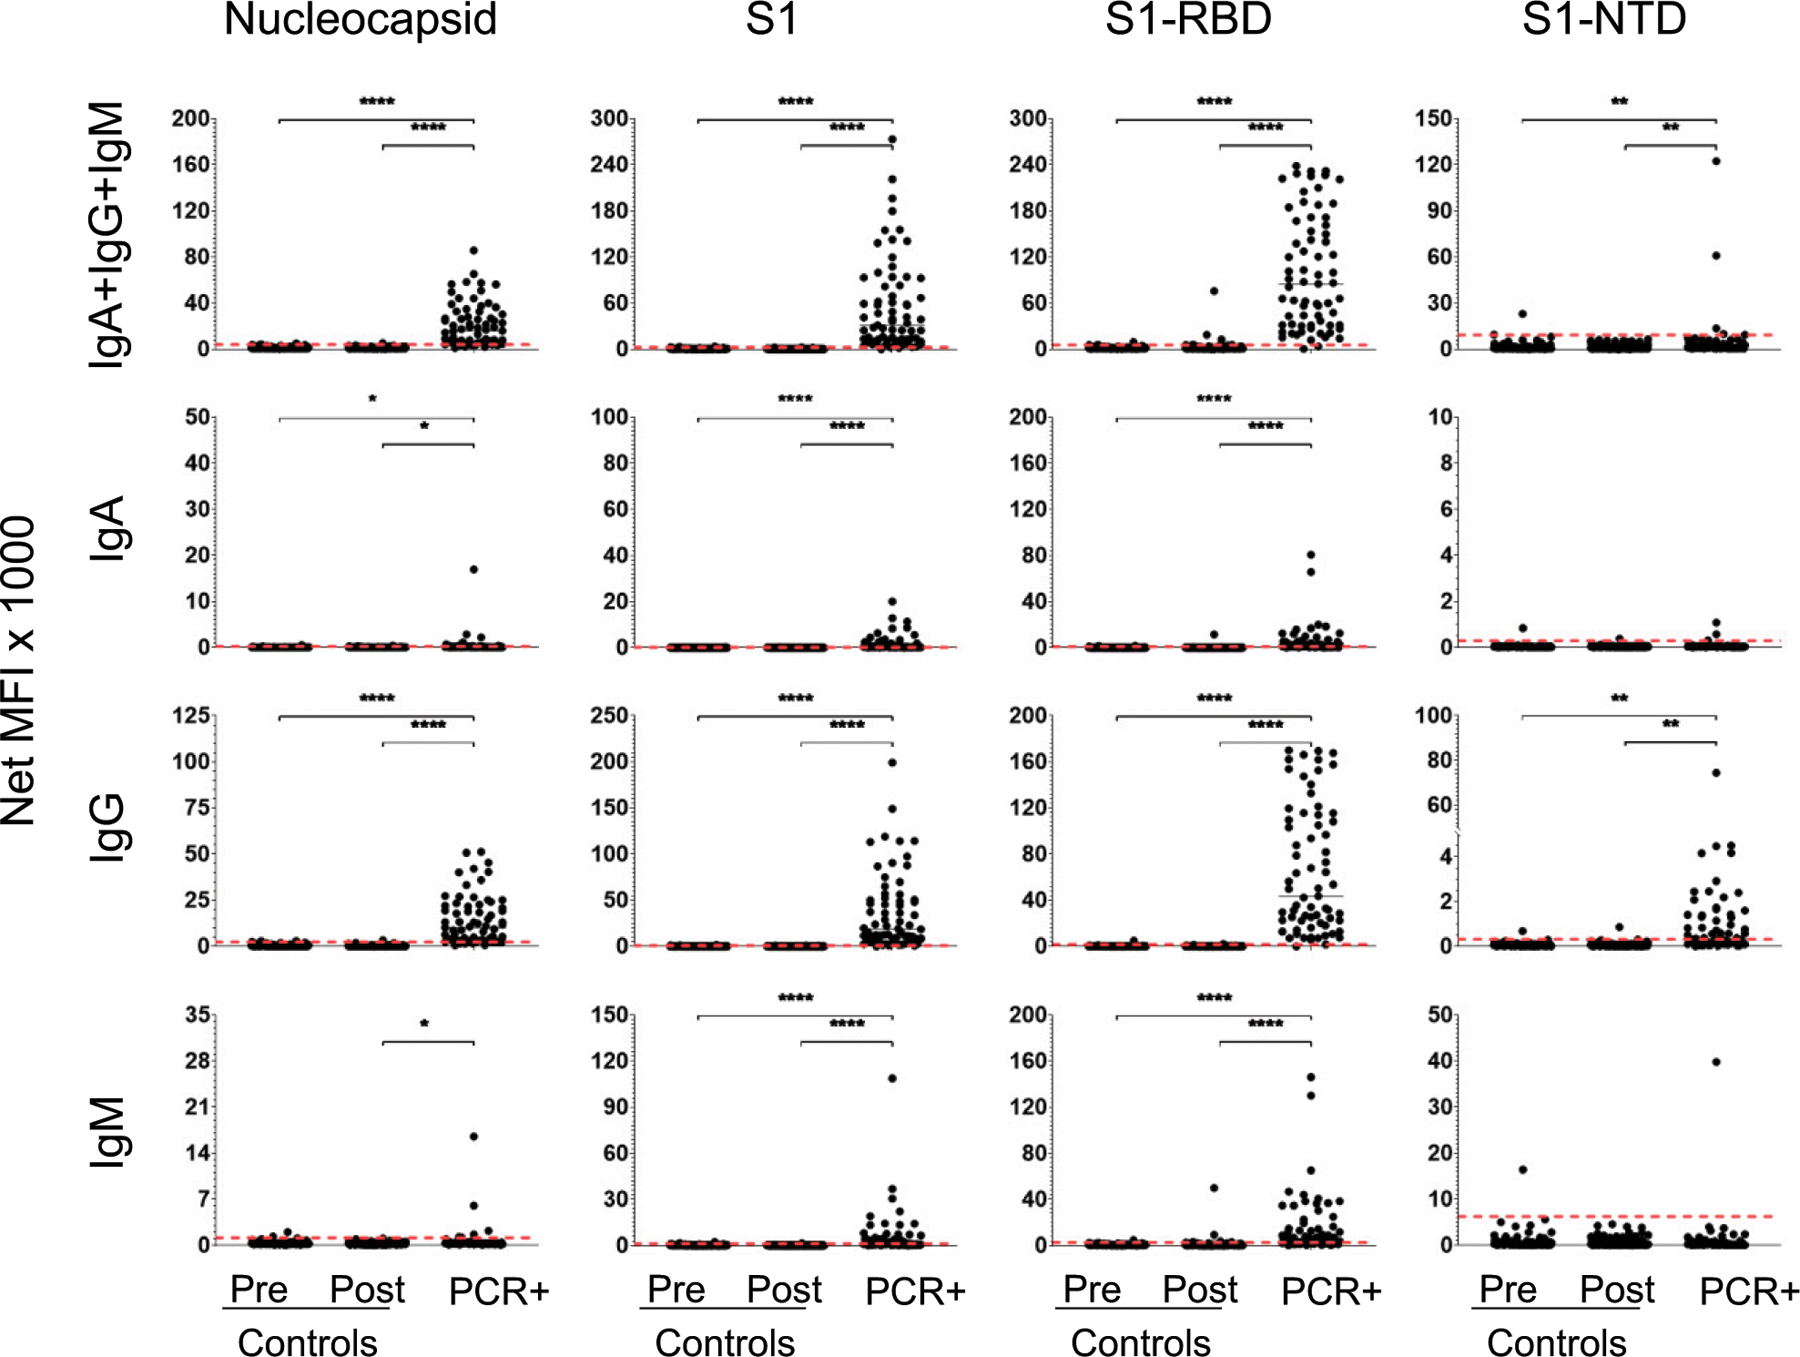
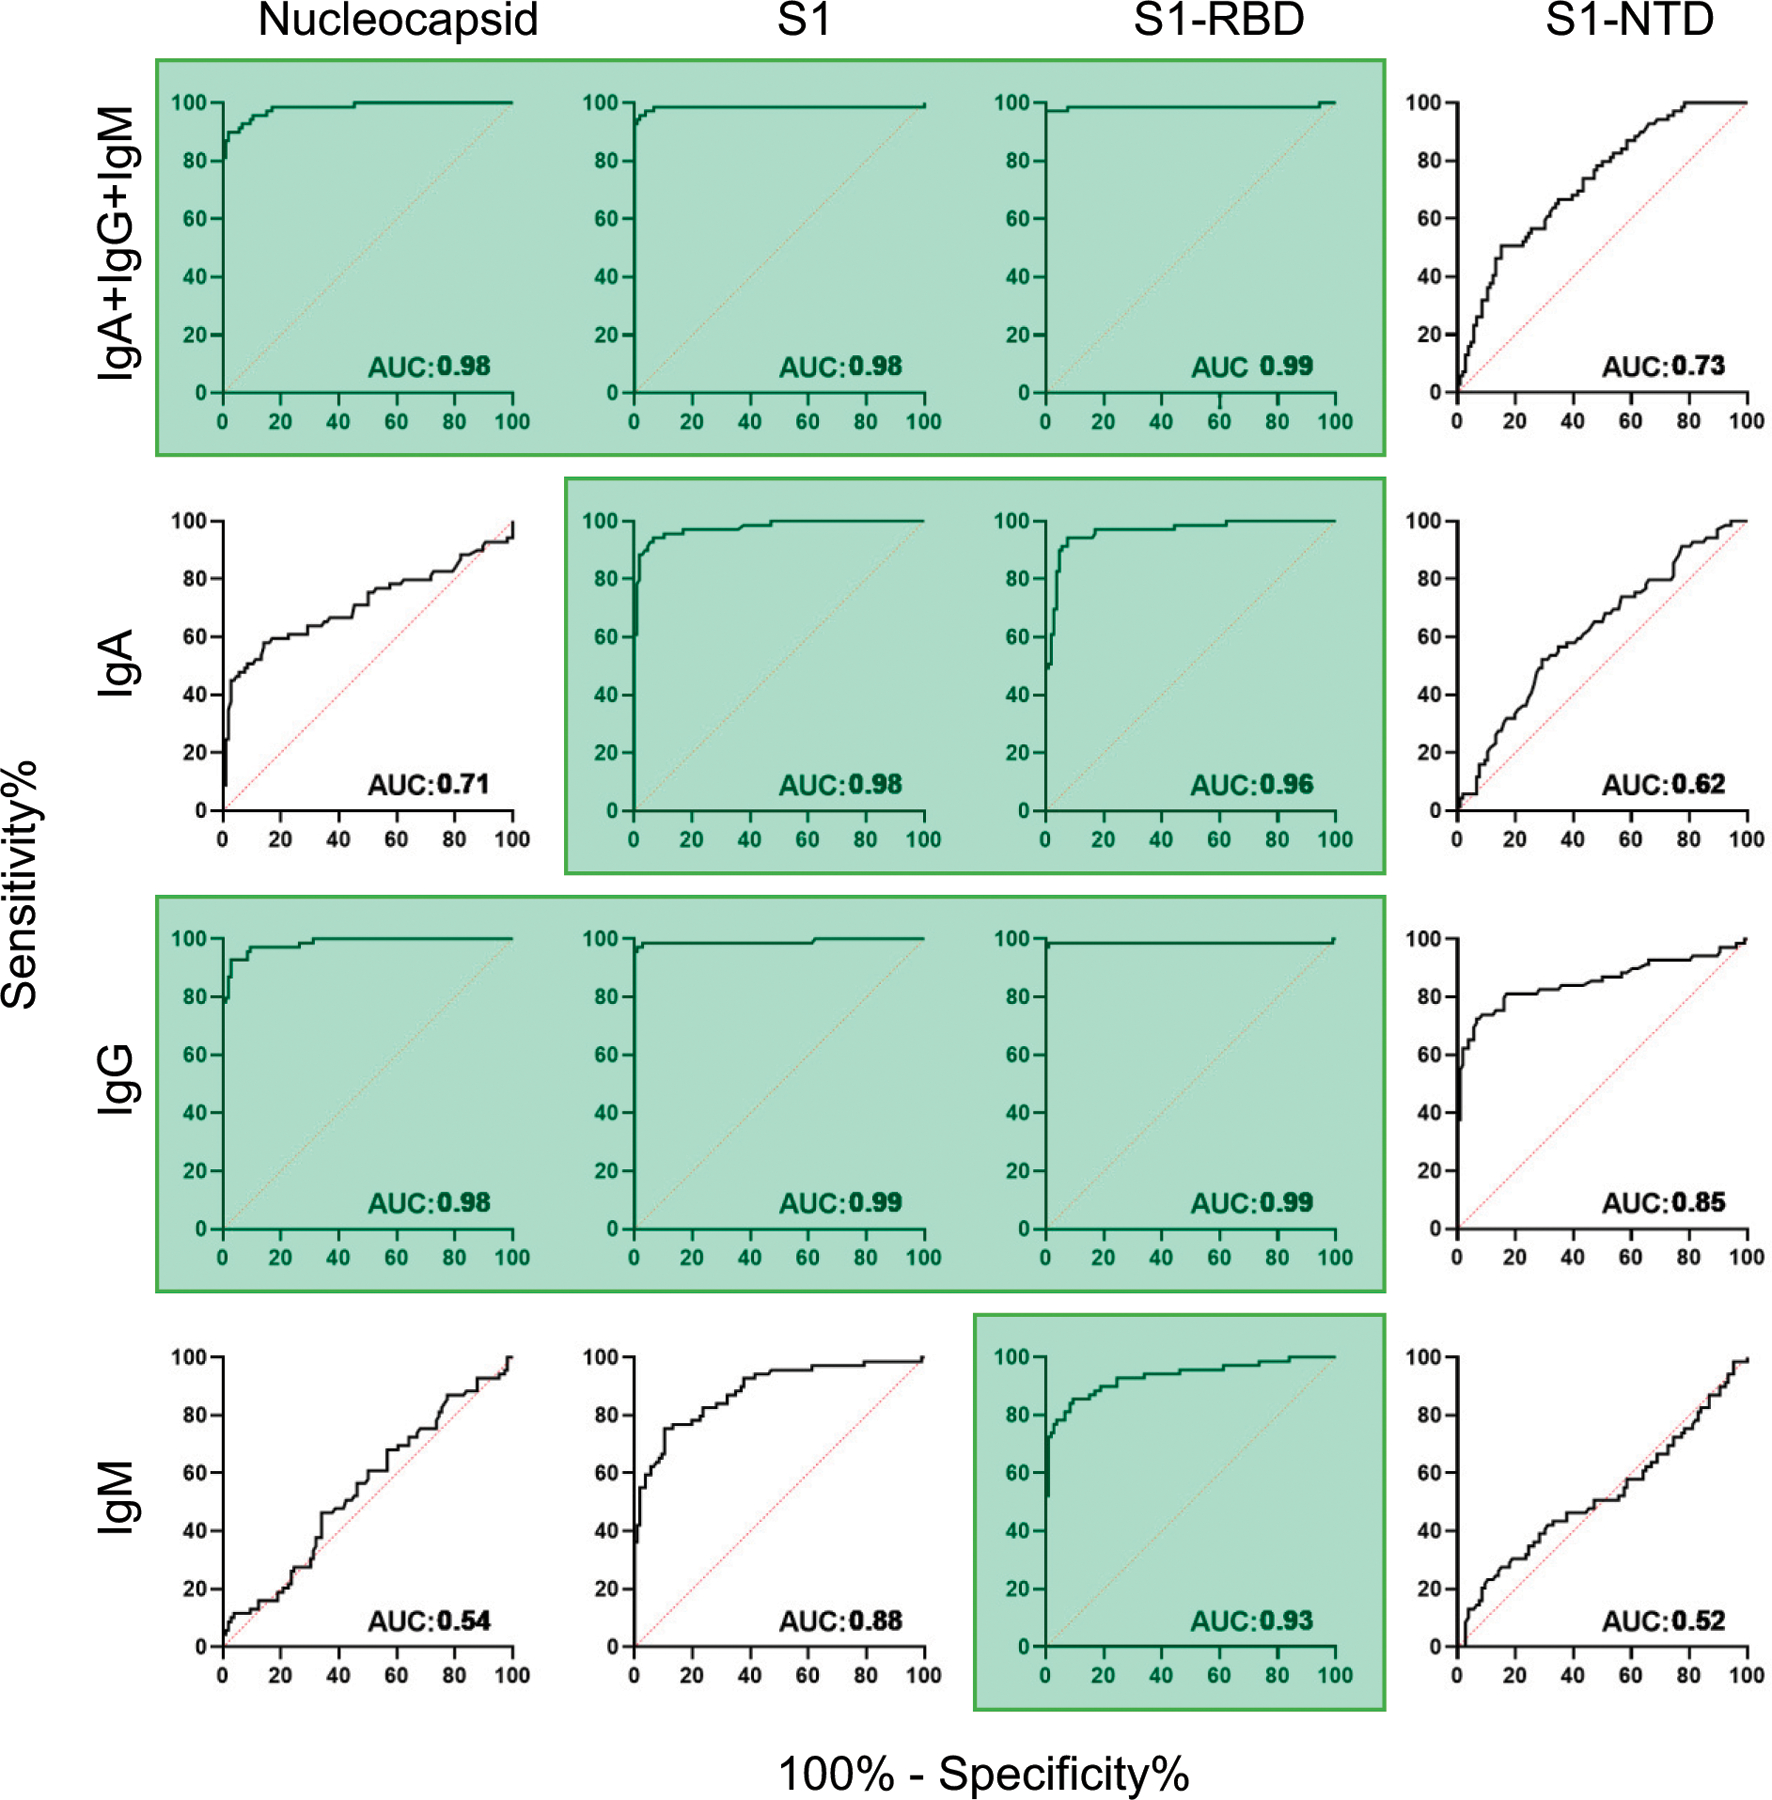
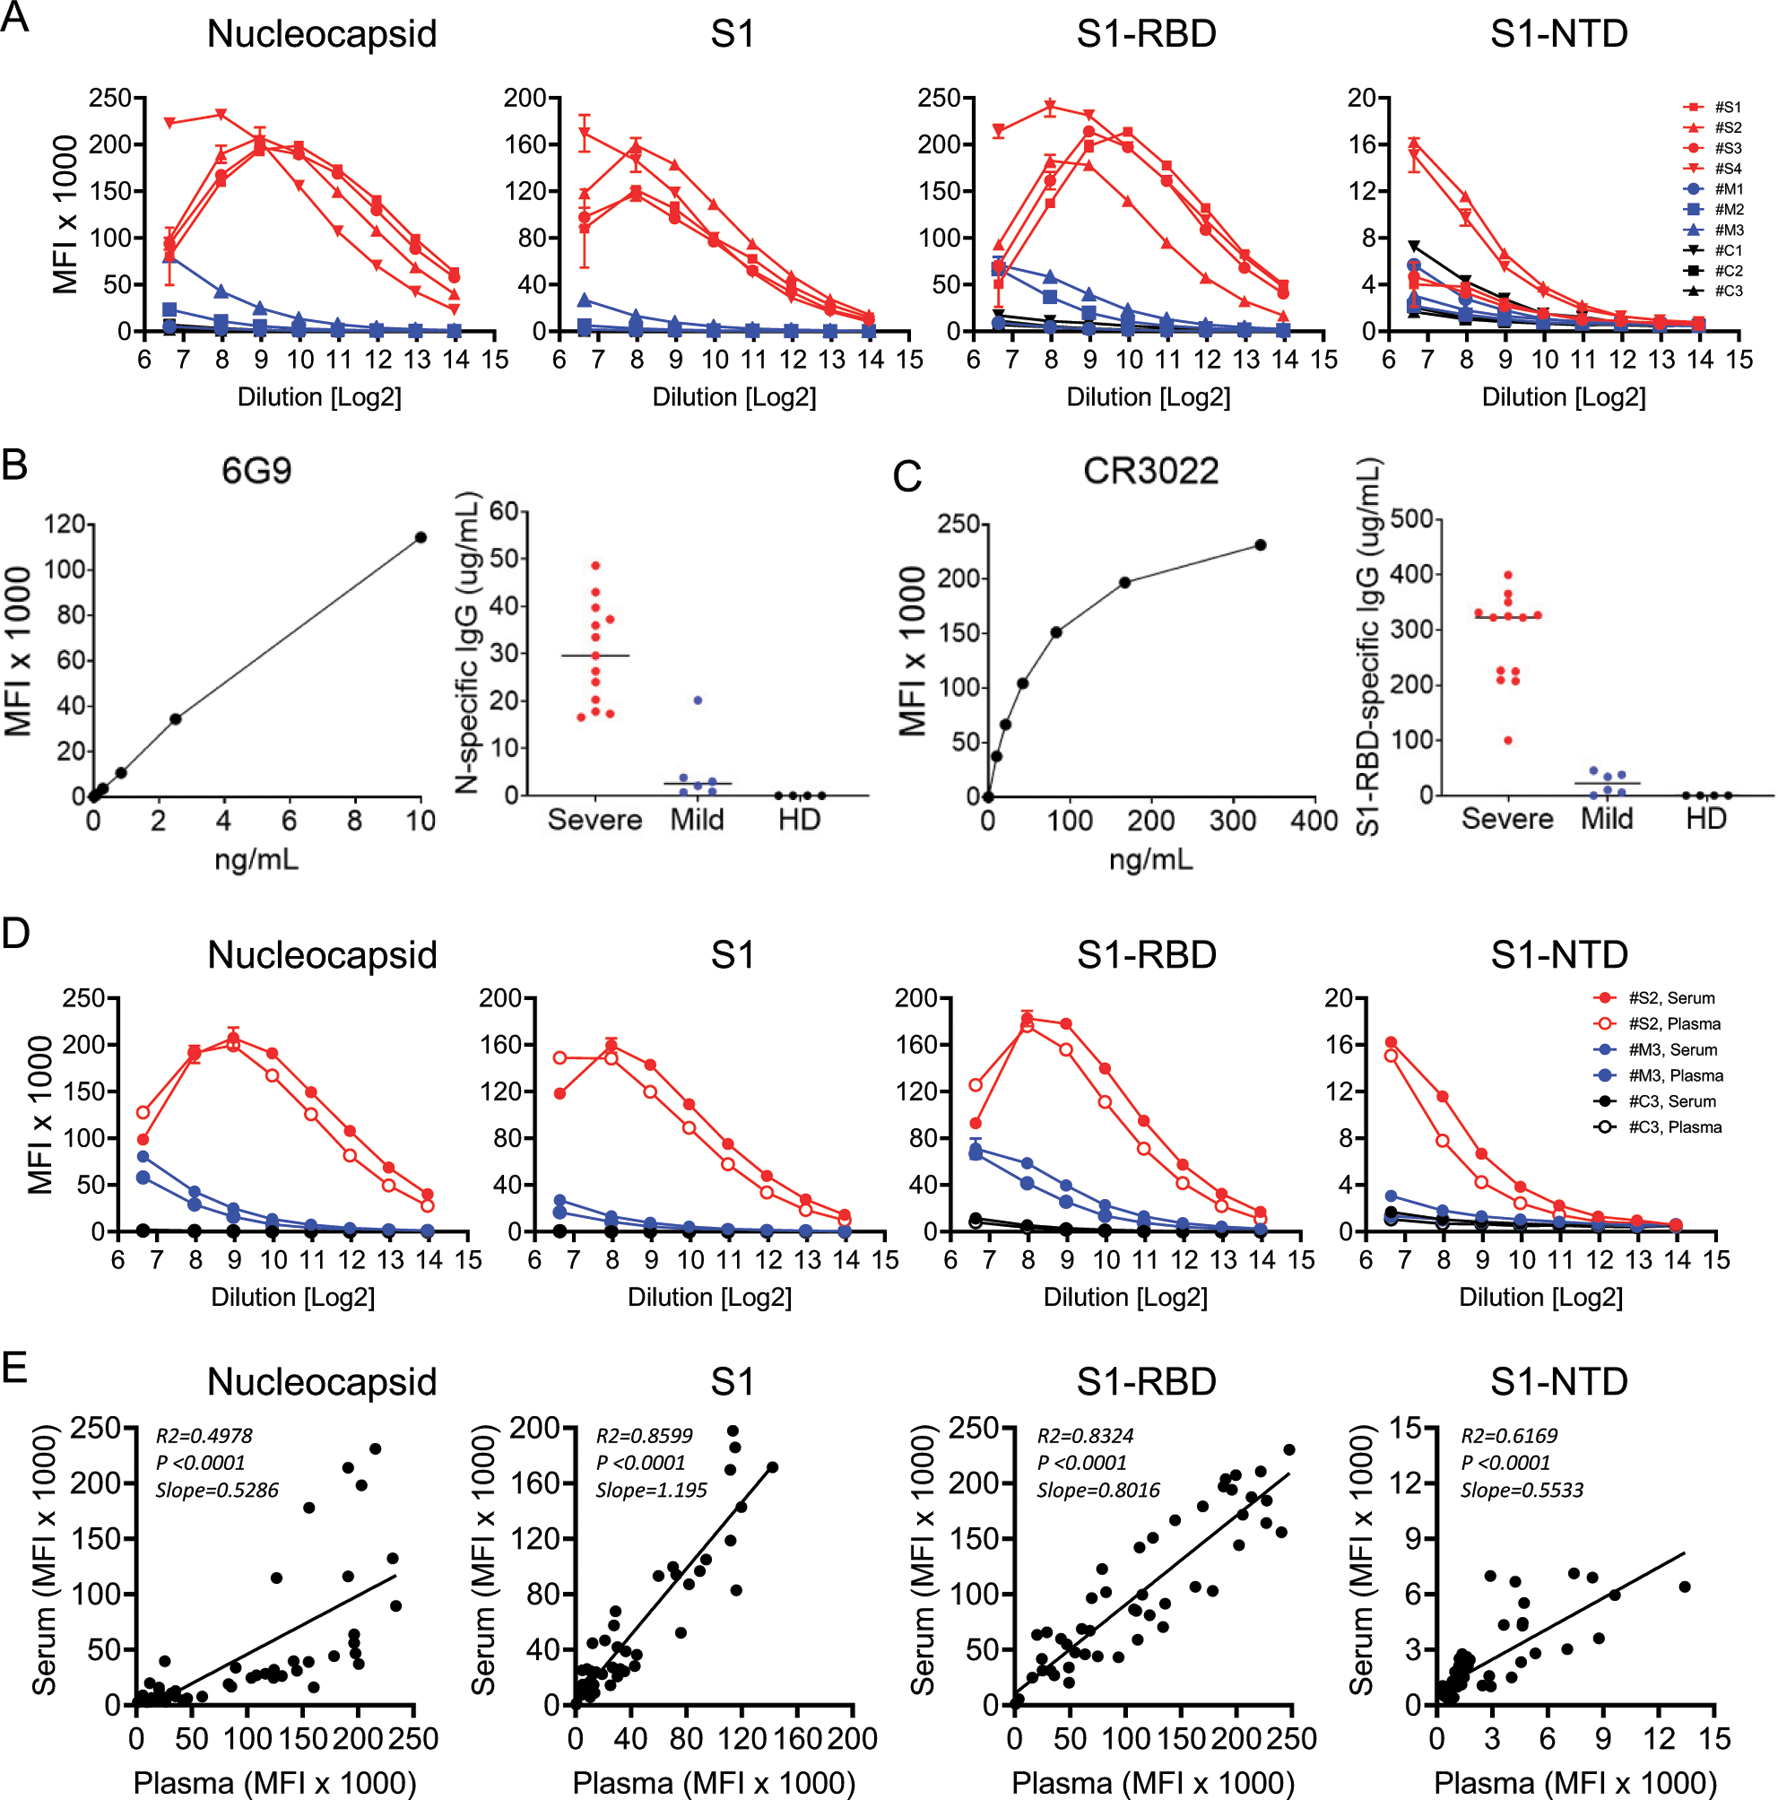
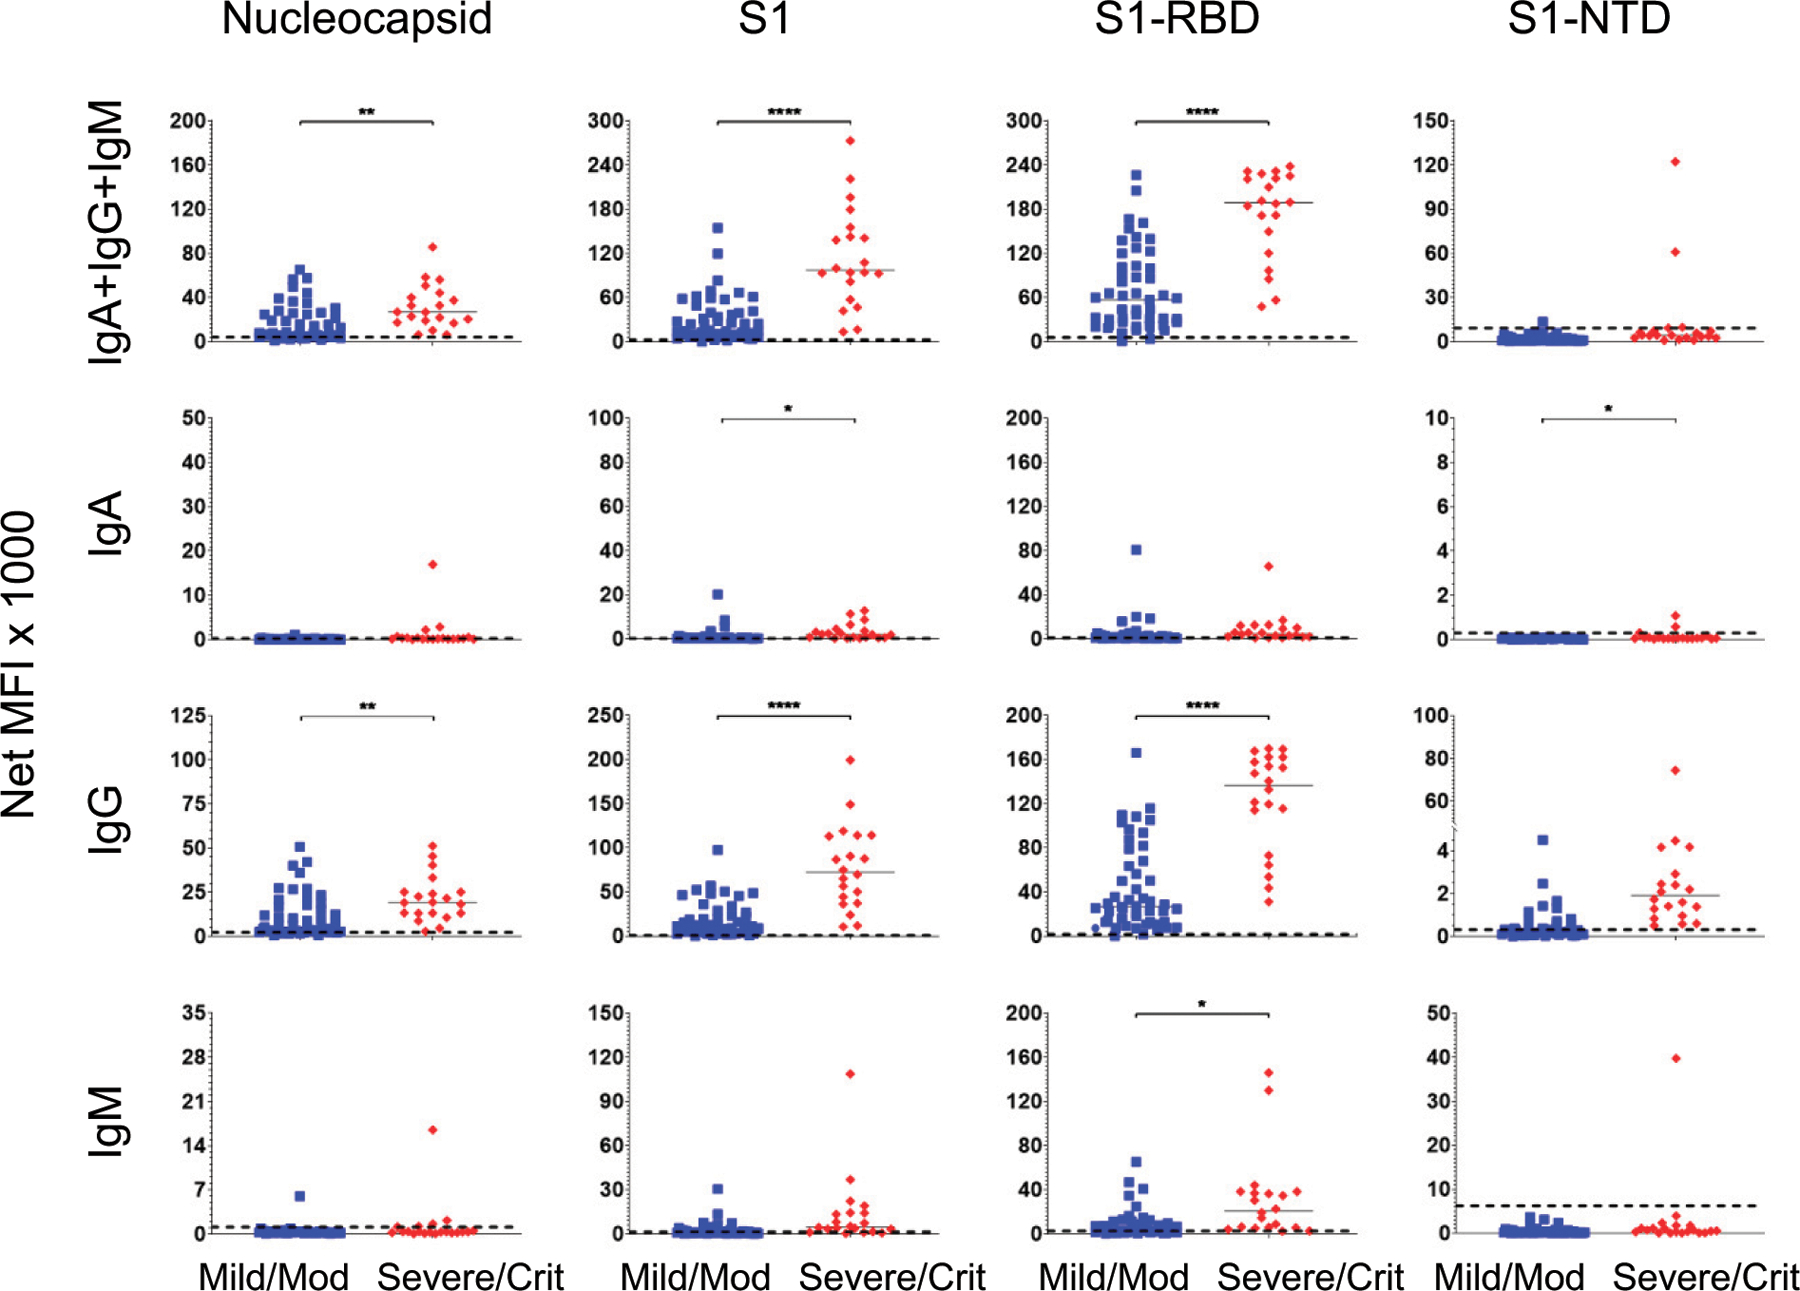
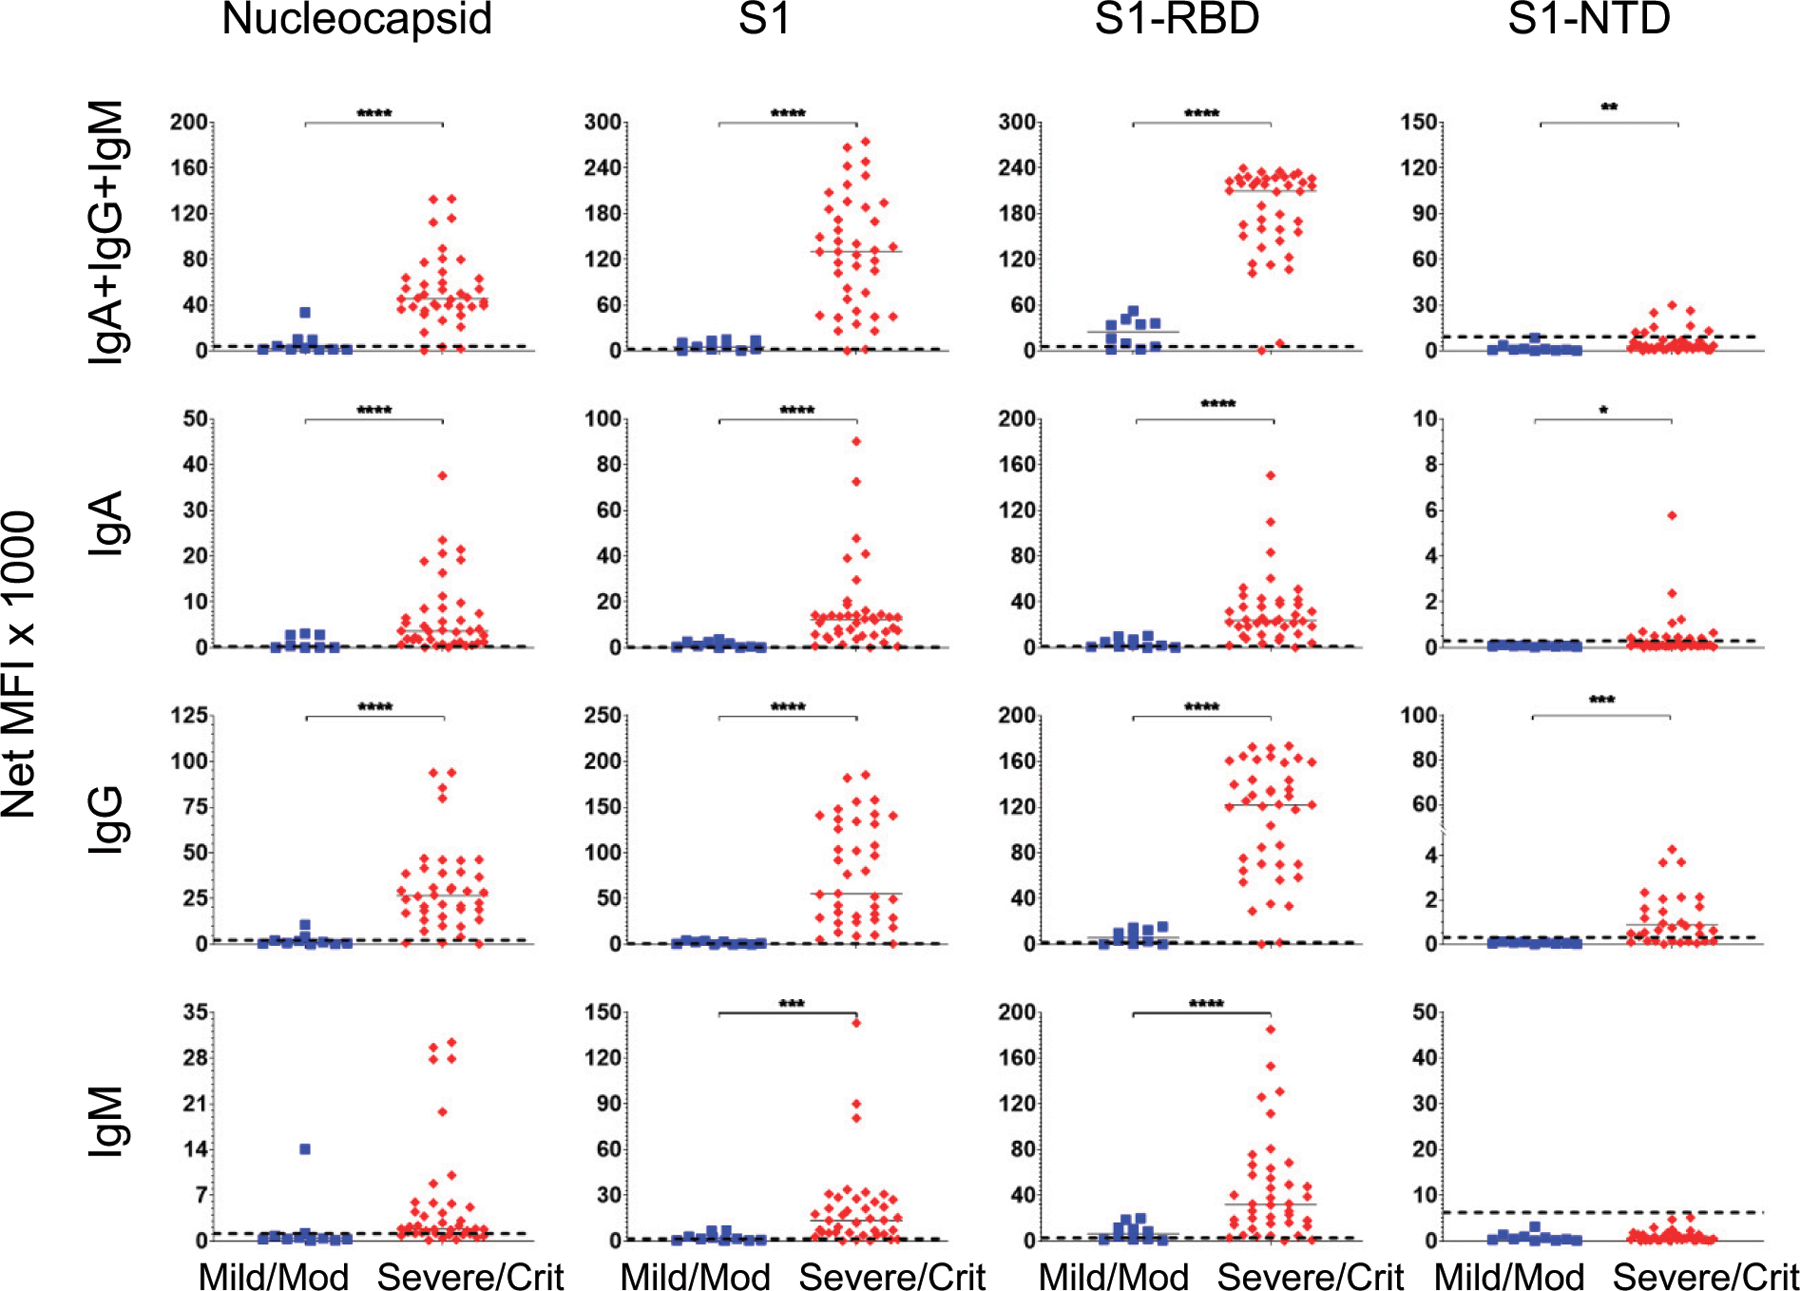
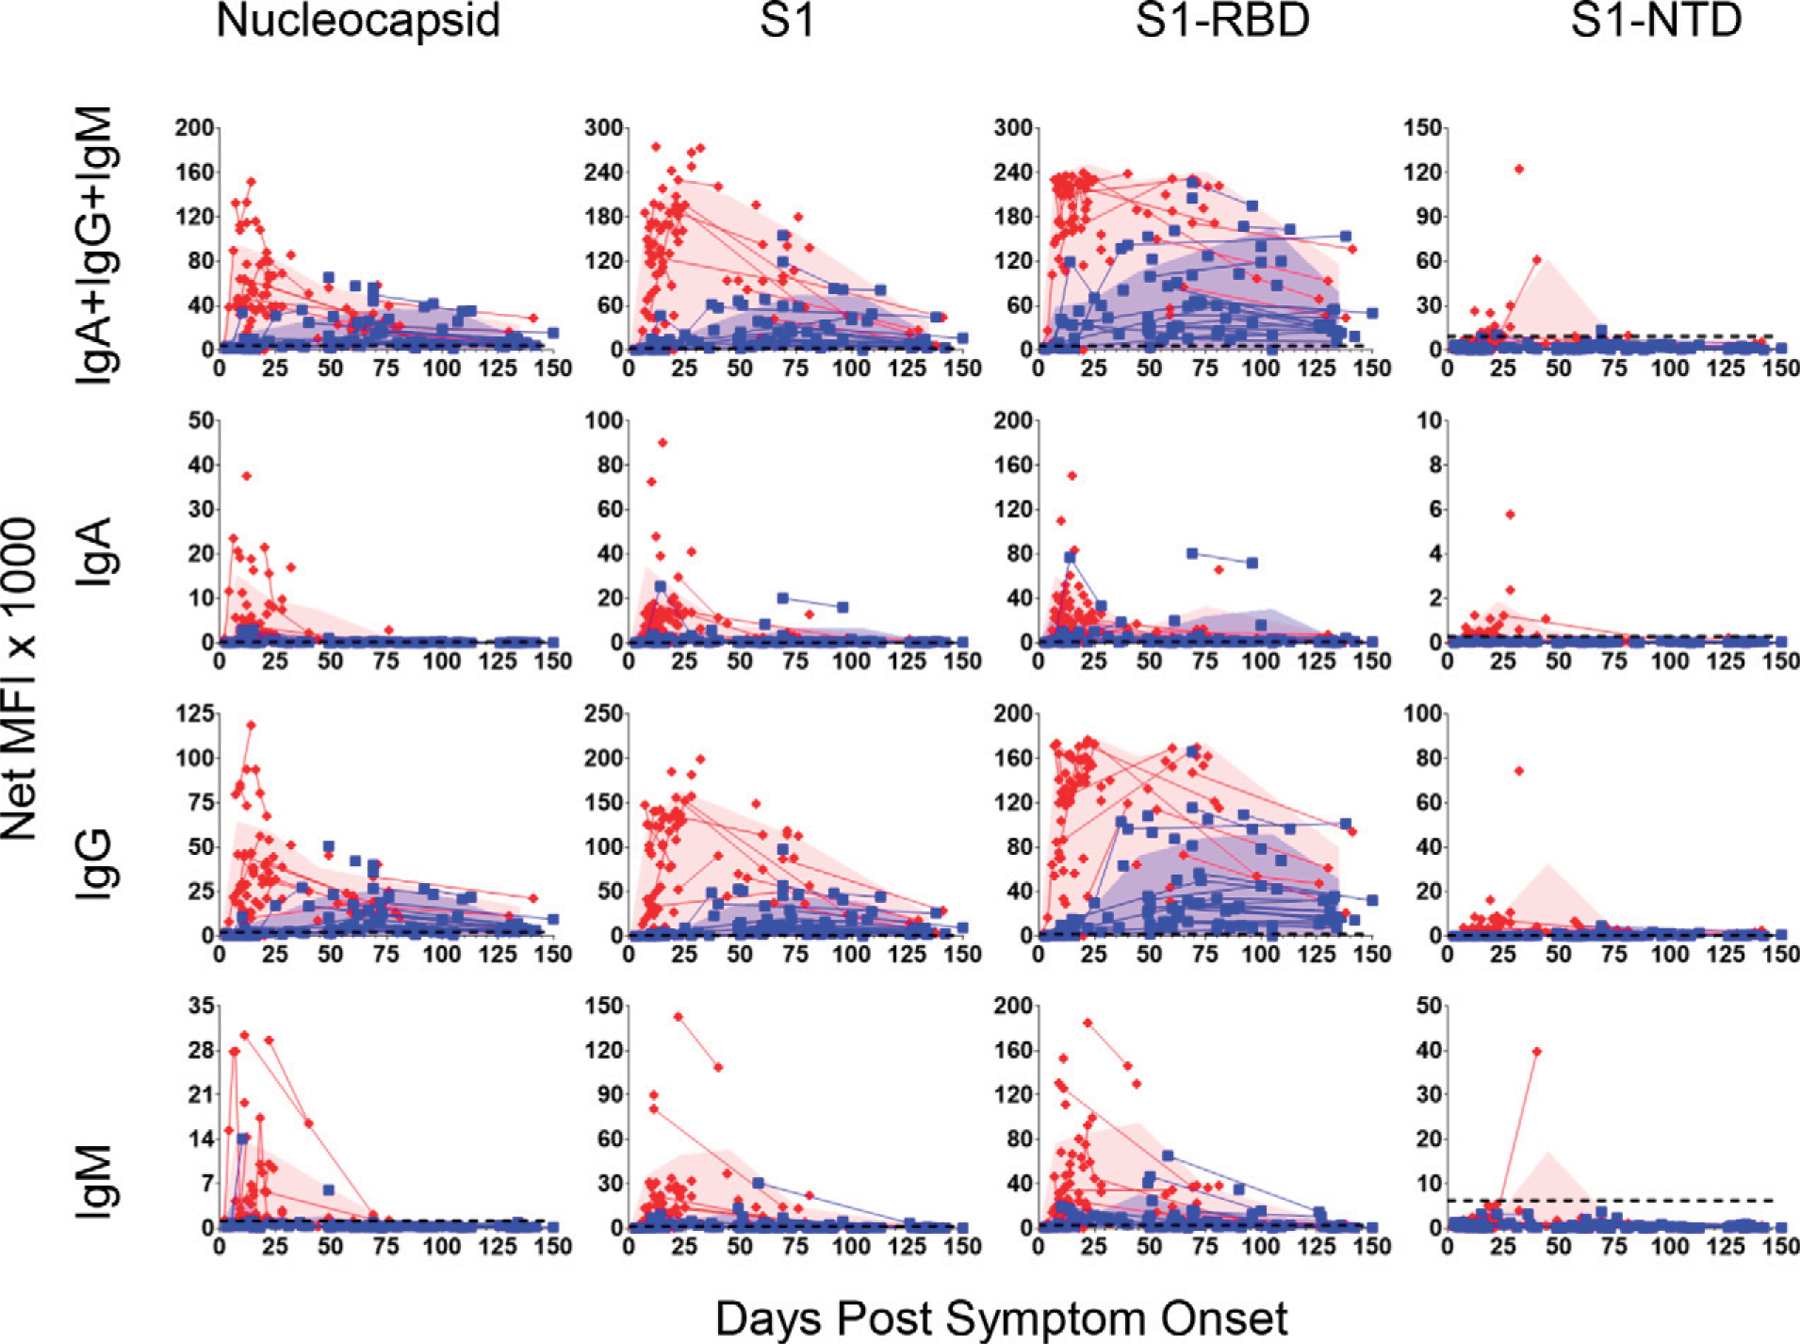
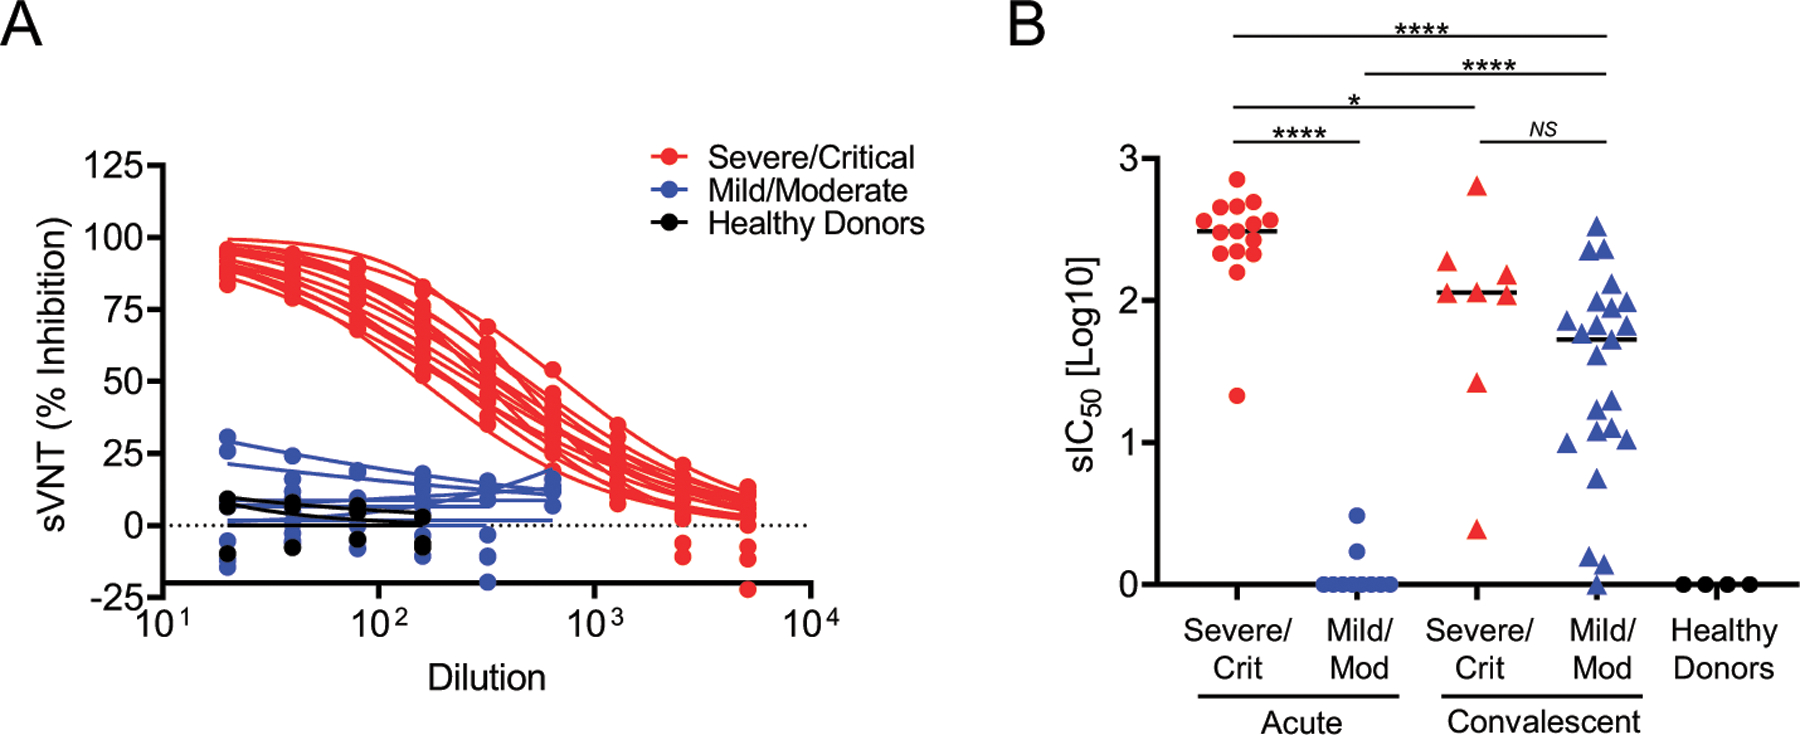
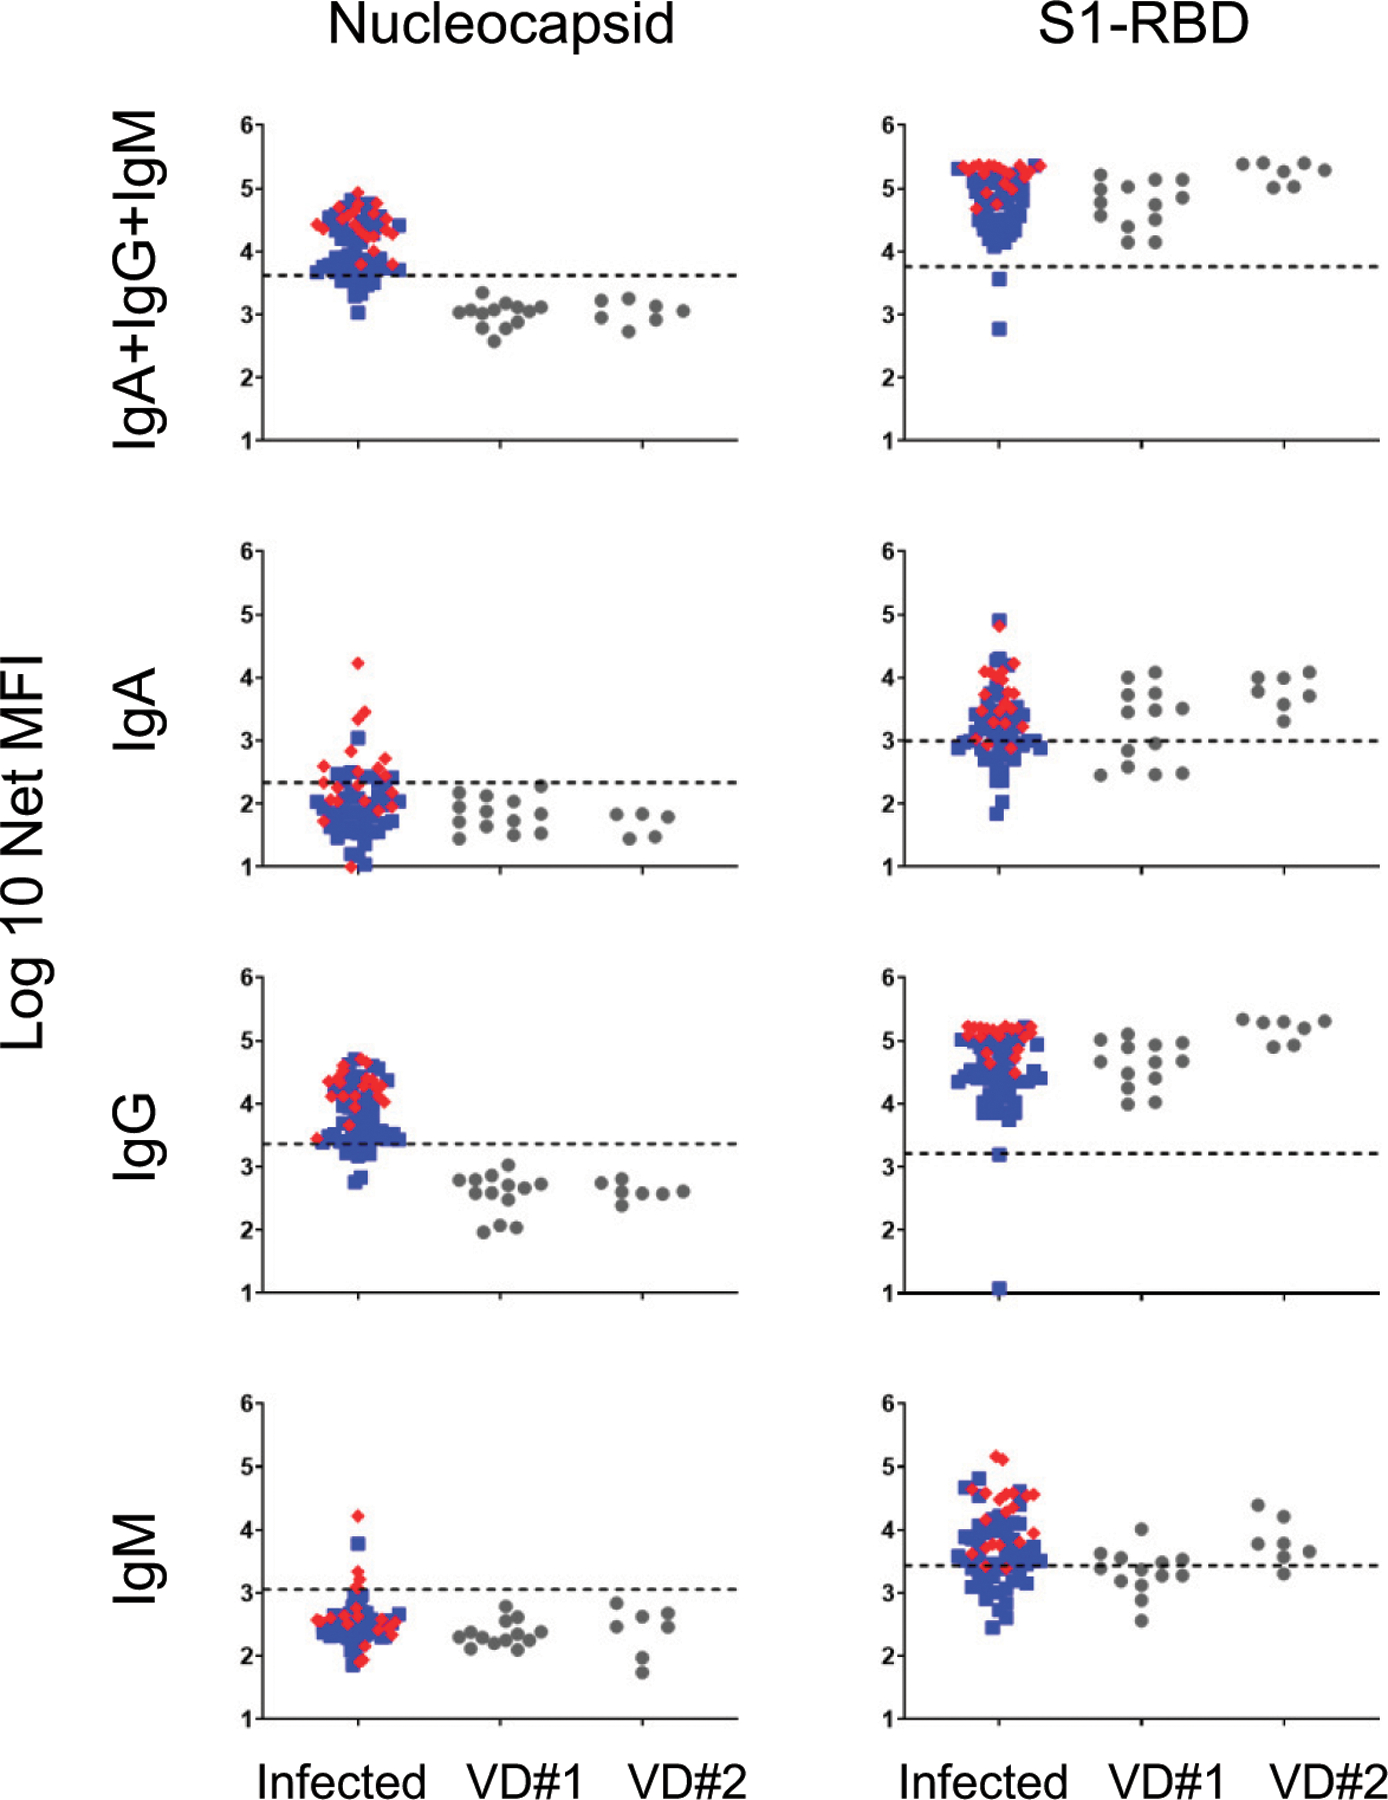
SARS-CoV-2 has caused over 100,000,000 cases and almost 2,500,000 deaths globally. Comprehensive assessment of the multifaceted antiviral Ab response is critical for diagnosis, differentiation of severity, and characterization of long-term immunity, especially as COVID-19 vaccines become available. Severe disease is associated with early, massive plasmablast responses. We developed a multiplex immunoassay from serum/plasma of acutely infected and convalescent COVID-19 patients and prepandemic and postpandemic healthy adults. We measured IgA, IgG, and/or IgM against SARS-CoV-2 nucleocapsid (N), spike domain 1 (S1), S1-receptor binding domain (RBD) and S1-N-terminal domain. For diagnosis, the combined [IgA + IgG + IgM] or IgG levels measured for N, S1, and S1-RBD yielded area under the curve values ≥0.90. Virus-specific Ig levels were higher in patients with severe/critical compared with mild/moderate infections. A strong prozone effect was observed in sera from severe/critical patients-a possible source of underestimated Ab concentrations in previous studies. Mild/moderate patients displayed a slower rise and lower peak in anti-N and anti-S1 IgG levels compared with severe/critical patients, but anti-RBD IgG and neutralization responses reached similar levels at 2-4 mo after symptom onset. Measurement of the Ab responses in sera from 18 COVID-19-vaccinated patients revealed specific responses for the S1-RBD Ag and none against the N protein. This highly sensitive, SARS-CoV-2-specific, multiplex immunoassay measures the magnitude, complexity, and kinetics of the Ab response and can distinguish serum Ab responses from natural SARS-CoV-2 infections (mild or severe) and mRNA COVID-19 vaccines.


Conflict of interest statement

DISCLOSURES

F.E.-H.L. is the founder of Micro-B-plex, Inc. N.S.H., A.M.-P., and J.L.D. are also scientists at MicroB-plex, Inc., Atlanta, GA. A.-K.I.W. holds equity and management roles in Ataia Medical. The other authors have no financial conflicts of interest.

Figures

FIGURE 1.
FIGURE 1.. Serum Ab responses distinguish convalescent, RT-PCR–confirmed, SARS-CoV-2–infected patients from controls.
Sera were collected from 1) 106 healthy subjects prior to March 2019 (prepandemic controls); 2) 137 healthy subjects between March and June 2020 (postpandemic controls); and 3) 69 RT-PCR–confirmed convalescent patients (PCR+) at least 31 DPSO. Each serum sample was diluted 1:500 and then measured for the presence of anti–SARS-CoV-2 Abs specific for N, S1, S1-RBD, and S1-NTD. Secondary Abs were either a combination of PE-conjugated anti-IgA, anti-IgG, and anti-IgM (top row) or each individually (rows 2–4, respectively). Net MFI is the MFI with background subtracted. Dashed lines indicate the C0 determined as the mean of the prepandemic population net MFI + 3 SDs. Significant differences between populations were determined by one-way ANOVA and Tukey tests. *p < 0.05, **p < 0.01, ****p < 0.0001, p > 0.05 not shown.
FIGURE 2.
FIGURE 2.. ROC curves compare diagnostic potential of each SARS-CoV-2 Ag and isotype combination.
The 69 RT-PCR–confirmed convalescent patients were compared against the 106 prepandemic healthy control subjects (from Fig. 1). Diagonal dashed red lines represent the predicted behavior when the test has no diagnostic value. The AUC measurement provides an index of diagnostic potential. AUC near 0.5 suggest no diagnostic value, and AUC near 1.0 indicate strong diagnostic potential. Ag/isotype combinations that yielded AUC values >0.90 are highlighted in green.
FIGURE 3.
FIGURE 3.. Prozone effect and Ab concentrations in COVID-19 patient sera and comparison of the assay using serum and plasma.
(A) Titration of the assay using sera from four severe (red), three mild (blue), and three healthy prepandemic controls (black) for [anti-IgG + anti-IgA + anti-IgM] specific for the N, S1, S1-RBD, and S1-NTD Ags. Sample dilutions range from 1:100 (26.64) to 1:16,384 (214). (B) Dose–response curve for commercial monoclonal Ab 6G9 human/mouse chimeric IgG calibrator and resulting Ab concentrations against SARS-CoV-2 N protein in sera from severe and mild COVID-19 patients and healthy donors. (C) Dose–response curve for commercial monoclonal Ab CR3022 human IgG1 calibrator and resulting Ab concentrations against SARS-CoV-2 S1-RBD in sera from severe and mild COVID-19 patients and healthy donors. (D) Comparison of plasma (open circles) and serum (filled circles) in the multiplex assay for N, S1, S1-RBD, and S1-NTD in one representative severe, mild, and healthy control. (E) Correlation of Ab titers in 50 matched serum and plasma samples measured at a 1:500 dilution.
FIGURE 4.
FIGURE 4.. Convalescent patients who had suffered severe/critical infections have higher anti–SARS-CoV-2 Ab levels than patients who had suffered mild/moderate infections.
The serum responses of the 69 convalescent SARS-CoV-2–infected patients in Fig. 1 were assorted according to the severity of their infections: mild/moderate (n = 49; blue squares) and severe/critical (n = 20; red diamonds). Median values for each group are presented as horizonal bars. Dashed lines indicate the C0 determined by the prepandemic control population (from Fig. 1). Significance was determined by a two-tailed t test. *p < 0.05, **p < 0.01, ****p < 0.0001, p > 0.05 not shown.
FIGURE 5.
FIGURE 5.. Higher SARS-CoV-2 Ab levels in severe/critical compared with mild/moderate infections during acute illness (≤30 DPSO).
Serum Ab levels were compared in 40 severe/critical patients (red diamonds) and 10 mild/moderate patients (blue squares) using samples drawn 6–30 DPSO. Median values for each group are presented as horizonal bars. Dashed lines indicate the C0 determined by the prepandemic control population (from Fig. 1). Significance was determined by a two-tailed t test. *p < 0.05, **p < 0.01, ***p < 0.001, ****p < 0.0001, p > 0.05 not shown.
FIGURE 6.
FIGURE 6.. Comparison of longitudinal Ab responses in severe/critical and mild/moderate SARS-CoV-2 patients over 150 d.
Serum samples were collected from patients with mild/moderate (83 samples from 55 patients; blue squares) or severe/critical (82 samples from 55 patients; red diamonds) SARS-CoV-2 infections from 2–150 DPSO. Lines connect multiple samples drawn from the same patient. Shaded blue and red areas represent the mean plus SDs of mild/moderate or severe/critical patient groups, respectively, during 0–15, 16–30, 31–60, 61–90, 91–120, and 121–150 DPSO and plotted at the midpoint of each time interval. Number of samples used at each time interval: mild/moderate, n = 12, 6, 20, 21, 11, and 13; and severe/critical, n = 34, 23, 10, 9, 0, and 5. Data point was skipped for the severe/critical group at the 91–120 DPSO interval because only one sample was drawn during that timeframe. Dashed lines indicate the C0 (from Fig. 1).
FIGURE 7.
FIGURE 7.. Quality of SARS-CoV-2 Abs in severe/critical and mild/moderate during acute infection and convalescence.
(A) Dose–response curves of plasma from patients with severe/critical (red lines) or mild/moderate (blue lines) SARS-CoV-2 infections and healthy controls (black lines) using the GenScript sVNT that measures blockade of the interaction between the immobilized ACE2 receptor and soluble HRP-conjugated S1-RBD by sample-borne Abs. sVNT (% inhibition) is the percentage reduction of the ACE2 receptor/HRP-conjugated S1-RBD interaction in the absence of an inhibitor. (B) Plasma dilution yielding 50% reduction of the uninhibited response in the sVNT sIC50[log10] observed in severe patients (red dots, triangles), mild patients (blue dots, triangles), and healthy controls (black dots) during acute illness and convalescence. The significance was determined by a two-sided t test. NS, p > 0.05, *p < 0.05, ****p < 0.0001.
FIGURE 8.
FIGURE 8.. Comparison of anti-N and anti–S1-RBD Ab responses in natural infections versus vaccination.
Serum anti-N and anti–S1-RBD Ab responses were measured in 18 subjects 13–28 d after the first dose (n = 13) and 4–8 d after the second dose (n = 7) of COVID-19 vaccination and compared against responses in the 69 naturally infected COVID-19 convalescent patients from Fig. 4 (mild/moderate patients represented as blue squares; severe/critical patients represented as red diamonds). Two of the eighteen vaccinated subjects had both a dose 1 and dose 2 sample. Two of the thirteen vaccine dose 1 (VD#1) subjects received the Moderna vaccine; the remaining 11 subjects received the Pfizer vaccine. All seven of the vaccine dose 2 (VD#2) subjects received the Pfizer vaccine. Dashed lines indicate the C0 (from Fig. 1).

References

    1. Chan JF-W, Yip CC-Y, To KK-W, Tang TH-C, Wong SC-Y, Leung K-H, Fung AY-F, Ng AC-K, Zou Z, Tsoi H-W, et al. 2020. Improved molecular diagnosis of COVID-19 by the novel, highly sensitive and specific COVID-19-RdRp/Hel real-time reverse transcription-PCR assay validated in vitro and with clinical specimens. J. Clin. Microbiol 58: e00310–20. - PMC - PubMed
    1. Wu H-S, Chiu S-C, Tseng T-C, Lin S-F, Lin J-H, Hsu Y-H, Wang M-C, Lin T-L, Yang W-Z, Ferng T-L, et al. 2004. Serologic and molecular biologic methods for SARS-associated coronavirus infection, Taiwan. Emerg. Infect. Dis 10: 304–310. - PMC - PubMed
    1. Zhao J, Yuan Q, Wang H, Liu W, Liao X, Su Y, Wang X, Yuan J, Li T, Li J, et al. 2020. Antibody responses to SARS-CoV-2 in patients with novel coronavirus disease 2019. Clin. Infect. Dis 71: 2027–2034. - PMC - PubMed
    1. Horby P, Lim WS, Emberson JR, Mafham M, Bell JL, Lin-sell L, Staplin N, Brightling C, Ustianowski A, Elmahi E, et al.; RECOVERY Collaborative Group. 2020. Dexamethasone in hospitalized patients with Covid-19. N. Engl. J. Med 384: 693–704. - PMC - PubMed
    1. Grein J, Ohmagari N, Shin D, Diaz G, Asperges E, Castagna A, Feldt T, Green G, Green ML, Lescure FX, et al. 2020. Compassionate use of remdesivir for patients with severe Covid-19. N. Engl. J. Med 382: 2327–2336. - PMC - PubMed