. 2021 Jul 1;32(4):583-590.
doi: 10.1097/EDE.0000000000001350.

Term Birth Weight and Neurodevelopmental Outcomes

Affiliations

Term Birth Weight and Neurodevelopmental Outcomes

Marianna Cortese et al. Epidemiology. .

Abstract

Background: Preterm birth is an important risk factor for neurodevelopmental disabilities. The vast majority of these disabilities occur, however, among term births. The role of fetal growth restriction specifically among term babies has been incompletely described.

Methods: We conducted a population-based study of term birth weight and its link to a range of neurodevelopmental outcomes using Norwegian health registries. To remove the influence of preterm birth, we restricted our analyses to 1.8 million singleton babies born during a narrow range of term gestational age (39-41 weeks). Babies with malformations were excluded. We adjusted analyses simply for year of birth, as further adjustments for sex, parity, maternal age, smoking, marital status, immigrant status, and parental education had trivial influence. An additional sibling analysis controlled for unmeasured family-based confounding.

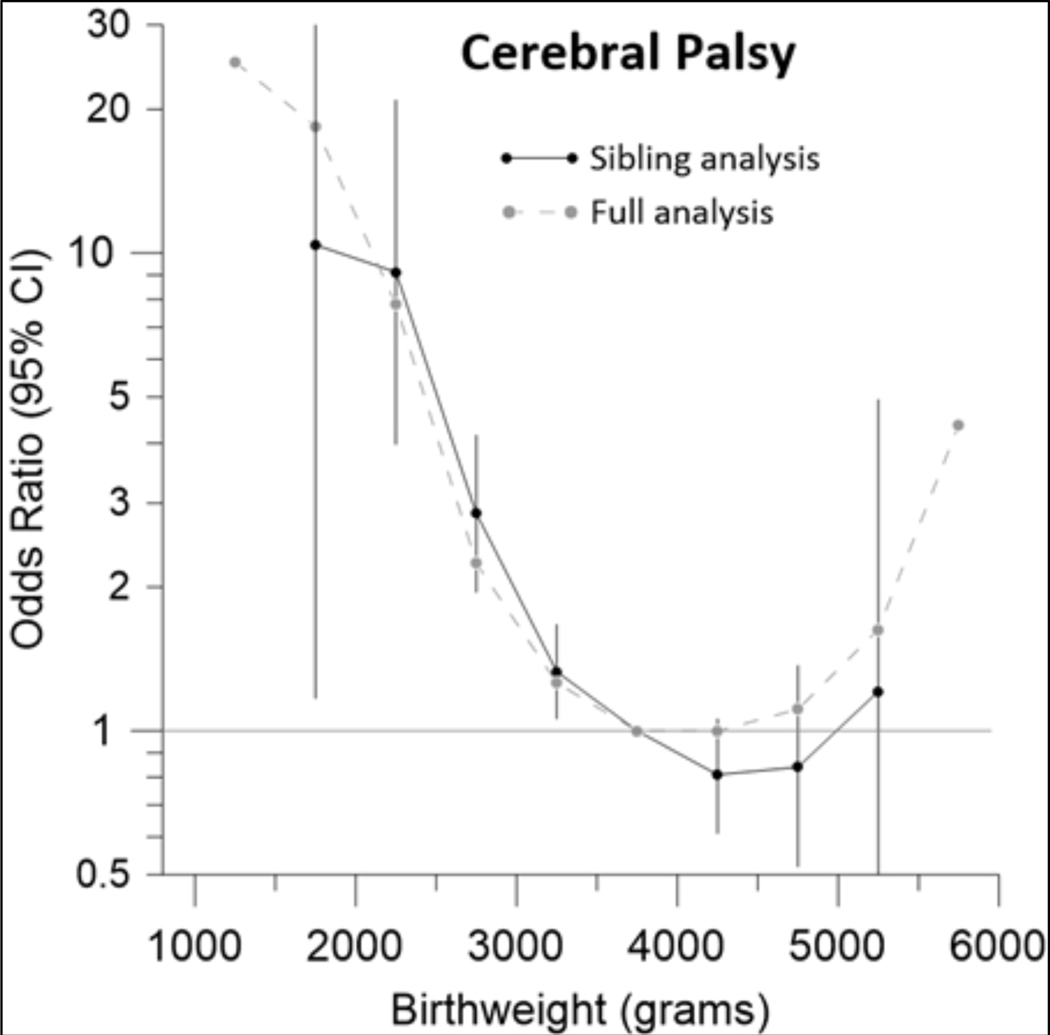
Results: The risk of neurodevelopmental disabilities at term steadily increased at birth weights lower than 3.5 kg. Using the category of 3.5-3.9 kg as the reference, the odds reached 25-fold for cerebral palsy at the smallest weights (95% confidence interval 8.0, 79), 16-fold for vision/hearing disability (4.0, 65), 11-fold for intellectual impairment (6.9, 17), 7-fold for schizophrenia (1.0, 50), 5.4-fold for epilepsy (2.6, 12), and 3.5-fold for autism spectrum (1.3, 9.4) and behavioral disorders including attention-deficit hyperactivity disorder (2.1, 5.4). Associations remained robust with sibling controls.

Conclusions: Reduced fetal growth is a powerful predictor of a wide variety of neurodevelopmental disabilities independent of preterm delivery.


Conflict of interest statement

The authors report no conflicts of interest.

Figures

Figure 1
Figure 1
Flowchart of the study population selection MBRN: Medical Birth Registry of Norway;
Figure 2
Figure 2
Odds ratios of various neurodevelopmental conditions among babies born at term (39–41 weeks) in the Norwegian population according to their birth weight ORs are adjusted for year of birth (5-year-groups in 1967–2015). The neurodevelopmental conditions were retrieved from the National Insurance Scheme in Norway, where affected individuals are registered to receive social benefits (number with the condition and prevalence among term births of 39–41 weeks: CP, n=1,887, 1.1/1000; intellectual impairment, n=4,215, 2.4/1000; epilepsy, n=2,796, 1.6/1000; autism, n=3,516, 2.0/1000; hearing/vision disabilities, n=1,763, 1.0/1000; schizophrenia, n=2,138, 1.2/1000; ADHD, n=14,593, 8.2/1000). Individuals registered in the Norwegian Medical Birth Registry and not affected by these conditions served as comparison group. The last panel (All) shows that the association pattern is similar for all the conditions. Excluded are children without registered birth weight, multiple births, stillbirths, babies with registered congenital defects, and children who died before reaching age 5. Gestational age was estimated by ultrasound from 1999 and calculated from last menstrual period if ultrasound not available.
Figure 3
Figure 3
Odds ratios of cerebral palsy among siblings born at term (39–41 weeks) in the Norwegian population according to their birth weight In the sibling analysis we matched and compared full siblings, of whom at least one developed CP. The full analysis shows results for all babies independent of relatedness (grey curve, compare Fig. 2). ORs of the sibling analysis are adjusted for year of birth (5-year-groups in 1967–2015), sex, maternal parity (0, 1, 2, 3, or ≥4), maternal age (≤19, 20–24, 25–29, 30–34, 35–39, ≥40 years), maternal civil status (married/cohabitant versus other) and, by design, for immigrant background, parental education, and shared genetic/environmental factors. CP diagnoses were retrieved from the National Insurance Scheme in Norway where affected individuals are registered to receive social benefits. Individuals registered in the Norwegian Medical Birth Registry and not affected by CP served as comparison group. Excluded are children without registered birth weight, multiple births, stillbirths, babies with registered congenital defects, and children who died before reaching age of 5. Gestational age was estimated by ultrasound from 1999 and calculated from last menstrual period if ultrasound not available.
Figure 4
Figure 4
Odds ratios of cerebral palsy according to birth weight among babies in the Norwegian population born at term (39–41 weeks) as confirmed by two independent gestational age measures, maternal last menstrual period and fetal ultrasound (LMP & Ultrasound) The grey curve (LMP) shows the results of the main analysis (compare Fig. 2), in which gestational age was estimated by ultrasound from 1999 and calculated from last menstrual period if ultrasound was not available. ORs are adjusted for year of birth (5-year-groups in 1967–2015). CP diagnoses were retrieved from the National Insurance Scheme in Norway, where affected individuals are registered to receive social benefits. Individuals registered in the Norwegian Medical Birth Registry and not affected by CP served as comparison group. Excluded are children without registered birth weight, multiple births, stillbirths, babies with registered birth defects, and children who died before reaching age of 5.

References

    1. Moster D, Lie RT, Markestad T. Long-term medical and social consequences of preterm birth. N Engl J Med 2008; 359(3): 262–73. - PubMed
    1. Irgens LM. The Medical Birth Registry of Norway. Epidemiological research and surveillance throughout 30 years. Acta Obstet Gynecol Scand 2000; 79(6): 435–9. - PubMed
    1. Morken NH, Skjaerven R, Wilcox AJ. Ultrasound prediction of perinatal outcome: the unrecognised value of sibling data. BJOG 2015; 122(12): 1674–81. - PubMed
    1. Norwegian Ministry of Labour and Social Affairs. The Norwegian Social Insurance Scheme. January2020. https://www.regjeringen.no/contentassets/03b0e088c8f44a8793ed0c0781556b1... (accessed August 11, 2020.
    1. Moster D, Lie RT, Irgens LM, Bjerkedal T, Markestad T. The association of Apgar score with subsequent death and cerebral palsy: A population-based study in term infants. J Pediatr 2001; 138(6): 798–803. - PubMed