. 2021 May 17;10(5):42.
doi: 10.1038/s41389-021-00332-z.

PRMT6 activates cyclin D1 expression in conjunction with the transcription factor LEF1

Affiliations

PRMT6 activates cyclin D1 expression in conjunction with the transcription factor LEF1

Lucas Schneider et al. Oncogenesis. .

Abstract

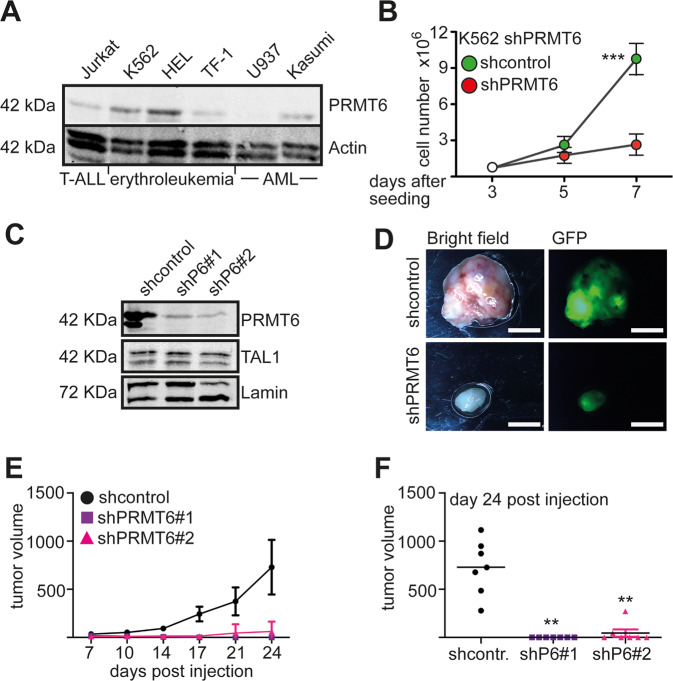
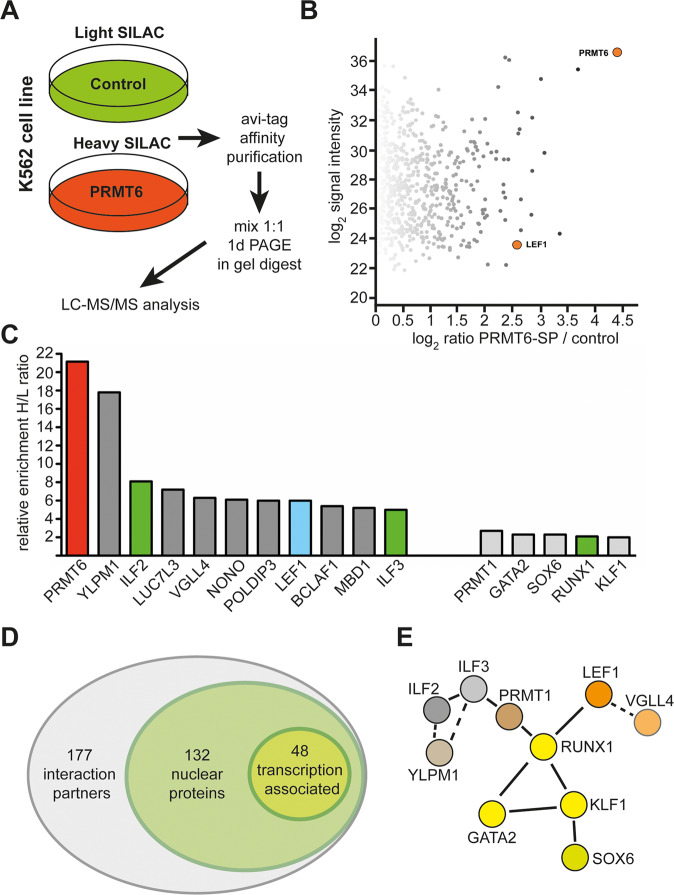
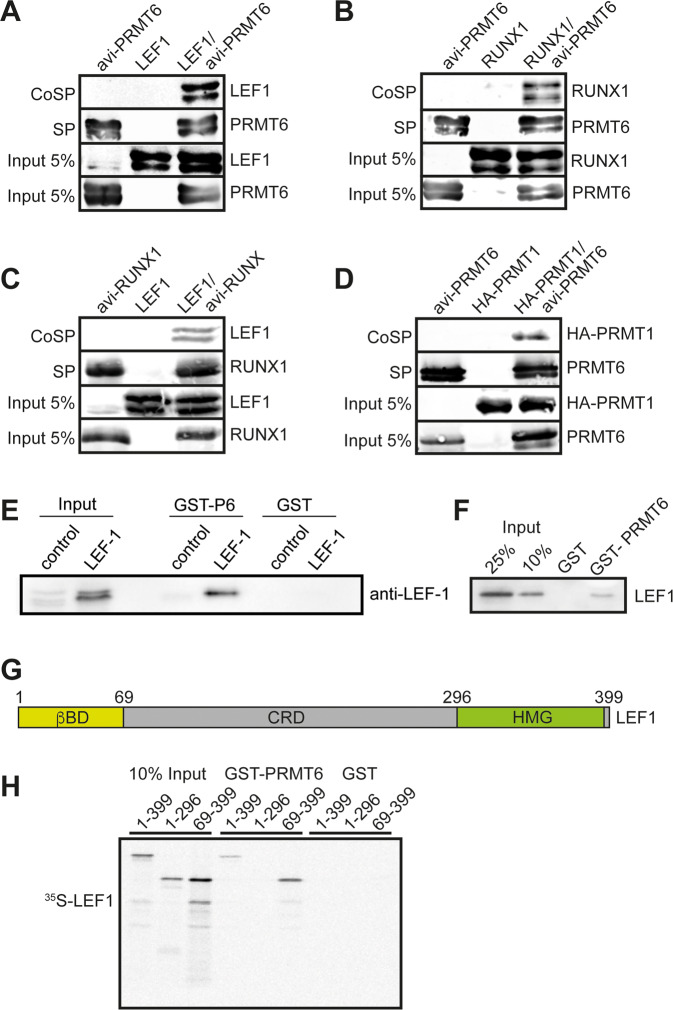
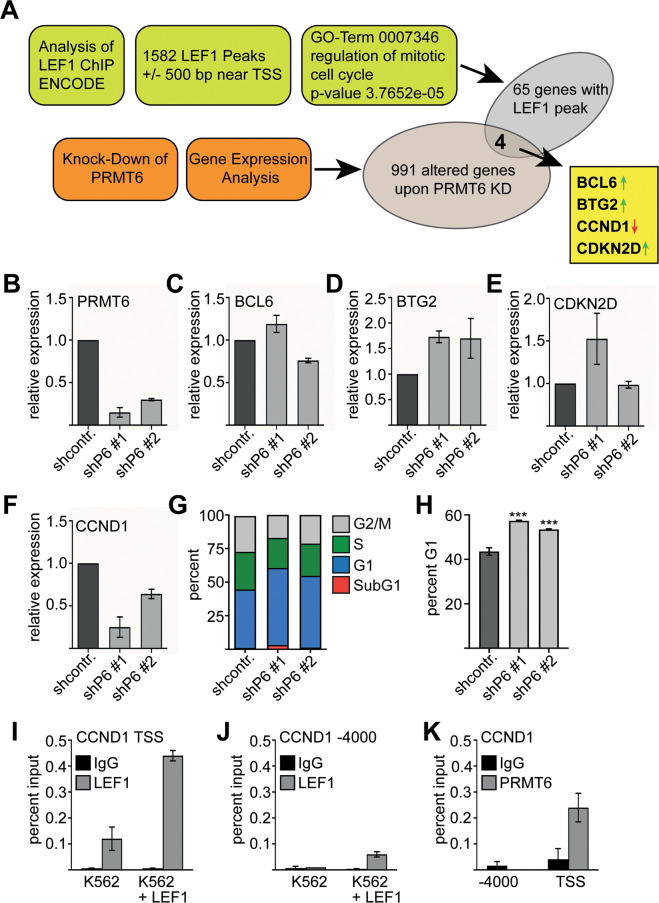
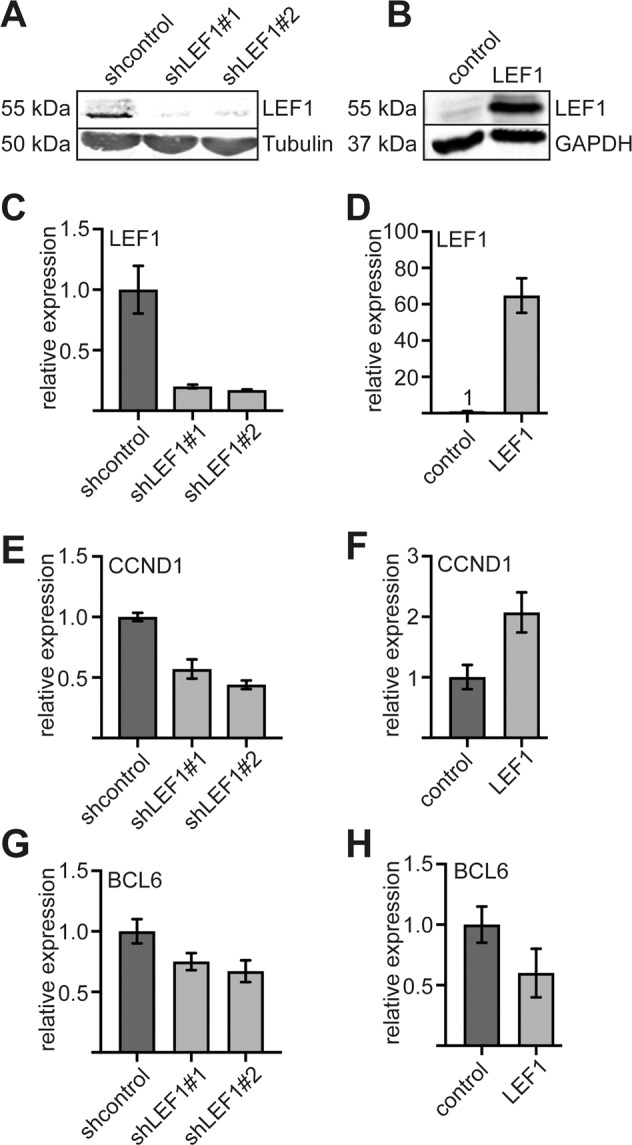
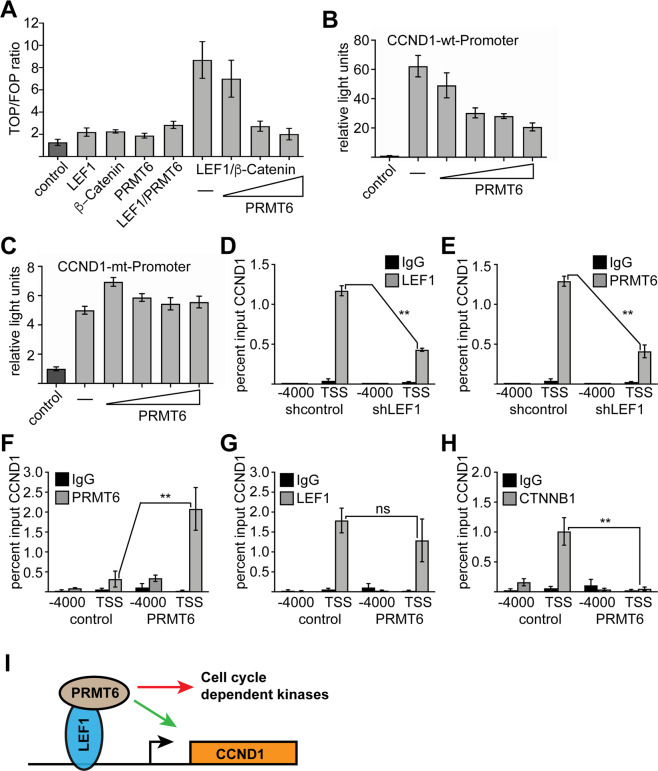
The establishment of cell type specific gene expression by transcription factors and their epigenetic cofactors is central for cell fate decisions. Protein arginine methyltransferase 6 (PRMT6) is an epigenetic regulator of gene expression mainly through methylating arginines at histone H3. This way it influences cellular differentiation and proliferation. PRMT6 lacks DNA-binding capability but is recruited by transcription factors to regulate gene expression. However, currently only a limited number of transcription factors have been identified, which facilitate recruitment of PRMT6 to key cell cycle related target genes. Here, we show that LEF1 contributes to the recruitment of PRMT6 to the central cell cycle regulator CCND1 (Cyclin D1). We identified LEF1 as an interaction partner of PRMT6. Knockdown of LEF1 or PRMT6 reduces CCND1 expression. This is in line with our observation that knockdown of PRMT6 increases the number of cells in G1 phase of the cell cycle and decreases proliferation. These results improve the understanding of PRMT6 activity in cell cycle regulation. We expect that these insights will foster the rational development and usage of specific PRMT6 inhibitors for cancer therapy.


Conflict of interest statement

The authors declare no competing interests.

Figures

Fig. 1
Fig. 1. PRMT6 knockdown decreases proliferation of hematopoietic cells lines.
A Western blot analysis of PRMT6 expression in Jurkat, K562, HEL, TF-1, U937, and Kasumi cells. Western blot was done with extracts from the indicated cells and specific antibodies against PRMT6. Lamin served as loading control. B PRMT6 mediates enhanced proliferation. PRMT6 was knocked down by shRNA in K562 cells. Six days after transduction shPRMT6 and shcontrol cells were seeded out in similar numbers. Cells were counted at the indicated time points. The error bars display the standard deviation from the mean from three determinations. The P-values were calculated using ANOVA. ***P < 0.001. C Western blot showing efficient knockdown of PRMT6 with shRNA. Western blot against the transcription factor TAL1 and against actin served as controls. These cells were injected subcutaneously into C57BL/6 mice. D Analysis of subcutaneous tumors upon injection of shcontrol and shPRMT6 K562 cells, respectively. Bright field and GFP image of an exemplary tumor from day 24 is displayed. The white bar indicates 0.5 cm. E Tumor growth curve from day 7 after injection until day 24 is shown for two shPRMT6 constructs. Tumor volume is given in mm3. F Endpoint analysis at day 24 of post-injection. Tumor volume is given. The P-values were calculated using ANOVA from seven mice. **P < 0.01, ***P < 0.001.
Fig. 2
Fig. 2. SILAC-based mass spectrometry reveals PRMT6 interactome.
A Strategy for the identification of PRMT6 interaction partners by SILAC based mass spectrometry upon avi-tag affinity purification of PRMT6. K562 cells were transduced with PRMT6 and the corresponding empty pRRLs-Avi vector control. The control cells were cultured for seven passages in light SILAC medium, containing normal amino acids, avi-PRMT6 over expressing cells were cultured in heavy SILAC medium (amino acids labeled with heavy isotopes). Nuclear extracts were prepared, and avi-tag affinity purification was performed with streptavidin beads. The extract form light and heavy SILAC labeled cells were mixed in a 1:1 ratio and applied to LC-MS/MS analysis. B Scatter plot of signaling intensity vs. PRMT6-SP/control. PRMT6 and LEF1 are highlighted in orange. C Selected candidate interaction partners of PRMT6. Known interaction partners are marked in green. Relative enrichment of proteins in the bio-PRMT6 sample was determined by calculating the ratio between peak intensities of identified peptides from the heavy (H, bio-PRMT6 + BirA-ligase) versus the light (L, BirA-ligase) sample. The cut-off was enrichment with an H/L ratio of two (which is KLF1). D Euler diagram of PRMT6 interactome. Functional annotation clustering with DAVID, revealed that most interacting proteins are nuclear located and 48 are associated with transcription. E Protein interaction network of transcription factors and associated cofactors revealed by STRING.
Fig. 3
Fig. 3. LEF1 is a novel identified PRMT6 interaction partner.
Co-streptavidin-precipitation (CoSP). The biotin tagged bait was co-transfected with the prey expression vector into HEK293 cells. The biotinylated bait was pulled out from extracts with streptavidin beads (SP). Coprecipitated bait protein is shown in the upper lane, (CoSP). A CoSP of PRMT6 and LEF1. Coprecipitation of LEF1 was detected with an anti-LEF1 antibody. B CoSP of PRMT6 and RUNX1. Coprecipitation of RUNX1 was detected with an anti-RUNX1 antibody. C CoSP of RUNX1 and LEF1. Biotinylated RUNX1 protein was pulled out from extracts with streptavidin beads. Coprecipitation of LEF1 was detected with an anti-LEF1 antibody. D CoSP of PRMT6 and PRMT1. Coprecipitation of PRMT1 was detected with an anti-HA antibody. E GST-pulldown with GST-PRMT6 as bait and LEF1 protein expressed in HEK293 cells. GST-PRMT6 was incubated with cell extracts of from LEF1 over expressing cells. GST-pulldown with GST protein served as negative control. The GST proteins were pulled out with glutathione beads. Pulled out LEF1 was detected by western blot with anti-LEF1 antibody. F GST-pulldown with GST-PRMT6 and in vitro translated LEF1. Pulled out LEF1 was detected by western blot with anti-LEF1 antibody. G Schematic representation of the LEF1 protein. H GST-pulldown with GST-PRMT6 and in vitro translated 35S labeled LEF1 deletion constructs. GST protein served as negative control and the GST proteins were pulled out with glutathione beads. Detection of pulled out LEF1 protein was done by radiography.
Fig. 4
Fig. 4. Combined ChIP-seq and RNA transcriptome analysis reveals CCND1 as a direct LEF1/PRMT6 target.
A Evaluation of LEF1 ChIP Encode data in K562 cells and GO-term analysis revealed 65 genes regulating the mitotic cell cycle, which are bound by LEF1. Expression analysis identified 991 differentially expressed genes upon knockdown of PRMT6 in K562 cells. Of these, four genes are cell cycle associated LEF1 targets, BCL6, BTG2, CCND1, and CDKN2D. The arrows indicate upregulation or downregulation upon PRMT6 knockdown. B mRNA expression analysis of two different shRNA constructs against PRMT6 (shP6). GAPDH expression was used for normalization. CF The four identified cell cycle associated LEF1/PRMT6 targets were re-analysed by quantitative real-time PCR 7 days after shPRMT6 transduction. Error bars represent the standard deviation from at least three independent experiments. G Cell cycle analysis was performed five days after PRMT6 knockdown in K562 cells. H Percentage of cells within the G1 phase of the cell cycle increased upon PRMT6 knockdown in K562 cells. I, J ChIP assay shows that LEF1 is bound close to the CCND1 transcriptional start site (TSS). This binding is increased upon LEF1 over expression. The negative control (−4000 bp from the TSS) is displayed in J. K ChIP-assay shows that PRMT6 is bound close to the CCND1 transcriptional start site (TSS), but not to the −4000 region. ChIP were performed with an anti-LEF1 and anti-PRMT6 antibody, respectively. The P-values were calculated using Student’s t-test from at least three independent measurements. *P < 0.05; **P < 0.01; ***P < 0.001.
Fig. 5
Fig. 5. LEF1 knockdown and over expression in K562 cells confirms influence of LEF1 on CCND1 expression.
A Western blot analysis of LEF1 knockdown in K562 cells. B Western blot analysis of LEF1 over expression in K562 cells. C mRNA level of LEF1 is decreased in LEF1 knockdown cells. D mRNA level of LEF1 is increased in LEF1 over expression cells. E CCND1 mRNA expression decreased after LEF1 knockdown. F mRNA level of CCND1 after LEF1 over expression in K562 cells. G BCL6 mRNA expression decreased after LEF1 knockdown. H mRNA level of BCL6 after LEF1 over expression in K562 cells. Error bars represent the standard deviation from the mean from at least three independent determinations. The P-values were calculated using Student’s t-test. *P < 0.05; **P < 0.01; ***P < 0.001.
Fig. 6
Fig. 6. Interdependence of LEF1 and PRMT6 on CCND1.
A PRMT6 TOP-Flash assay. The M50 Super 8x TOP-Flash was co-transfected with LEF1, PRMT6 and N89-(constantly active) β-Catenin into HEK293T cells. The negative control M51 Super 8× FOP-Flash was used for normalization. Co-transfection of LEF1 and N89-ß-Catenin leads to the highest TOP/FOP ratio. Increasing PRMT6 amount decreased the activating effect of β-Catenin. B, C CCND1 luciferase assay. The bars represent the mean with standard deviation of two independent experiments, each measured in technical duplicates. D, E ChIP assay was performed seven days upon knockdown of LEF1 in K562 cells. Binding of LEF1 and PRMT6 to the CCND1 promoter was reduced upon LEF1 knockdown. F ChIP assay upon over expression of PRMT6 in K562 cells. PRMT6 occupancy at the CCND1 promoter (transcription start site; TSS) was increased upon over expression of PRMT6. PCR with a primer localized at −4000 served as negative control. G ChIP assay with a LEF1 antibody upon over expression of PRMT6. LEF1 binding to the CCND1 promoter was not altered significantly. H ChIP assay revealed that binding of CTNNB1 (β-Catenin) was reduced upon over expression of PRMT6. Error bars represent the standard deviation from the mean. The P-values were calculated using Student’s t-test from at least three independent measurements. **P < 0.01. I Schematic representation of LEF1/PRMT6 activity on cell cycle genes.

Similar articles

Cited by

References

    1. Blanc RS, Richard S. Arginine methylation: the coming of age. Mol. Cell. 2017;65:8–24. doi: 10.1016/j.molcel.2016.11.003. - DOI - PubMed
    1. Lorton BM, Shechter D. Cellular consequences of arginine methylation. Cell Mol. Life Sci. 2019;76:2933–2956. doi: 10.1007/s00018-019-03140-2. - DOI - PMC - PubMed
    1. Litt M, Qiu Y, Huang S. Histone arginine methylations: their roles in chromatin dynamics and transcriptional regulation. Biosci. Rep. 2009;29:131–141. doi: 10.1042/BSR20080176. - DOI - PMC - PubMed
    1. Guccione E, et al. Methylation of histone H3R2 by PRMT6 and H3K4 by an MLL complex are mutually exclusive. Nature. 2007;449:933–937. doi: 10.1038/nature06166. - DOI - PubMed
    1. Kirmizis A, et al. Arginine methylation at histone H3R2 controls deposition of H3K4 trimethylation. Nature. 2007;449:928–932. doi: 10.1038/nature06160. - DOI - PMC - PubMed