. 2021 May 17;12(1):2859.
doi: 10.1038/s41467-021-22915-5.

Connectivity characterization of the mouse basolateral amygdalar complex

Affiliations

Connectivity characterization of the mouse basolateral amygdalar complex

Houri Hintiryan et al. Nat Commun. .

Abstract

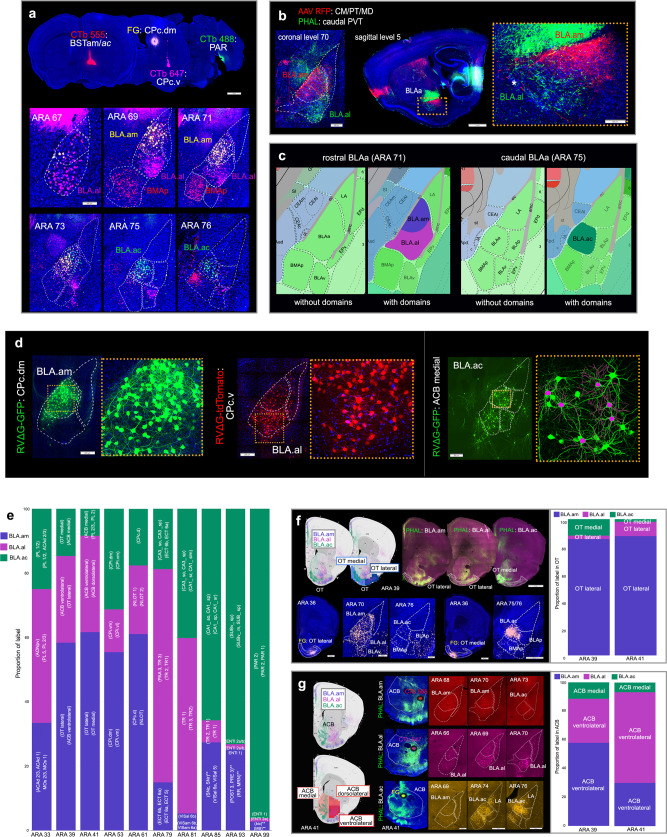
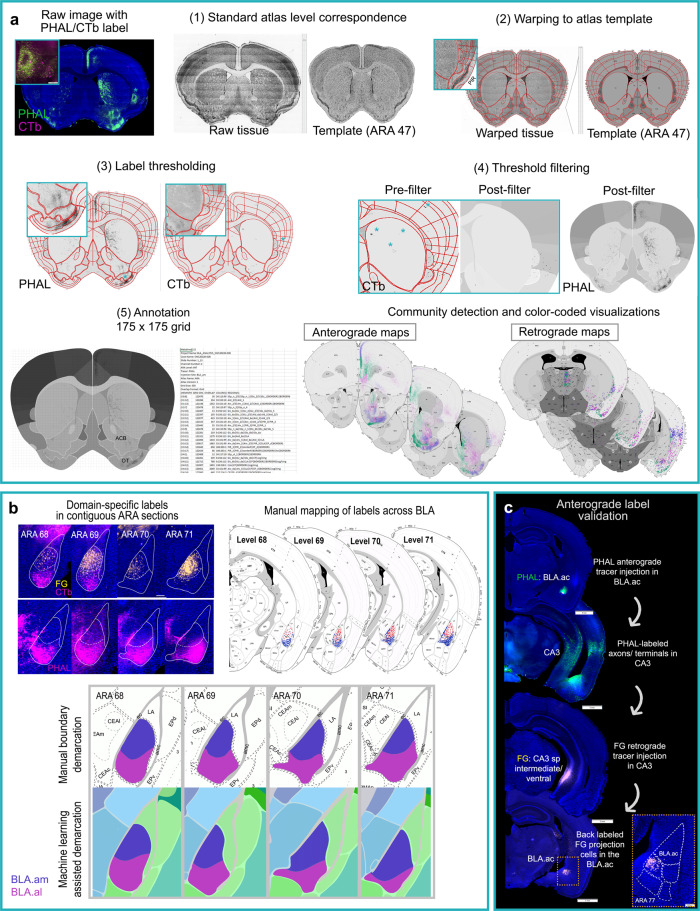
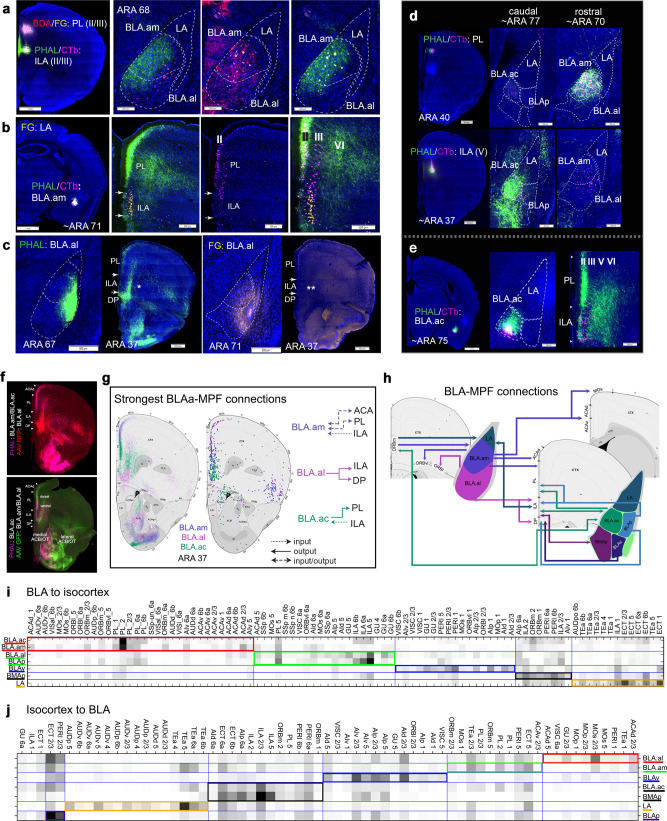
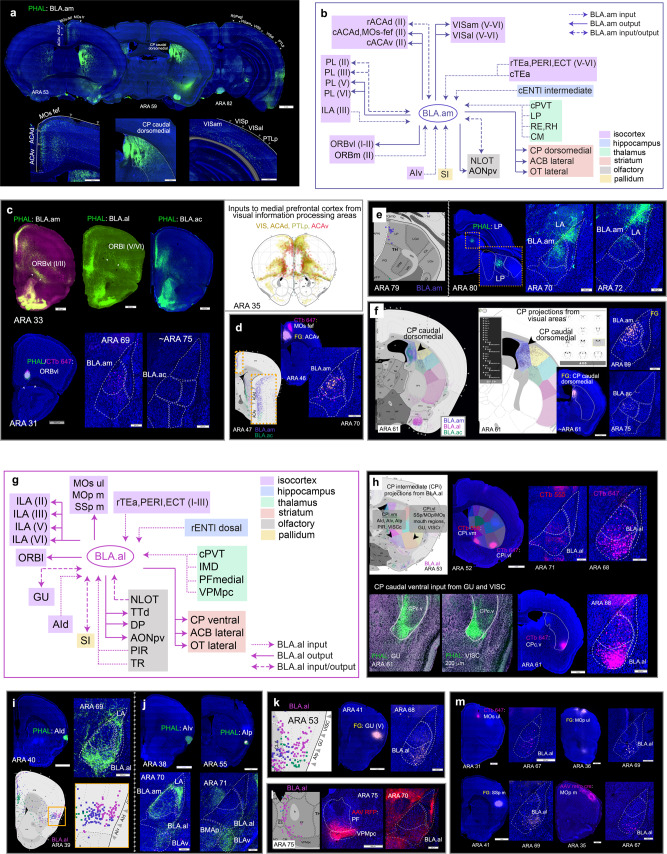
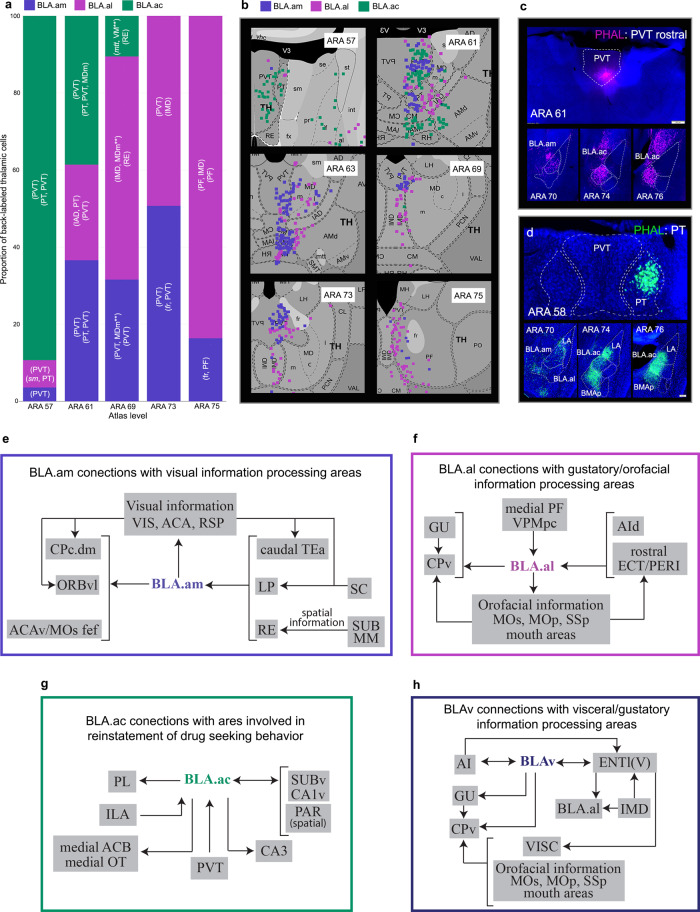
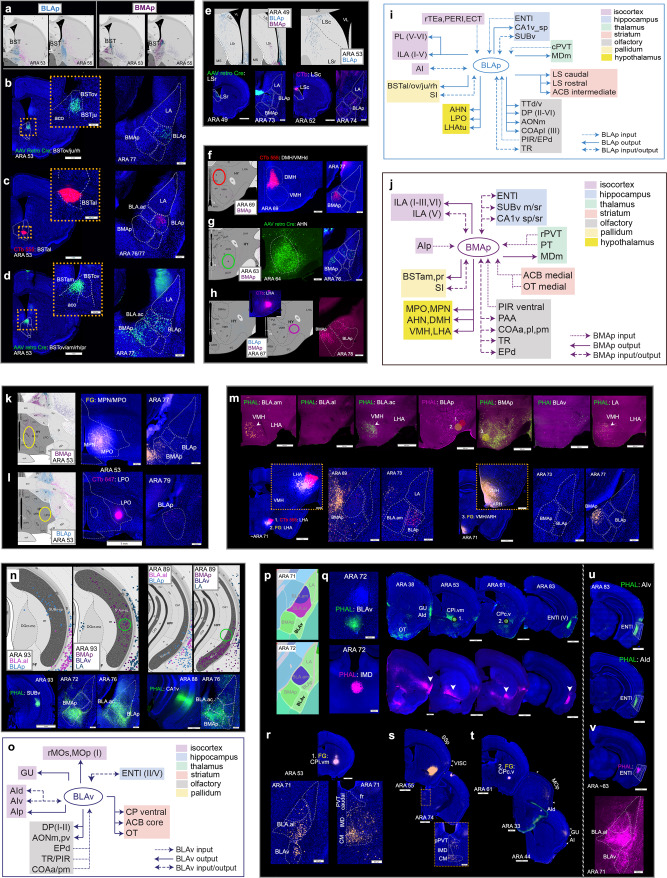
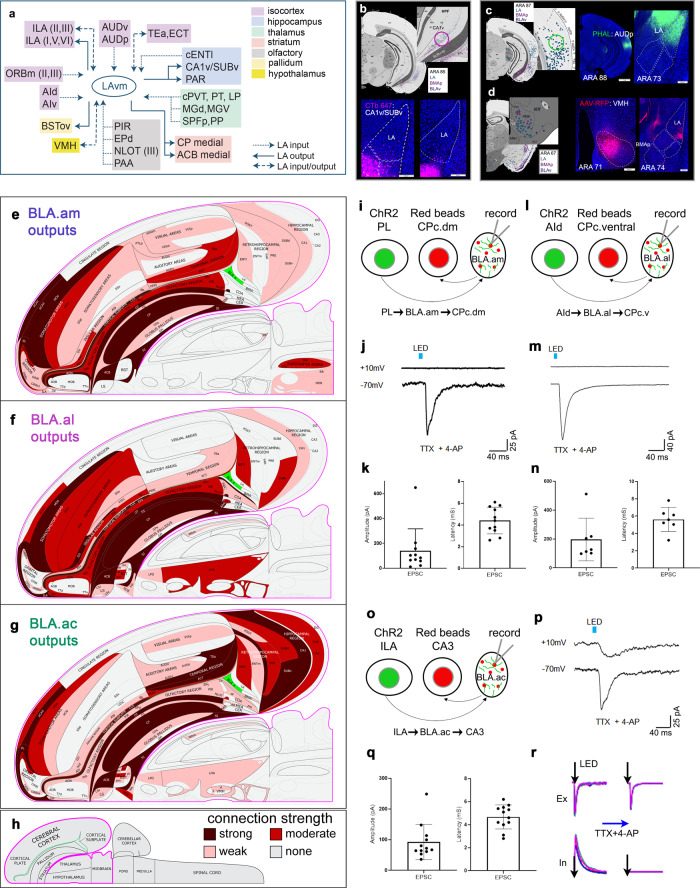
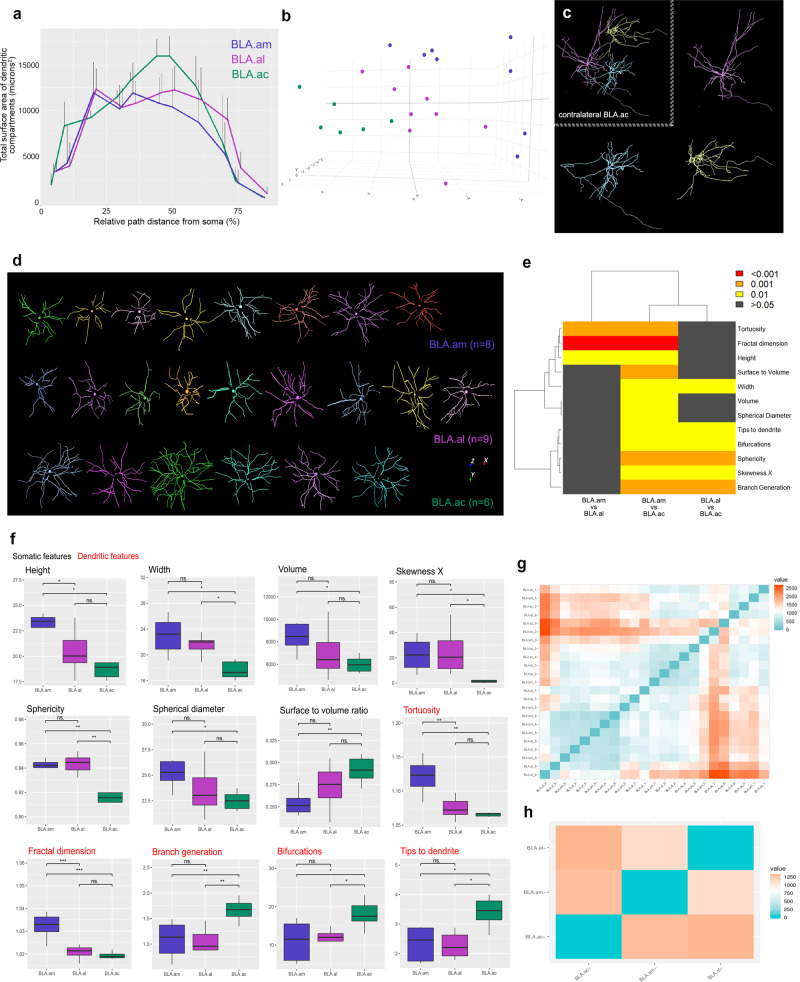
The basolateral amygdalar complex (BLA) is implicated in behaviors ranging from fear acquisition to addiction. Optogenetic methods have enabled the association of circuit-specific functions to uniquely connected BLA cell types. Thus, a systematic and detailed connectivity profile of BLA projection neurons to inform granular, cell type-specific interrogations is warranted. Here, we apply machine-learning based computational and informatics analysis techniques to the results of circuit-tracing experiments to create a foundational, comprehensive BLA connectivity map. The analyses identify three distinct domains within the anterior BLA (BLAa) that house target-specific projection neurons with distinguishable morphological features. We identify brain-wide targets of projection neurons in the three BLAa domains, as well as in the posterior BLA, ventral BLA, posterior basomedial, and lateral amygdalar nuclei. Inputs to each nucleus also are identified via retrograde tracing. The data suggests that connectionally unique, domain-specific BLAa neurons are associated with distinct behavior networks.


Conflict of interest statement

The authors declare no competing interests.

Figures

Fig. 1
Fig. 1. Uniquely connected BLAa neurons.
a Four retrograde tracer injections in BSTam (CTb 555: red), CPc.dm (FG: yellow), CPc.v (CTb 647: pink), and in PAR (CTb 488: green) reveal uniquely connected projection neurons in BLAa. Note segregation of FG (yellow) and CTb 647 (pink) labeled cells in BLA.am and BLA.al, respectively at ARA levels 69 and 71. Also note absence of PAR projecting CTb 488 (green) labeled cells in at ARA levels 67–71. b Anterograde tracers AAV-RFP and PHAL injected in different thalamic nuclei distinctly label BLA.am and BLA.al, which is evident in coronal (left) and sagittal (right) planes. Inset shows magnified version of boxed BLAa region. An asterisk denotes outer boundary of BLAa. c. Atlas representations of rostral (ARA 71) and caudal (ARA 75) regions of BLAa with and without domains. d Left: RVΔG injected in CPc.dm (green) and CPc.v (red) distinctly label BLA.am and BLA.al projection neurons, respectively. Insets show magnified version of boxed regions. Right: RVΔG injected in ACB medial labels BLA.ac neurons. Soma and dendrites of neurons selected for reconstruction are shown in pink. e Bar chart describes proportion of label per ARA section from representative anterograde tracer injections in BLA.am, BLA.al, and BLA.ac (n = 1 each) to show their discrete brain-wide connectional patterns. The ROIs for grids with strongest projections from each injection are displayed in parentheses (e.g., strongest projections from BLA.am neurons at ARA 39 are to OT lateral and ACB ventrolateral). Overall, BLA.am has stronger projections at rostral levels compared to BLA.al and BLA.ac. Caudal levels (ARA 85–99) receive more projections from BLA.ac than from BLA.am or BLA.al, primarily targeted to hippocampal structures CA1, SUB, and PAR. Each grid can include more than one ROI [e.g., (PL2, PL1)]. ** denotes anterograde projections that were not validated with retrograde tracers. f BLA.am, BLA.al, and BLA.ac projections to OT at ARA 39, which was split into medial (light blue) and lateral (dark blue) regions. BLA.am and BLA.al neurons target OT lateral, while those in BLA.ac target OT medial. Bottom panels show validation of these projections via retrograde FG injections. An OT lateral FG injection strongly labels BLA.am and BLA.al cells, but also BLAv cells, while an OT medial FG injection labels BLA.ac neurons and BLAp and BMAp neurons. The bar chart quantifies and visualizes the density of BLAa→OT connections at ARA levels 39 and 41 (n = 1 each). g BLA.am, BLA.al, and BLA.ac projections to ACB at ARA 41, which was split into medial (light orange), dorsolateral (orange), and ventrolateral (dark orange) regions. BLA.am and BLA.al neurons target mostly ACB ventrolateral, while those in BLA.ac innervate ACB medial. BLAa→ACB projections are shown with PHAL (green) injections made into BLA.am, BLA.al, and BLA.ac. Ellipses denote locations of retrograde tracer injections used to validate BLAa→ACB connections. CTb 555 injected into ACB ventrolateral regions labels BLA.am neurons (BLA.am→ACB ventrolateral), CTb 647 into ACB ventrolateral regions labels BLA.al neurons (BLA.al→ACB ventrolateral), and FG injected into ACB medial labels BLA.ac neurons (BLA.ac→ACB medial). Bar charts show quantified and visualized density of BLAa→ACB connections at ARA levels 39 and 41 (n = 1 each). Abbreviations: ac anterior commissure, ACAd dorsal anterior cingulate area, ACB nucleus accumbens, AONpv anterior olfactory nucleus posteroventral part, bic brachium of the inferior colliculus, BSTam anteromedial bed nucleus of stria terminalis, CA1_so CA1 stratum oriens, CA1_sp CA1 pyramidal layer, CA1_sr CA1 stratum radiatum, CA3_so CA3 stratum oriens, CA3_sp CA3 pyramidal layer, ccg genu of the corpus callosum, CM central medial thalamic nucleus, CPc caudal caudoputamen, CPc.dm caudal caudoputamen, dorsomedial part, CPc.v caudal caudoputamen, ventral part, CPi.dm intermediate caudoputamen, dorsomedial part, CPi.vl intermediate caudoputamen, ventrolateral part, CPi.vm intermediate caudoputamen, ventromedial part, CPc.d caudal caudoputamen, dorsal part, ECT ectorhinal cortical area, ENTl entorhinal cortex, lateral part, MB midbrain, MD mediodorsal thalamic nucleus, MOs secondary motor area, MRN midbrain reticular nucleus, NLOT nucleus of the lateral olfactory tract, OT olfactory tubercle, PAR parasubiculum, PL prelimbic cortical area, POST postsubiculum, PRE presubiculum, PT parataenial thalamic nucleus, PVT paraventricular thalamic nucleus, RR retrorubral area, SNc substantia nigra, compact part, SNr substantia nigra reticular part, SUBv_m ventral subiculum molecular layer, SUBv_sp ventral subiculum pyramidal layer, TR postpiriform transition area, VISal anterolateral visual area, VISam anteromedial visual area. See Table 1 for full list of abbreviations.
Fig. 2
Fig. 2. Data processing and analysis workflows.
a Summary of our 2D post-image processing pipeline. Images with fluorescent tracers (e.g., green PHAL fibers and pink CTb cells) are acquired under 10x magnification. Images are then imported into an in house software Connection Lens for (1) atlas correspondence to match each section to its corresponding ARA atlas template, (2) to warp data sections to atlas templates, (3) to threshold labeling, (4) filter artifacts, and (5) annotate the labels. Boxed region in (2) shows magnification of piriform cortex (PIR) to illustrate accuracy of registration details. Insets in (3) display magnified regions demonstrating accuracy of segmented PHAL fibers and CTb cells. In (4) asterisks highlight filtered artifacts to reduce false positive signals. Annotation was performed at the grid level (175 × 175 pixels) to capture topographic labels within ROIs that otherwise would go undetected [e.g., olfactory tubercle (OT), nucleus accumbens (ACB)]. Overlap processing (5) results in an file with annotated values: pixel density for anterograde tracers and cell counts for retrograde tracers. A modularity maximization algorithm is applied to the annotated data to assign labels to an injection site based on label density. Community assignments are color-coded by injection site and visualized for 32 ARA sections for anterograde and retrograde maps (available at https://mouseconnectomeproject.github.io/amygdalar/). b Workflow for delineating BLAa domain boundaries (also Supplementary Fig. 2). First, cases with domain-distinct labels were selected (n = 7) and contiguous sections through the BLAa were collected, imaged, and registered. Labels for each case were manually mapped onto a standard atlas in individual layers. Borders were manually drawn guided by mapped labels, but also by Nissl cytoarchitecture (Supplementary Fig. 3b). The same data was used to train a machine learning algorithm, which produced similar automated delineations of BLAa domains (Supplementary Fig. 3a). c Validation of anterograde labeling with retrograde tracers. PHAL injected in BLA.ac labels CA3. A FG injection in CA3_sp pyramidal layer back-labels BLA.ac projection cells confirming the BLA.ac→CA3 connection. Inset is magnification of boxed region showing selective and confined CA3 projecting FG-labeled cells in BLA.ac.
Fig. 3
Fig. 3. BLAa connections with medial prefrontal cortex.
a Double co-injections of BDA/FG in PL(II/III) and PHAL/CTb in ILA(II/III) show the medial (BLA.am) and lateral (BLA.al) distinction of BLAa. PHAL and BDA fibers and FG cells are present in BLA.am, while CTb cells are in BLA.al suggesting PL→BLA.am, ILA→BLA.am, and BLA.al→ILA connections. b These connections were validated with a BLA.am PHAL/CTb injection, which shows strong fiber labeling in PL, especially layer II/III [BLA.am→PL(II/III)] and CTb labeling in PL(II) [PL(II)→BLA.am] and ILA(III) [ILA(III)→BLA.am]. The LA FG injection delineates the ILA. c The BLA.al→ILA connection was validated with a BLA.al PHAL injection, which showed strong fiber labels in ILA and DP. FG injection in BLA.al confirms the absence of an ILA→BLA.al connection. **denotes lack of FG ILA labeling. d BLA.ac shows unique connections with MPF. A PHAL/CTb injection in PL shows CTb labeled BLA.ac projection cells, but sparse PHAL fiber labels in BLA.ac, suggesting a BLA.ac→PL connection. PHAL fibers from PL localize mostly in rostral BLA.am. A PHAL/CTb injection in ILA(V) shows strong fiber projections in BLA.ac suggesting a strong ILA→BLA.ac connection. Only a few CTb cells are present in BLA.ac suggesting a weak BLA.ac→ILA connection. e A BLA.ac PHAL/CTb injection validates these connections, showing strong projections to PL, especially layer II/III [BLA.ac→PL(II/III)] and CTb labeled cells in layers II–V of ILA (ILA→BLA.ac). f Top panel: anterograde labeling from tracer injections made primarily in BLA.am (PHAL) and BLA.al (AAV RFP) shows their topographic projections to PL/ACA and ILA/DP, respectively. Bottom panel: anterograde labeling from tracer injections made primarily in BLA.ac (PHAL) and BLA.al (AAV GFP) shows their distinct connections with PL, ILA, ACB, OT, and CP. Note the stronger projections from BLA.am to dorsal PL/ACA compared to projections from BLA.ac to more ventral parts of PL. This distinction can be seen in the anterograde map in (g). g BLAa domains share unique input/output connections with MPF, especially layers II/III, which is summarized in this schematic. Note (1) the reciprocal connections between the BLA.am and ACA and PL (dorsal), (2) BLA.al projections mostly to ILA, and (3) the unique BLA.ac connections with strong projections to PL (ventral), but strong input from ILA. h Schematic summarizing connections of all BLA nuclei with MPF areas. i Community detection confined to BLA projections to isocortical areas was run and visualized in a matrix. The matrix was reordered such that injection sites grouped with their strongest projections are arranged along the diagonal. Grouped injection sites and their connections are boxed in different colors. The weighting of each connection is indicated by a color gradient from black (very strong) to white (very weak). Matrix analysis was ROI based, not grid-based. BLA.am and BLA.ac were grouped with projections to PL(I–III,VI), ORBm, and ACAd among the strongest. The BLA.al and BLAp were grouped with strongest projections to ILA, GU, and PL(V). The BLAv shows strongest projections to AI, GU, and PERI, the BMAp to ILA, ORBm, PERI, and the LA to ECT, TEa, and ILA. j Community detection confined to isocortical projections to BLA was run and visualized in a matrix, which shows BLA.ac and BMAp grouped with strongest input from ILA(II/III). The BLA.al, BLA.am, BLAv, LA, and BLAp were individually grouped. Note the strong inputs to BLAv from agranular insular areas (AI) and to LA from auditory cortices (AUD). See Table 1 for full list of abbreviations.
Fig. 4
Fig. 4. BLA.ac connections with hippocampus.
a BLA.ac connections with hippocampal regions. A CTb (green) CA3 tracer injection selectively labels BLA.ac projection neurons (BLA.ac→CA3). Note the absence of labeled cells in BLA.am. A PHAL (pink) and CTb (pink) injection in PAR show the BLA.ac→PAR and PAR→BLA.ac connections. b These connections were validated with a PHAL/CTb BLA.ac injection that shows strong PHAL fiber labels in CA3 and PAR. c Summarized brain-wide connections of BLA.ac projection neurons. For full abbreviation list see Table 1. d Top panels show projections from BLA.am, BLA.al, BLA.ac, BLAp, BMAp, BLAv, and LA neurons to hippocampal regions. The BLA.ac, BLAp, and BMAp show strongest projections, with BLA.ac projecting to sp layers of CA1 and SUBv (BLA.ac→CA1_sp/SUBv), BLAp to CA1v and SUBv (BLAp→CA1v_sp/SUBv), and BMAp to sr and m layers of CA1v and SUBv (BMAp→CA1v_sr/SUBv_m/sr). Bottom panels show validation of these connections with FG and CTb injections marked 1–3 on top panels. Injections 1 and 2 show FG and CTb injections in intermediate (CA1i) and ventral (CA1v) CA1, respectively. Both injections back-label projection neurons in BLA.ac, while only the injection in CA1v labels BLAp neurons. Injection 3 is a CTb injection in SUBv, which labels BLA.ac, BLAp, and BMAp neurons. e Top panels show BLAa projections to rostral CA1 and more caudal CA1 and SUB. Boxed regions are numbered and magnified to the right. Bottom panels show projections from CA1 and SUB back to BLAa. Note exclusive BLA.ac connections with the hippocampus, particularly its caudal regions (Fig. 7n shows PHAL validation of these connections). f Community detection confined to BLA projections to hippocampal areas was run and visualized in a matrix. The matrix was reordered such that grouped injection sites and their strongest projections are arranged along the diagonal and boxed in different colors. The weighting of each connection is indicated by a color gradient from black (very strong) to white (very weak). Note (1) projections from BLA.ac to PAR and CA3, (2) from BLAp to CA1_sp and SUBv_sp, (3) from BLAv to ENTl (layers II and V), and (4) from BMAp to SUBv_sr. ** indicates strong connections that were not validated. g Community detection confined to hippocampal inputs to BLA was run and visualized in a matrix. Note (1) BLA.ac and BMAp are grouped with strong inputs from CA1 and SUBv and (2) BLA.am and BLA.al grouped with strong input from ENTl. Matrix analysis was ROI based, not grid based. h Schematic summarizing connections of all BLA nuclei with hippocampal areas. See Table 1 for full list of abbreviations.
Fig. 5
Fig. 5. Unique connections of BLA.am and BLA.al neurons.
a BLA.am projections to visual processing areas. Top panels: whole brain sections with labeled fibers in ACAd, ACAv, MOs-fef, CP caudal dorsomedial, and deep layers of VISam and VISal following a BLA.am PHAL injection. Bottom panels: magnified versions of PHAL labeled fibers in visual associated areas. b Summarized brain-wide connections of BLA.am projection neurons. For full list of abbreviations see Table 1. c BLAa connections with ORBvl. BLA.am neurons project to ORBvl(I/II), while BLA.al neurons project to ORBl(V/VI). Projections in ORBvl from BLA.ac case were not validated. A CTb ORBvl injection solely back-labels BLA.am neurons confirming a BLA.am→ORBvl connection. ORBvl neurons do not project back to BLA.am as shown by the PHAL ORBvl injection. Schematic adapted from demonstrates pattern of inputs to frontal cortex from visual information processing areas like VIS, ACAd, ACAv, and PTLp, which is similar to prefrontal input patterns from BLA.am. d Anterograde map shows BLA.am projections to ACAv and MOs-fef validated with retrograde injections of CTb and FG (BLA.am→ACAv/MOs-fef). e Left: retrograde map with back-labeled neurons in visual LP following a retrograde tracer injection into BLA.am. Right: PHAL injection in visual LP labels fibers in BLA.am, and also LA, confirming LP→BLA.am/LA projections. f Left: anterograde map of BLA.am and BLA.ac projection fibers to CP caudal dorsomedial (CPc.dm) at ARA 61 superimposed with CP caudal domains. Right: a screenshot of our cortico-striatal map at ARA 61 showing projections from visual areas like VISp, VISam, VISal, ACA, RSP, and PTLp to CP caudal dorsomedial (http://www.mouseconnectome.org/CorticalMap/page/map/5). FG injection in CPc.dm back-labels BLA.am neurons confirming the BLA.am→CPc.dm connection. g Summarized brain-wide connections of BLA.al neurons. For full list of abbreviations see Table 1. h BLA.al projections to gustatory/visceral CP. Top left shows anterograde map of BLA.al projection fibers at ARA 53 superimposed with domains of CP intermediate (CPi). BLA.al neurons target CPi.vl and CPi.vm, which also receive input from AI, PIR, VISC, GU, and somatosensory and somatomotor regions associated with mouth regions. Retrograde tracers CTb 555 and CTb 647 in these CP domains back-label projection neurons in BLA.al. Bottom panels: CP caudal ventral (CPc.v), which receives input from GU and VISC is also targeted by BLA.al. A CTb injection in CPc.v back-labels BLA.al neurons to confirm this (BLA.al→CPc.v). i. Top: AId neurons target BLA.al and LA as shown with an AId PHAL injection. Bottom: BLA.al retrograde injection back-labels AId neurons (AId→BLA.al). j AIv shows weak projections to BLA.am and stronger projections to LA and BLAv. AIp neurons target mostly BLAv and BMAp. k. Retrograde map shows neurons in GU that project to BLA.al (GU→BLA.al). A FG injection in GU(V) reveals BLA.al projection neurons target GU [BLA.al→GU(V)]. l. Retrograde map shows back-labeled neurons in PF/VPMpc from BLA.al retrograde injection suggesting a PF/VPMpc→BLA.al connection. An anterograde AAV-RFP injection in the thalamic region labels BLA.al, validating the projection. m BLA.al projection neurons target somatomotor and somatosensory regions presumably associated with orofacial information processing including the MOs/MOp ul (upper limb) and SSp/MOp m (mouth). Retrograde tracer injections in these regions clearly label BLA.al neurons. See Table 1 for full list of abbreviations.
Fig. 6
Fig. 6. BLAa-thalamic connections and BLAa functional diagrams.
a Bar chart showing proportion of back-labeled thalamic neurons from representative retrograde tracer injections in BLA.am, BLA.al, and BLA.ac (n = 1 each). ROIs for grids with strongest labels from each injection is included. A grid can include multiple ROIs [e.g., (PT, PVT)]. Note the greater proportion of thalamic PVT labeling from BLA.ac injection at rostral levels (ARA 57, 61) versus the larger proportion of thalamic PVT label from BLA.am and BLA.al injections in caudal levels (ARA 73), which substantiates the rostral and caudal PVT distinction. Also, greatest thalamic input to BLA.am is from caudal PVT (caudal PVT→BLA.am), greatest input to BLA.al is from caudal PVT, PF, and IMD (caudal PVT/PF/IMD→BLA.al), and greatest input to BLA.ac is from PT and rostral PVT (PT/rostral PVT→BLA.ac). ** denotes connections that were not validated with anterograde tracing. b Retrograde maps from ARA 57–75 showing back-labeled thalamic nuclei from injections in BLA.am, BLA.al, and BLA.ac that corroborate the bar chart in (a). c PHAL injection in rostral PVT validates the rostral PVT→BLA.ac connection. d PHAL injection in PT validates the PT→BLA.ac connection, but also shows strong PT projections to LA and BMAp (PT→BMAp/LA). e. BLA.am connections with areas associated with visual processing. f BLA.al connections with areas associated with gustatory and orofacial information processing. g BLA.ac connections with areas involved in reinstatement of drug seeking behavior. h BLAv connections with visceral/gustatory information processing areas. See Table 1 for full list of abbreviations.
Fig. 7
Fig. 7. Connections of BLAp, BMAp, and BLAv.
a Anterograde maps showing BLAp and BMAp neuron projections to BST. BLAp neurons target lateral parts of BST, while those in BMAp target medial BST. bc Validation of BLAp projections to BST. Retrograde tracers in BSTov/ju/rh (b) and BSTal (c) back-label BLAp neurons validating the BLAp→BSTal/ov/ju/rh projections. Note the absence of labels in BMAp. Insets are magnification of injection site regions. d Validation of BMAp→BSTam/pr projection. Retrograde tracer injection placed more medially than those in (b) and (c) (BSTam included) now labels BMAp neurons and some neurons in BLA.ac and LA. Inset shows magnification of injection site region. BST bed nucleus of stria terminalis, BSTov BST oval nucleus, BSTju BST juxstacapsular nucleus, BSTrh BST rhomboid nucleus, BSTal BST anterolateral nucleus, BSTam BST anteromedial nucleus, BSTpr principal nucleus. e Top panels: BLAp neurons project to rostral (LSr) and caudal (LSc) lateral septal nuclei and BMAp projects to LSr. Bottom panels validate these connections (BLAp→LSr/c and BMAp→LSr). Retrograde injection in dorsomedial hypothalamic nucleus (DMH: f) and anterior hypothalamic nucleus (AHN: g) validates BMAp neuron projections to the hypothalamic regions (BMAp→DMH/AHN). h Validation of BMAp/BLAp to lateral hypothalamic area (LHA) via LHA retrograde injection. Ellipses on anterograde maps denote location of retrograde injection for validation. i Summarized brain-wide connections of BLAp neurons. j Summarized brain-wide connections of BMAp neurons. For full list of abbreviations see Table 1. k FG injection in medial preoptic nucleus (MPN)/medial preoptic area (MPO) validates BMAp neuron projections to those hypothalamic nuclei (BMAp→MPN/MPO). l CTb injection in lateral preoptic area (LPO) validates BLAp neuron projections to the hypothalamic nucleus (BLAp→LPO). Ellipses on anterograde maps to the left denote location of retrograde tracer injections. m Top panels: projections from BLA.am, BLA.al, BLA.ac, BLAp, BMAp, BLAv, and LA to the tuberal region of LHA and to ventromedial hypothalamic area (VMH). Strongest projections to VMH are from BMAp neurons, and strongest input to LHA are from BLAp and BMAp neurons. Bottom panels validate these connections. Retrograde tracer injections 1 (CTb) and 2 (FG) in LHA back-label both BLAp and BMAp projection neurons (BMAp/BLA→LHA), while FG injection 3 in VMH back-labels selectively BMAp projection neurons (BMAp→VMH). Insets show magnification of injection site regions. n Top panels: retrograde maps showing SUBv back-labeled cells from retrograde tracer injections in BLAp and BMAp (left) and CA1v labeled cells from BMAp retrograde tracer injection (right). Ellipses denote locations of PHAL injections in bottom panels. Bottom panels: PHAL injection in SUBv labels BLA.ac, BLAp, and BMAp validating SUBv→BLA.ac/BLAp/BMAp connections. PHAL injection in CA1v labels fibers in BLA.ac and BMAp, but not BLAp validating the CA1v→BLA.ac/BMAp connections. o Summarized brain-wide connections of BLAv neurons. For full list of abbreviations see Table 1. p Shows location of BLAv. q Top panels show anterograde projections from BLAv, while bottom ones show projections from intermediodorsal thalamic nucleus (IMD). Note the similarity in labeling from the two injection cases in GU (gustatory cortical area), AId (agranular insular area, dorsal part), CPi.vm (CP intermediate, ventromedial), CPc.v (CP caudal, ventral), and ENTl (entorhinal cortical area, lateral part) particularly layer V. r FG injection in CPi.vm/vl back-labels BLA.al and BLAv projection neurons (BLA.al/BLAv→CPi.vm/vl), but also neurons in thalamic nuclei CM (central medial) and IMD. s–t FG injection in CP caudal ventromedial, where BLAv and IMD project, back-labels neurons in regions proposed to be involved in gustatory/visceral processing like IMD, CM, VISC (visceral cortical area), MOp mouth regions, GU (gustatory cortical area), and AI (agranular insular cortical area). u Like the BLAv and IMD, the AI also projects to ENTl(V). v A PHAL injection in ENTl(V) shows that it projects back to BLAv, but also to BLA.al [ENTl(V)→BLAv/BLA.al].
Fig. 8
Fig. 8. LA connections, flatmaps of BLAa anterograde tracing, and BLAa functional recordings.
a Summarized brain-wide connections of LA (ventromedial) neurons. For full list of abbreviations see Table 1. b Anterograde maps in top panels show weak projections from LA neurons to hippocampal regions SUBv and CA1v. Ellipse denotes location of CTb injection, which validates these sparse connections. c Retrograde map shows labeled cells in auditory cortical areas (AUD) following an LA retrograde tracer injection. Ellipse denotes location of PHAL injection in the primary auditory cortical area (AUDp), which shows strong anterograde label in LA validating AUD→LA connections. d LA receives strong input from ventromedial hypothalamic nucleus (VMH), as shown by the retrograde map. An AAV-RFP injection in VMH validates the VMH→LA connection showing strong label in LA, but also in BMAp (VMH→BMAp). The outputs of BLA.am (e), BLA.al (f), and BLA.ac (g) domains are represented at the macroscale level (gray matter region resolution) on a partial mouse brain flatmap. The strength values of detected connections were binned into tertiles, and these are represented qualitatively as strong (maroon), moderate (red), weak (pink), and none (gray). h Longitudinal half of the entire CNS flatmap showing orientation and major brain divisions. The key to the color codes for connection strength is also shown. iq Functional characterization of synaptic innervation of projection-defined BLAa neurons. i, l, o Schematic drawings of experimental design and proposed circuitry. AAV-hSyn-ChR2-YFP (ChR2) is injected into PL (i), AId (l), or ILA (o) to label projection axons in BLA.am, BLA.al, and BLA.ac, respectively. Red retrobeads are injected into CP caudal dorsomedial (CPc.dm), CP caudal ventral (CPc.v), or CA3 to back-label projection neurons in BLA.am, BLA.al, or BLA.ac, respectively. Recordings are made from BLAa neurons labeled with red retrobeads while ChR2 labeled axons in BLA are stimulated. j, m, p LED pulse (5 ms)-evoked averaged response traces of an example neuron recorded at −70mV and +10 mV. Recordings were made in the presence of TTX and 4-AP to block polysynaptic inputs so that only monosynaptic excitatory responses are elicited. Average (± standard deviation) peak amplitude and latency of light pulse evoked EPSCs in red retrobead labeled BLA.am (k; 11/12 recorded neurons), BLA.al (n; 7/8 recorded neurons), and BLA.ac (q; 12/13 recorded neurons) neuron populations. Source data are provided as a Source Data file. r Left: excitatory and inhibitory responses (superimposed traces) evoked by blue light stimulation (5 ms). Right, responses from the same recorded cell in the presence of TTX and 4AP to show blockade of IPSPs.
Fig. 9
Fig. 9. BLAa neuron morphology.
a Result of Sholl-like analysis to show overall view of BLAa projection neuron dendritic morphology. Graph shows that dendrites of neurons within the BLA.ac have a larger surface area of dendritic compartments at ~45% distance from the cell body compared to dendritic compartments of BLA.am and BLA.al neurons. This larger dendritic surface area suggests the potential for a greater number of synaptic contacts for BLA.ac neurons. b 3D scatterplot of principal component analysis (PCA) shows segregation of BLAa domain-specific neurons based on measured morphological features. c Contralateral medial accumbens (ACB) projecting BLA.ac neurons. Neurons were labeled via a rabies virus injection in the ACB medial and neurons in contralateral BLA.ac were manually reconstructed. d All reconstructed dorsal striatum projecting BLA.am (n = 8) and BLA.al (n = 9) neurons and ventral striatum projecting BLA.ac neurons (n = 6). Reconstructions were used to assess differences in morphological features across the domain-specific projection neurons. ef Two-sided pairwise Wilcoxon rank sum tests were run on morphometric data and the parameters that survived the false discovery rate (FDR) correction for multiple testing are reported. Significant group differences are presented with whisker plots in panel (f) and the degree of their significance is visualized in a matrix in (e). Somatic features are presented in black font and dendritic features are in red. The center line represents the median, the box limits the upper and lower quartiles, and the whiskers the 1.5x interquartile range. * denotes p < 0.05, ** p < 0.005, *** p < 0.0005, and ns = not significant. See Statistical analysis of morphometrics in “Methods” for full statistical reporting. Source data are provided as a Source Data file. The dendrogram on top of the matrix shows the hierarchical clustering of groups based on feature similarity. It suggests that BLA.am and BLA.al neurons differ more from those in BLA.ac than they do from each other. g Persistence-based neuronal feature vectorization framework was also applied to summarize pairwise differences between BLA.am, BLA.al, and BLA.ac projection neurons. The strength of the differences is presented as a gradient with blue showing no difference and orange the greatest differences. The individual neuron differences are aggregated in (h), which shows once again that neurons within BLA.am, BLA.al, and BLA.ac all differ from one another, but that the greatest difference lies between BLA.am/BLA.al neurons versus BLA.ac neurons.

Comment in

References

    1. Quirk GJ, Mueller D. Neural mechanisms of extinction learning and retrieval. Neuropsychopharmacol. 2008;33:56–72. doi: 10.1038/sj.npp.1301555. - DOI - PMC - PubMed
    1. Maren S. Seeking a spotless mind: extinction, deconsolidation, and erasure of fear memory. Neuron. 2011;70:830–845. doi: 10.1016/j.neuron.2011.04.023. - DOI - PMC - PubMed
    1. Tye KM, et al. Amygdala circuitry mediating reversible and bidirectional control of anxiety. Nature. 2011;471:358–362. doi: 10.1038/nature09820. - DOI - PMC - PubMed
    1. Sharp BM. Basolateral amygdala and stress-induced hyperexcitability affect motivated behaviors and addiction. Transl. psychiatry. 2017;7:e1194. doi: 10.1038/tp.2017.161. - DOI - PMC - PubMed
    1. Fuchs RA, et al. The role of the dorsomedial prefrontal cortex, basolateral amygdala, and dorsal hippocampus in contextual reinstatement of cocaine seeking in rats. Neuropsychopharmacol. 2005;30:296–309. doi: 10.1038/sj.npp.1300579. - DOI - PubMed

Publication types