. 2021 May 17;12(1):2860.
doi: 10.1038/s41467-021-22842-5.

Direct contribution of skeletal muscle mesenchymal progenitors to bone repair

Affiliations

Direct contribution of skeletal muscle mesenchymal progenitors to bone repair

Anais Julien et al. Nat Commun. .

Abstract

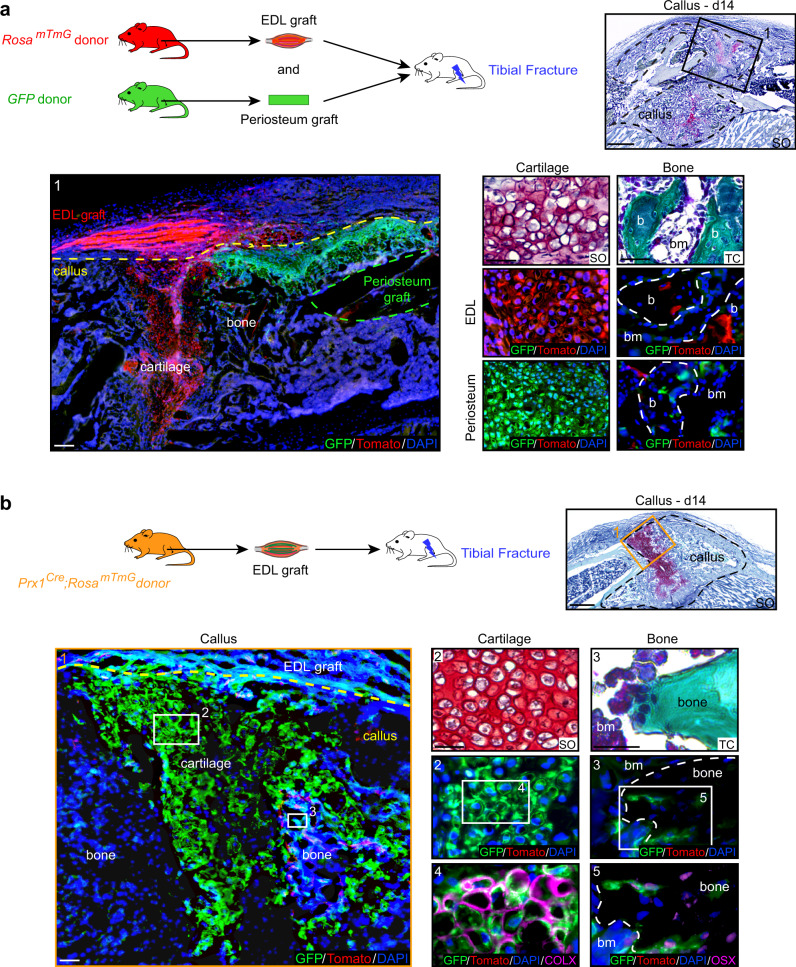
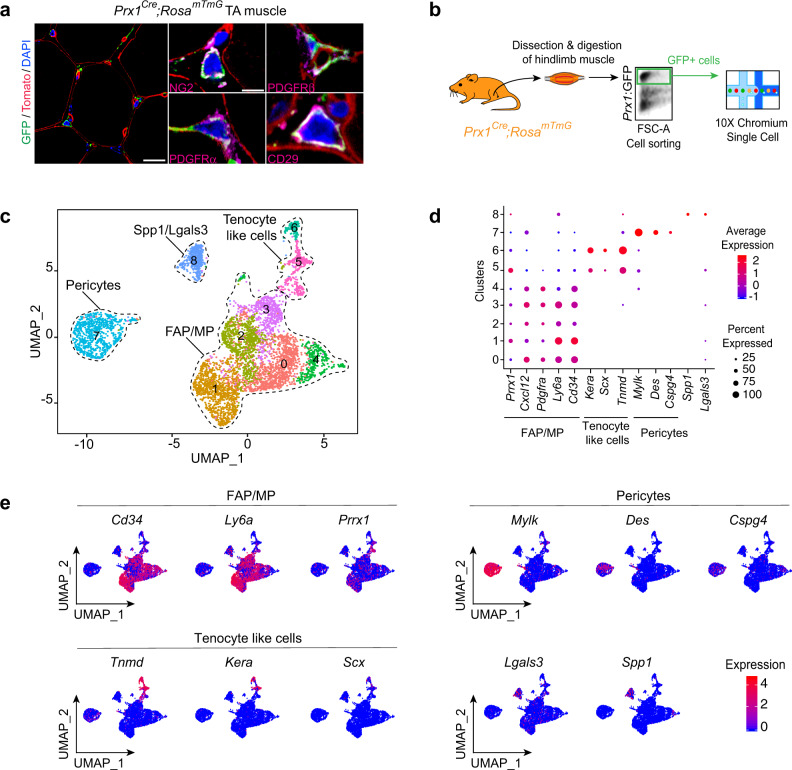
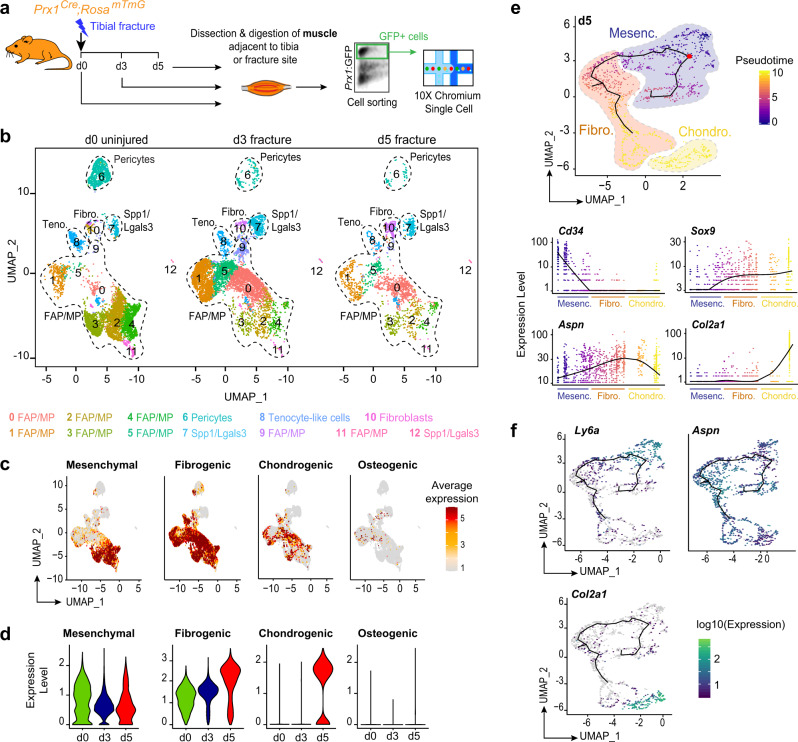
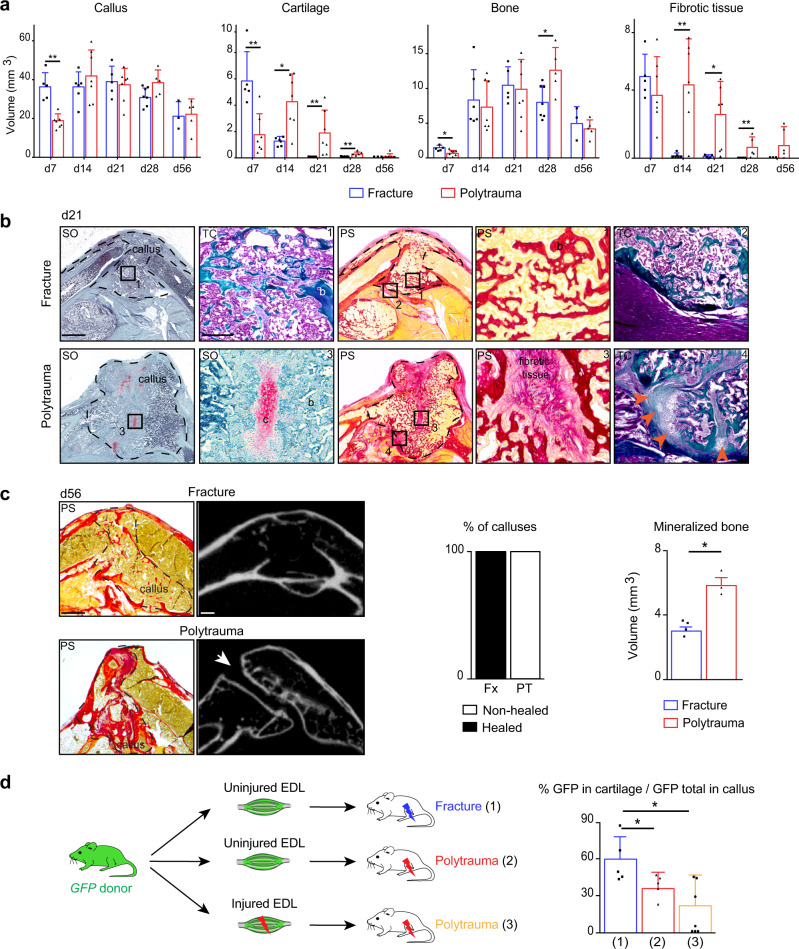
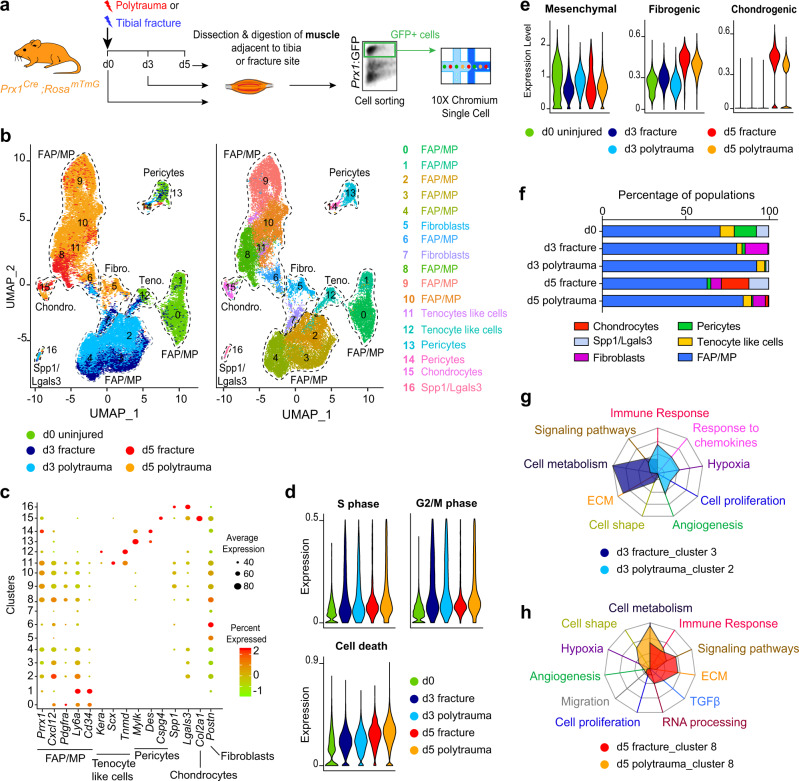
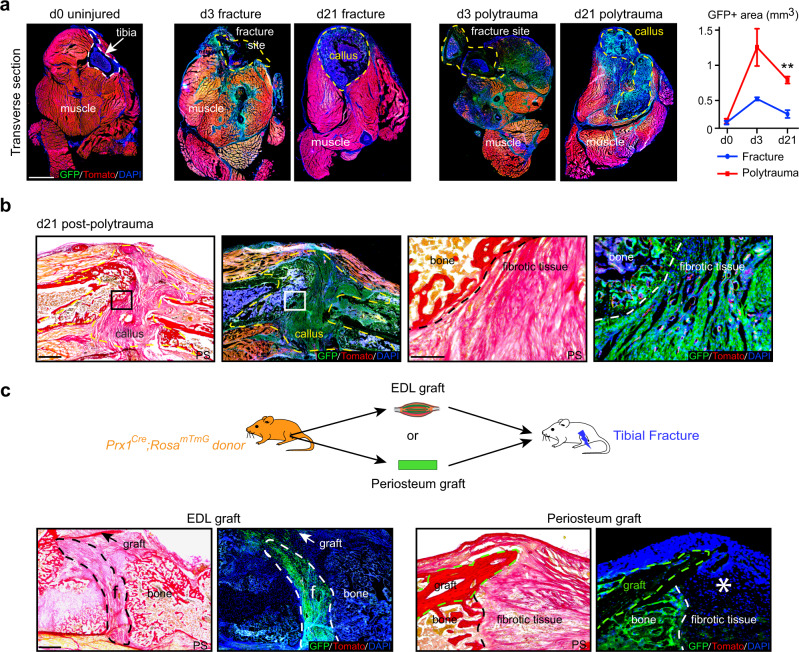
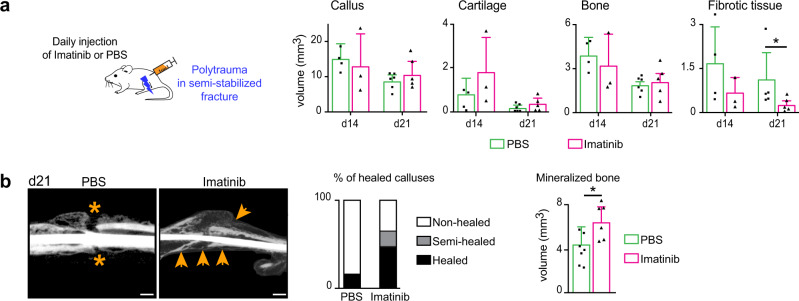
Bone regenerates by activation of tissue resident stem/progenitor cells, formation of a fibrous callus followed by deposition of cartilage and bone matrices. Here, we show that mesenchymal progenitors residing in skeletal muscle adjacent to bone mediate the initial fibrotic response to bone injury and also participate in cartilage and bone formation. Combined lineage and single-cell RNA sequencing analyses reveal that skeletal muscle mesenchymal progenitors adopt a fibrogenic fate before they engage in chondrogenesis after fracture. In polytrauma, where bone and skeletal muscle are injured, skeletal muscle mesenchymal progenitors exhibit altered fibrogenesis and chondrogenesis. This leads to impaired bone healing, which is due to accumulation of fibrotic tissue originating from skeletal muscle and can be corrected by the anti-fibrotic agent Imatinib. These results elucidate the central role of skeletal muscle in bone regeneration and provide evidence that skeletal muscle can be targeted to prevent persistent callus fibrosis and improve bone healing after musculoskeletal trauma.


Conflict of interest statement

The authors declare no competing interests.

Figures

Fig. 1
Fig. 1. Skeletal muscle is a source of chondrocytes and osteoblasts during bone repair.
a Top left, Experimental design of combined grafting of periosteum from GFP-actin mice and EDL muscle from RosamTmG mice at the site of non-stabilized tibial fracture in wild type hosts. Top right, Longitudinal section of the fracture callus (delimited by a black dotted line) at 14 days post-fracture and stained with Safranin’O (SO). Bottom left, Enlarged view of boxed region 1 on adjacent section counterstained with DAPI. EDL skeletal muscle graft outside the callus and skeletal muscle-derived cells within the callus (Tomato+ signal, callus delimited by a yellow dotted line). Periosteum graft (delimited by a green dotted line) and periosteum-derived cells within the callus (GFP+ signal). Bottom right, High magnification of cartilage and bone (b) derived from the EDL muscle graft (red) or from the periosteum graft (green) stained with SO and Masson’s Trichrome (TC) and adjacent sections counterstained with DAPI (bone delimited by a white dotted line). b Top left, Experimental design of EDL muscle from Prx1Cre;RosamTmG mice grafted at the site of tibial fracture in wild type hosts. Top right, Longitudinal section of fracture callus (delimited by a black dotted line) at 14 days post-injury and stained with SO. Bottom left, Enlarged view of boxed region 1 on adjacent section counterstained with DAPI. EDL muscle graft outside the callus and skeletal muscle-derived cells within the callus (GFP+ signal, callus delimited by a yellow dotted line). Bottom right, Enlarged view of cartilage (box 2) and bone (box 3) derived from the EDL muscle graft stained with SO and TC. High magnifications of boxed regions 4 and 5 immunostained with COLX and OSX antibodies (magenta, bone delimited by a white dotted line). Scale bar: low magnification = 200 μm, high magnification = 50 μm for cartilage and 25 μm for bone. bm bone marrow. DAPI in blue, GFP in green, Tomato in red. Representative images of three distinct samples.
Fig. 2
Fig. 2. Single-cell analyses of skeletal muscle mesenchymal progenitors in intact muscle.
a Transverse sections of TA muscle from Prx1Cre;RosamTmG mice immunostained with NG2, PDGFRβ, PDGFRα, or CD29 antibodies (magenta). DAPI-labeled nuclei in blue, GFP-labeled Prx1-derived cells in green and Tomato labeled non Prx1-derived cells in red. Representative images of three distinct samples. b Experimental design of scRNAseq experiment. Prx1-derived skeletal muscle cells were isolated from hindlimb skeletal muscles and sorted based on GFP-expression prior to scRNAseq. c UMAP projection of color-coded clustering of Prx1-derived cells reveals nine clusters defining four distinct populations (limited by a black dotted line). d Dotplot of indicated gene expression identifying FAP/MP, tenocyte-like cell, pericyte and Spp1/Lgals3 populations. e FeaturePlot of sub-population marker expression (Cd34, Ly6a, and Prrx1 for FAP/MP, Tnmd, Kera, and Scx for tenocyte like cells, Mylk, Des, and Cspg4 for pericytes and Lgals3 and Spp1 for Spp1/Lgals3 cells). Scale bars: low magnification: 30 μm, high magnification: 10 μm.
Fig. 3
Fig. 3. Single-cell analyses of skeletal muscle mesenchymal progenitors in response to bone fracture.
a Experimental design of scRNAseq analyses. Prx1-derived skeletal muscle cells were isolated from skeletal muscles surrounding the tibia at day 0, day 3, and day 5 post non-stabilized fracture and sorted based on GFP-expression prior to scRNAseq. b UMAP projection of color-coded clustering of integrated d0, d3, and d5 samples. Sub-populations are limited by a black dotted line and cluster identities are indicated below. Teno. tenocyte like cells, Fibro. fibroblasts. c FeaturePlot of mesenchymal, fibrogenic, chondrogenic and osteogenic lineages scores. d Expression of mesenchymal, fibrogenic, chondrogenic, and osteogenic lineages scores per sample. e Pseudotime analysis of FAP/MP at d5 post-fracture (top). Expression of Cd34, Aspn, Sox9, and Col2a1 genes along pseudotime (bottom). Fibro. fibrogenic, Mesenc. mesenchymal, Chondro. chondrogenic. f FeaturePlot of Ly6a, Aspn, and Col2a1 expression as markers of mesenchymal, fibrogenic, and chondrogenic lineages, respectively, in d5 post-fracture sample.
Fig. 4
Fig. 4. Polytrauma impairs bone healing and cellular recruitment from skeletal muscle.
a Histomorphometric quantification of callus, cartilage, bone, and fibrotic tissue volumes after non-stabilized tibial fracture or polytrauma through all stages of bone repair (d7 n = 5 and n = 7; d14, n = 6 and n = 7, d21 n = 5 and n = 7, d28 n = 7 and n = 5, d56 n = 3 and n = 5 for fracture and for polytrauma respectively) (Exact p-value calculated with two-sided Mann–Whitney test: Callus d7: 0.0025; Cartilage d7: 0.0051, d14: 0.0189, d21: 0.0025, d28: 0.0013; Bone d7: 0.0101, d28: 0.0303; Fibrotic tissue d14: 0.0023, d21: 0.0303 d28: 0.0013). b Representative callus sections stained with Safranin’O (SO), Trichrome (TC), and PicroSirius (PS) at days 21 (b: bone) (callus delimited by a black dotted line). Fully ossified callus and bone bridging in fracture (boxes 1, 2). Unresorbed cartilage (c), fibrosis (box 3) and absence of bone bridging (box 4, orange arrowheads) in polytrauma. c Representative callus sections stained with PS and micro-CT images of calluses at d56 post-fracture and polytrauma. Absence of bone bridging at d56 is pointed by a white arrow. Quantification of healed and non-healed calluses at d56 post-fracture or polytrauma (fracture n = 4, polytrauma n = 3). Quantification of mineralized bone volume at d56 post-fracture or polytrauma (Fx: fracture n = 4, PT: polytrauma n = 3) (Exact p-value calculated with t test with two-sided Welch correction: 0.0357). Scale bars: low magnification = 1 mm; boxed areas = 100 μm. d Experimental design of uninjured or injured EDL muscle grafts from GFP-actin mice transplanted at the fracture site of wild type hosts after fracture or polytrauma. Histomorphometric quantification of GFP+ signal in cartilage at day 14 post-injury ((1) n = 5, (2) n = 5, (3) n = 7) (Exact p-value calculated with two-sided Mann–Whitney test: (1) vs. (2): 0.0317, (1) vs. (3): 0.0303). All data represent mean ± SD. Images are representative of two independent experiments.
Fig. 5
Fig. 5. Single-cell analyses of skeletal muscle mesenchymal progenitors uncover impairment of initial fibrotic response in polytrauma.
a Experimental design of scRNAseq experiment. Prx1-derived skeletal muscle cells were isolated at d0, d3, and d5 post-non-stabilized fracture or post-polytrauma and sorted based on GFP-expression prior to scRNAseq. b UMAP projection of color-coded sample (left) and clustering (right) of integrated analysis of d0, d3, and d5 post-fracture and post-polytrauma samples. Sub-populations are delimited by a black dotted line. Sample and cluster identities are indicated below and on the right, respectively. c Dotplot of indicated gene expression identifying FAP/MP, tenocyte-like cell, pericyte, Spp1/Lgals3, chondrocyte, and fibroblast populations. d Expression of S and G2/M cell cycle phases and cell death scores per sample. e Pseudobulk expression of mesenchymal, fibrogenic and chondrogenic lineage score in d0, d3, and d5 post-fracture and post-polytrauma samples. f Percentage of each cell population per sample. g Radar chart of enriched Gene Ontology functions in cluster 3 corresponding to d3 post non-facture and cluster 2 corresponding to d3 post-polytrauma. h Radar chart of enriched Gene Ontology functions in d5 post-fracture versus d5 post-polytrauma in cluster 8. Teno. tenocyte like cells, Fibro. fibroblasts, Chondro. chondrocytes.
Fig. 6
Fig. 6. Callus fibrosis is produced by skeletal muscle mesenchymal progenitors in polytrauma.
a Left, Transverse sections of hindlimb from Prx1Cre;RosamTmG mice at day 0 (tibia bone delimited by a white dotted line), day 3 or d21 post-non-stabilized fracture or post-polytrauma (fracture site at d3 post-injury and callus at d21 post-injury delimited by yellow dotted line). Representative images of three distinct samples. Right, Quantification of GFP+ area within skeletal muscle (callus excluded) on transverse sections of hindlimb of Prx1Cre;RosamTmGmice at d0 (uninjured), d3 and d21 post-fracture and post-polytrauma (d0 n = 4, d3 post-fracture n = 3, d3 post-polytrauma n = 3, d21 post-fracture n = 4 and d21 post-polytrauma n = 3). Exact p-value calculated with t test with two-sided Welch correction: 0,0013. Scale bar: 0.5 mm. b Left. Longitudinal sections of fracture callus at day 21 post-polytrauma in Prx1Cre;RosamTmG mice stained with Picrosirius (PS) and adjacent sections counterstained with DAPI (callus delimited by a dotted line). Right, High magnification of boxed areas (dotted lines mark the limit between bone and fibrotic tissue). c Top: Experimental design of EDL muscle or periosteum grafts from Prx1Cre;RosamTmG mice transplanted at the fracture site of wild type hosts after polytrauma. Bottom: Longitudinal callus sections stained with PS and adjacent sections counterstained with DAPI at day 21 showing presence of GFP+ cells derived from EDL muscle graft in fibrotic tissue (delimited with a white dotted line) and presence of GFP+ cells derived from periosteum graft (delimited with a green dotted line) in bone but absence in fibrotic tissue (asterisk). ac Representative images of three independent experiments. DAPI in blue, GFP in green, Tomato in red. f fibrotic tissue. bc scale bars: low magnification:1 mm, high magnification: 300 μm. All data represent mean ± SD.
Fig. 7
Fig. 7. Imatinib decreases callus fibrosis and improves fracture healing after polytrauma.
a Daily injection of Imatinib® (50 mg/kg/day) or vehicle (PBS) after polytrauma in semi-stabilized tibial fracture. Histomorphometric analyses of total callus, cartilage, bone, and fibrotic tissue volumes of PBS-treated and Imatinib-treated mice at days 14 and 21 (d14 PBS-treated n = 4, d14 Imatinib-treated n = 3, d21 PBS-treated n = 6, d21 Imatinib-treated n = 5) (Exact p-value calculated with two-sided Mann–Whitney test: Fibrotic tissue d21: 0.0317). b Representative micro-CT images of fracture calluses in PBS-treated and Imatinib-treated mice. Absence of bone bridging in PBS-treated mice (orange asterix) and presence of bone bridging in Imatinib-treated mice (orange arrow). Quantification of healed and non-healed calluses at d21 post-treatment (PBS-treated n = 7, Imatinib-treated n = 6). Quantification of mineralized bone volume (right) (PBS-treated n = 7, Imatinib-treated n = 6) (Exact p-value using two-sided Mann–Whitney test: Mineralized bone d21: 0.0303). b: Representative images of three independent experiments. scale bars: 1 mm. All data represent mean ± SD.

References

    1. Julien A, et al. FGFR3 in periosteal cells drives cartilage-to-bone transformation in bone repair. Stem Cell Rep. 2020;15:955–67. doi: 10.1016/j.stemcr.2020.08.005. - DOI - PMC - PubMed
    1. Hu DP, et al. Cartilage to bone transformation during fracture healing is coordinated by the invading vasculature and induction of the core pluripotency genes. Dev. 2017;144:221–34. doi: 10.1242/dev.130807. - DOI - PMC - PubMed
    1. Colnot C. Skeletal cell fate decisions within periosteum and bone marrow during bone regeneration. J. Bone Miner. Res. 2009;24:274–82. doi: 10.1359/jbmr.081003. - DOI - PMC - PubMed
    1. Debnath S, et al. Discovery of a periosteal stem cell mediating intramembranous bone formation. Nature. 2018;562:133–9. doi: 10.1038/s41586-018-0554-8. - DOI - PMC - PubMed
    1. Duchamp De Lageneste, O. et al. Periosteum contains skeletal stem cells with high bone regenerative potential controlled by Periostin. Nat. Commun.9, 773 (2018). - PMC - PubMed

Publication types

MeSH terms