. 2021 May 17;12(1):2877.
doi: 10.1038/s41467-021-22872-z.

Longitudinal single-cell profiling reveals molecular heterogeneity and tumor-immune evolution in refractory mantle cell lymphoma

Affiliations

Longitudinal single-cell profiling reveals molecular heterogeneity and tumor-immune evolution in refractory mantle cell lymphoma

Shaojun Zhang et al. Nat Commun. .

Erratum in

Abstract

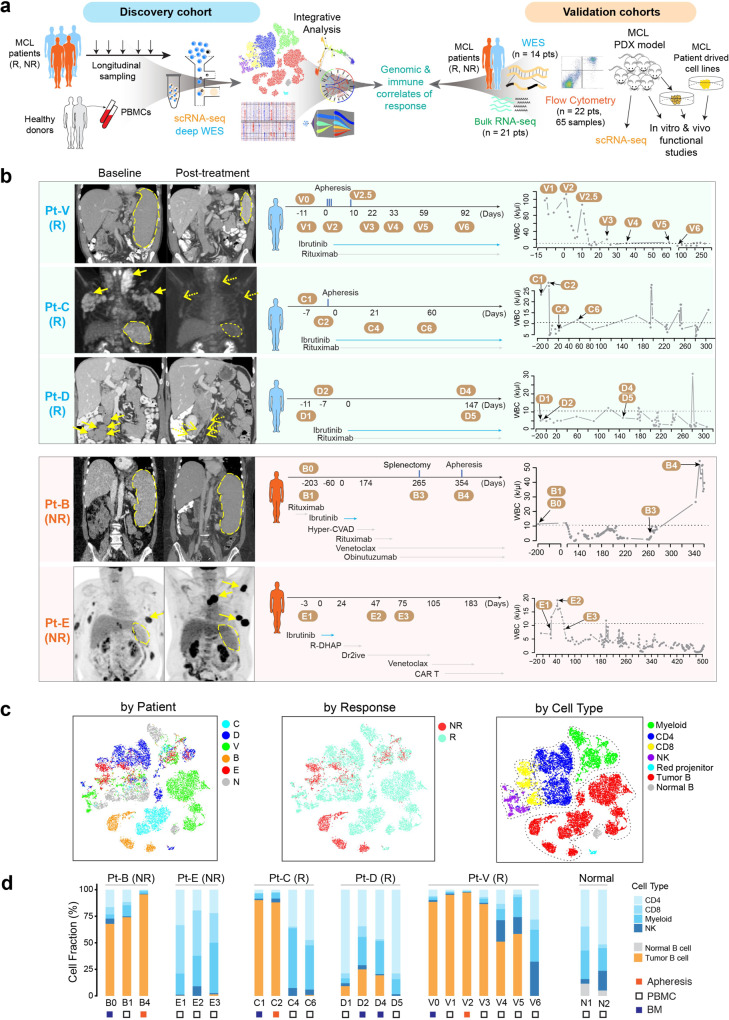
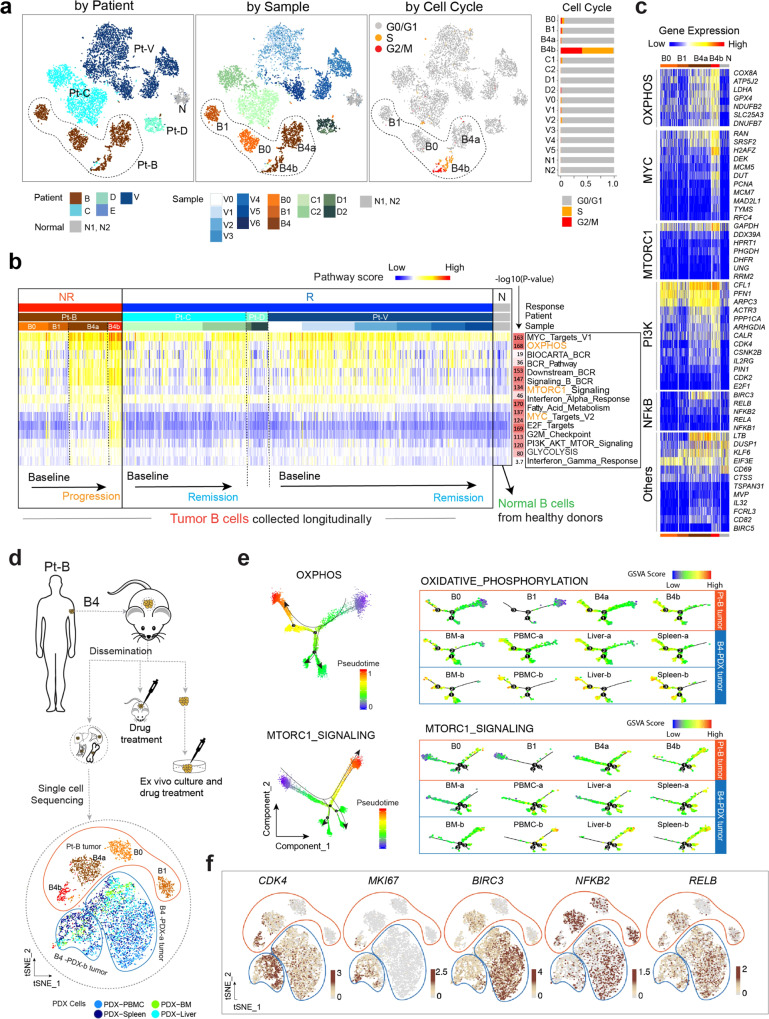
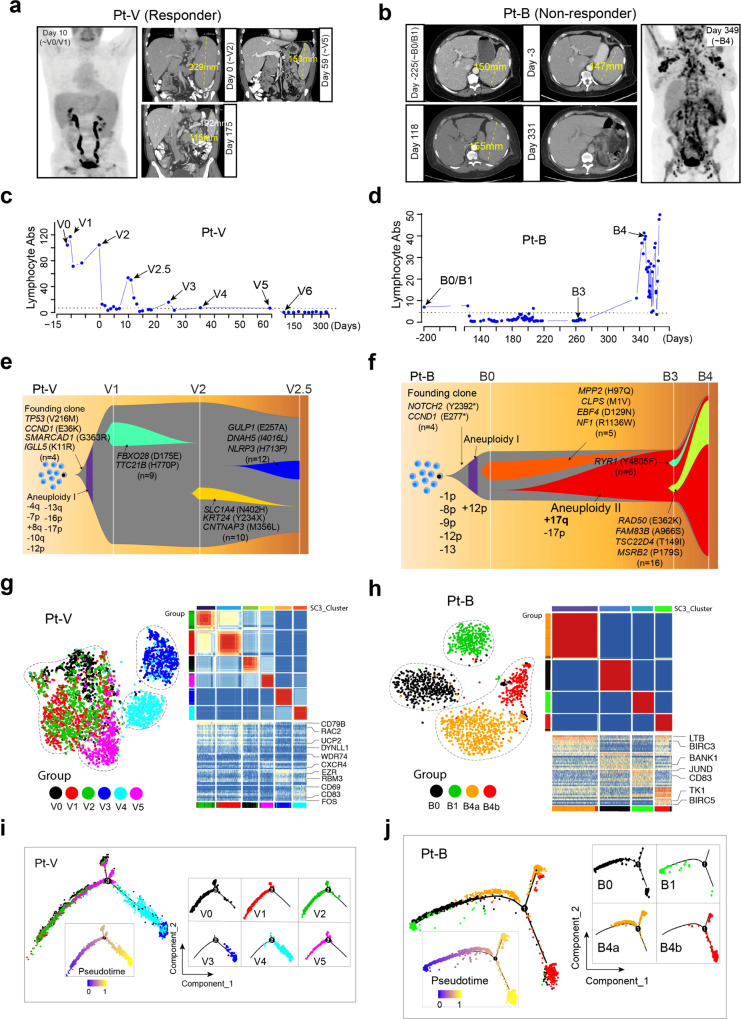
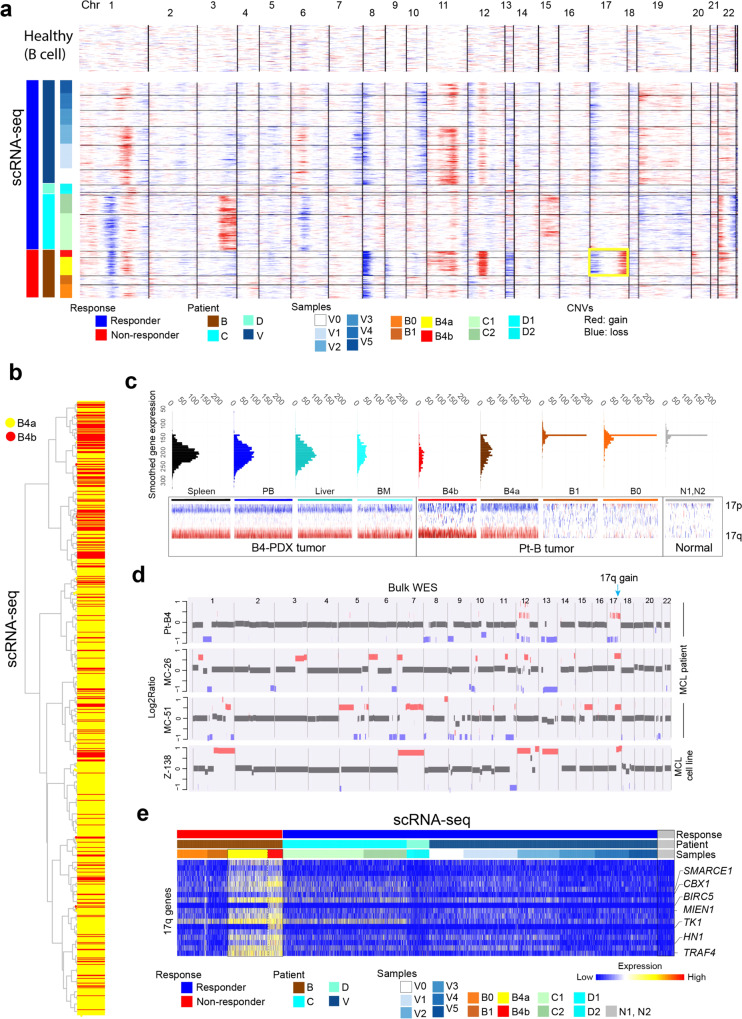
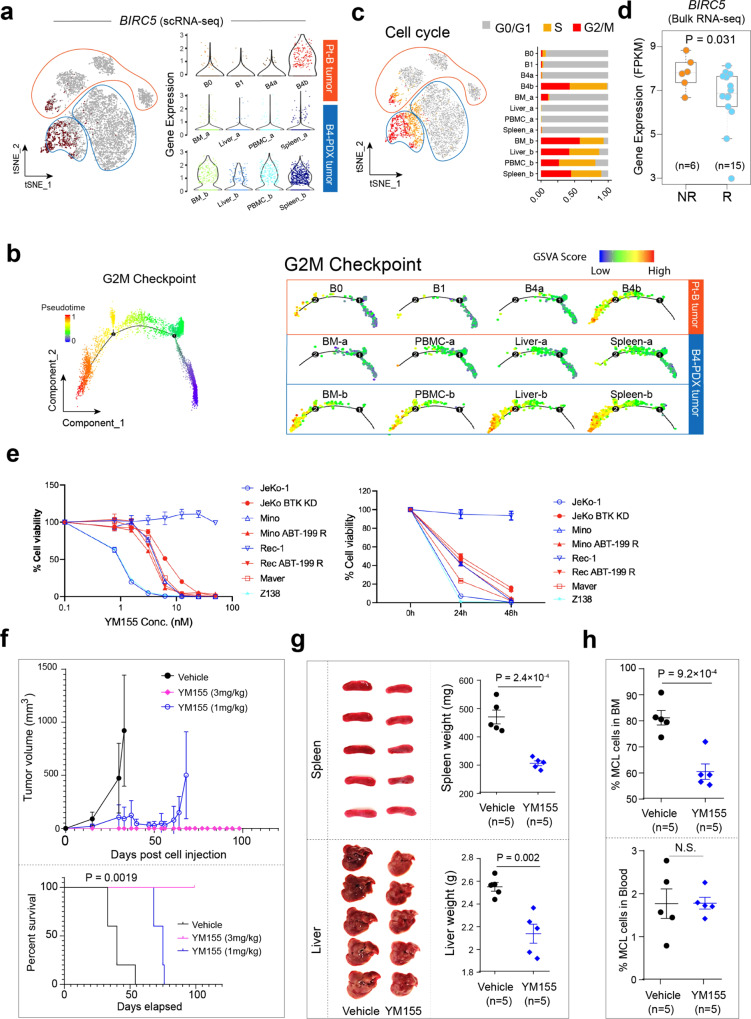
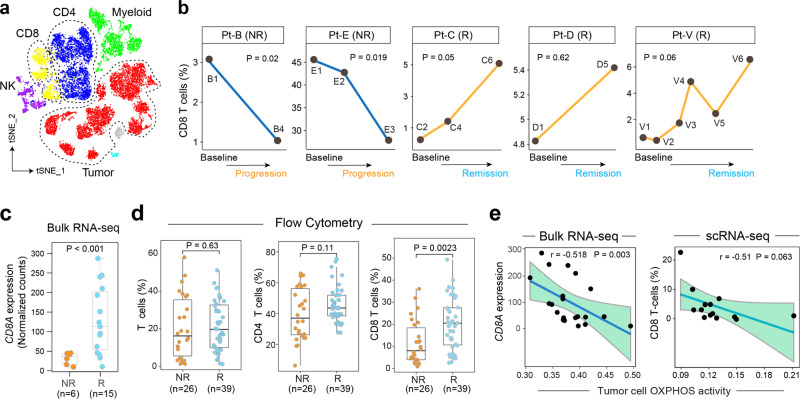
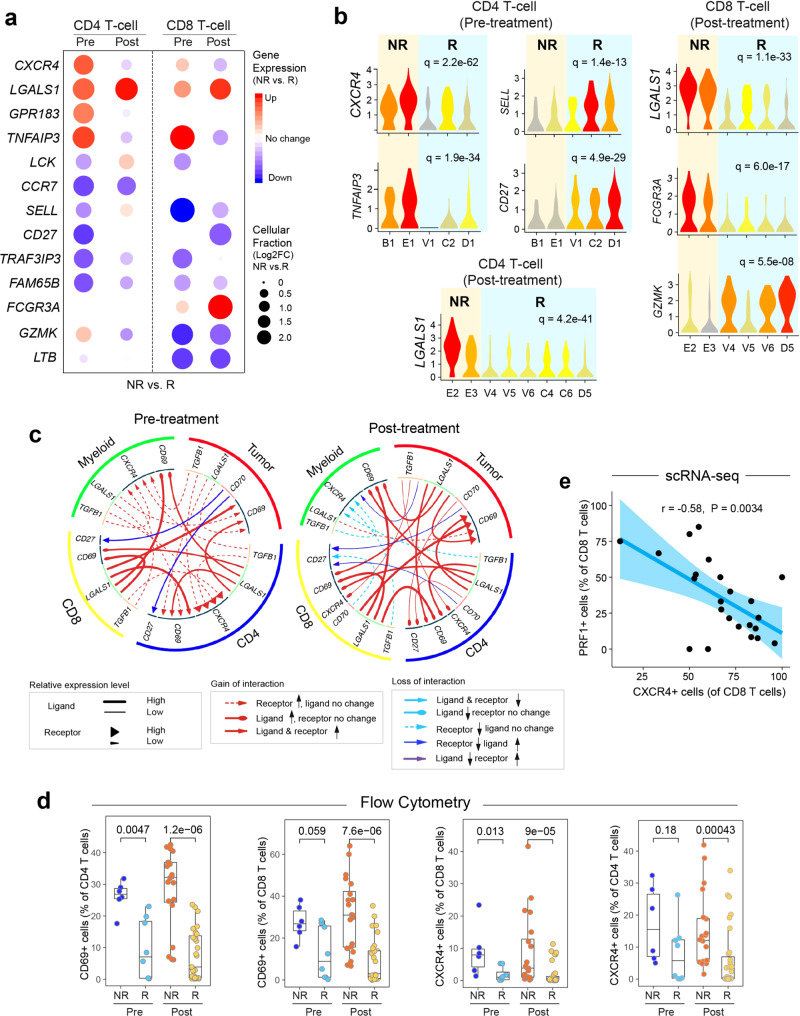
The mechanisms driving therapeutic resistance and poor outcomes of mantle cell lymphoma (MCL) are incompletely understood. We characterize the cellular and molecular heterogeneity within and across patients and delineate the dynamic evolution of tumor and immune cell compartments at single cell resolution in longitudinal specimens from ibrutinib-sensitive patients and non-responders. Temporal activation of multiple cancer hallmark pathways and acquisition of 17q are observed in a refractory MCL. Multi-platform validation is performed at genomic and cellular levels in PDX models and larger patient cohorts. We demonstrate that due to 17q gain, BIRC5/survivin expression is upregulated in resistant MCL tumor cells and targeting BIRC5 results in marked tumor inhibition in preclinical models. In addition, we discover notable differences in the tumor microenvironment including progressive dampening of CD8+ T cells and aberrant cell-to-cell communication networks in refractory MCLs. This study reveals diverse and dynamic tumor and immune programs underlying therapy resistance in MCL.


Conflict of interest statement

The authors declare no competing interests.

Figures

Fig. 1
Fig. 1. Longitudinal scRNA-seq of MCL during treatment.
a Schematic view of the experimental design to delineate therapeutic resistance of MCL. The discovery cohort included scRNA-seq and deep whole-exome sequencing (WES) of MCL cells collected longitudinally from three responders (Rs) and two nonresponders (NRs), together with normal PBMCs from two healthy donors. The genomic and immune correlates of response identified from the discovery cohort were then cross-validated by multiple platforms including bulk RNA-seq, WES, and flow cytometry of independent patient cohorts, scRNA-seq of patient-derived PDX models, as well as in vitro and in vivo functional studies using MCL patient-derived cell lines. b Coronal or axial images from CT scans pre-ibrutinib treatment (baseline) and post-treatment (disease progression) (left). Spleen sizes were measured and labeled with schematics of treatment and sample collection time points for scRNA-seq (middle); as well as the kinetics of white blood cell (WBC) counts during the course of treatment (right). Specimens were collected at multiple time points before and during the treatment when feasible, including pretreatment, on-treatment, and progression samples. c A t-SNE overview of the cells that passed quality control. Each dot of the t-SNE (t-distributed stochastic neighbor embedding) plot represents a single cell. Cells are color-coded by subject (MCL patients B–E, V, and healthy donors N1/N2, cells are merged as N), ibrutinib response status (NR: non-responder; R: responder), and by the cell type. d Cell composition dynamics at different time points during sample collection.
Fig. 2
Fig. 2. The transcriptomic heterogeneity and evolution of cancer hallmarks is associated with therapeutic resistance.
a Color-coded t-SNE plots of the malignant B cells. Color-coded cell representation by subject (Responders: C, D, V; non-responders: B; and healthy donors: N1, N2), sample collection time, and by cell cycle stage. b Transcriptomic heterogeneity and evolution of cancer hallmarks associated with ibrutinib resistance. From the Molecular Signature Database (MSigDB), 50 hallmark cancer gene sets were downloaded, and a pathway activity score was calculated for each single cell. The top 13 cancer hallmark pathways upregulated in the progressive sample are shown. c Heatmap representation of differentially expressed genes (representative ones) from five selected pathways across cell sub-populations B0, B1, B4a, and B4b from patient B compared to normal samples (N). d Schematic view of the establishment of B4-derived PDX model and experimental strategy of sample collection for scRNA-seq analysis. e Developmental trajectories representation of malignant cell populations from patient B (B0, B1, B4a, and B4b) and B4-derived PDX tumors along inferred pseudotime by Monocle2. Each point corresponds to a single cell; all points are color-coded according to the inferred pseudotime. Monocle 2 was run with default parameters on the hallmark gene sets (OXPHOS and mTORC1 signaling) downloaded from MSigDB. f tSNE Plots featuring CKD4, MKI67, BIRC3, NFKB2 and RELB genes expression in cells from patient B tumor and B4-derived PDX tumors.
Fig. 3
Fig. 3. Cellular and transcriptomic characterization of ibrutinib-induced lymphocytosis in patient V and clonal evolution in patient B.
a, b The coronal or axial images from PET/CT scan pre- and during ibrutinib treatment. The size of the spleen was measured and labeled. c, d The kinetics of lymphocyte absolute count (Abs) measured during the course of treatment. Samples subjected to scRNA-seq are labeled. e, f Fish plots showing patterns of clonal evolution of tumors from patients B and V. Clonal evolution was inferred using somatic mutations and DNA copy number alterations identified by deep WES. The representative alterations of each clone are labeled. g, h t-SNE plots (left) and SC3 clustering (right) showing the cellular and transcriptomic characterization of the spleen compartment shift of tumor cells during treatment in patient V (left) and therapy induced evolution in patient B (right). i, j The developmental trajectories of tumor cells along pseudotime in a two-dimensional state-space inferred by Monocle2.
Fig. 4
Fig. 4. DNA copy number alterations and heterogeneity is associated with therapeutic resistance.
a Heatmap overview of the inferred copy number alterations (CNAs) in the malignant B cells across 22 chromosomes. Information on patient response status, patient and sample collection time point, were annotated in the left tracks. The yellow rectangle highlights the 17q copy number gain significantly enriched in the progression tumor B4. b A dendrogram based on the global CNV profiles showing intra-tumor cellular heterogeneity in B4 tumor cells between two subpopulations B4a to B4b. c ScRNA-seq validation of 17q gain in cells from B4-derived PDX tumors. d Cross-platform validation of the 17q gain in additional patient cohorts and resistant MCL cell lines using deep whole-exome sequencing (WES). The Log2Ratio plots of 4 representative samples are shown. e Expression heatmap showing genes upregulated in the progression tumor B4 and located at 17q.
Fig. 5
Fig. 5. Validation of key cancer hallmarks in the B4-derived PDX model and identification of survivin (BIRC5) as a target to overcome ibrutinib-venetoclax resistance.
a Feature plot of BIRC5 expression in cells from patient B tumor and B4-derived PDX tumors (same t-SNE plot as in Fig. 2D) (left). BIRC5 expression with violin plot (right). b Cells from panel A projected to a two-dimensional space by Monocle2. Each point corresponds to a single cell and cells are colored according to the inferred pseudotime (blue to red). Monocle2 was run with default parameters on the hallmark gene sets G2M Checkpoint downloaded from MSigDB. c Feature plot showing the cell cycle stage of each cell inferred by Seurat based on canonical cell cycle-related markers (left) and the relative proportion of cell cycle phase of cells from patient B tumor and B4-derived PDX tumors (right). d Differential BIRC5 expression via bulk RNA-seq comparing ibrutinib responders (n = 15) and nonresponders (n = 6) in a separate MCL patient cohort. The line in the box is the median value. The bottom and top of the box are the 25th and 75th percentiles of the sample. The bottom and top of the whiskers are the minimum and maximum values of the sample. p value corresponds to the two-sided Wilcoxon signed-rank test. e The in vitro efficacy of survivin inhibitor YM155 in MCL cell lines. YM155-induced cell toxicity in MCL cell lines (red: ibrutinib-resistant; blue: ibrutinib-sensitive) in a dose (left)- and time (right)-dependent manner. The experiments were performed in triplicate (n = 3). Error bars represent the standard deviation (SD). f Mice (n = 5 per group) were injected subcutaneously with freshly isolated B4-PDX cells and allowed for engraftment until the tumors became palpable. The mice were then treated with continuous infusion of YM155 at 0, 1.0 or 3.0 mg/kg for 28 days. Mice were sacrificed when tumor size reached 15 mm or at day 99 post cell inoculation as end point of experiment. Plots representing tumor volume (top) and survival curves (bottom) of control and YM155-treated mice. Error bars represent the standard deviation (SD). The log-rank test was used for survival analysis. g Images and weights of mouse spleens and livers from B4-PDX mice model treated with vehicle or YM155. Error bars represent the standard deviation (SD). h The proportion of MCL cells (hCD5+hCD20+) in mouse BM and PM disseminations in response to YM155 (n = 5) compared to the control vehicle (n = 5). The two-sided Student t test was used for statistical analysis in (g) and (h). Error bars represent the standard deviation (SD).
Fig. 6
Fig. 6. Tumor immune microenvironment diversity and evolution associated with therapeutic resistance.
a A t-SNE overview of the immune cells that passed quality control. Cells are color-coded by the defined cell types. b The dynamics of CD8 T cell proportion during treatment in responders (Rs) and non-responders (NRs). p Values estimated by the linear regression model. c Differential CD8A (CD8 T cell marker) expression via bulk RNA-seq comparing ibrutinib responders (n = 15) and non-responders (n = 6) in a separate MCL patient cohort. p = 8.6 × 10−4 from two-sided Wilcoxon signed-rank test. d Additional patient cohort validation using flow cytometry showing a decreased CD8+ T cell population in ibrutinib-resistant patients compared to ibrutinib-sensitive patients (n = 65 samples, collected from 22 patients). In c and d, the line in the box is the median value. The bottom and top of the box are the 25th and 75th percentiles of the sample. The bottom and top of the whiskers are the minimum and maximum values of the sample. p Values correspond to two-side Wilcoxon Signed-rank Test. e Reverse correlation between CD8A expression or CD8+ T cell (%), and the tumor cell OXPHOS activity assessed by scRNA-seq. The Pearson correlation coefficient (r) is shown. The bounds of shape correspond to 95% confidence band for the regression line. p Values in b and e correspond to F test of linear regression model.
Fig. 7
Fig. 7. Aberrant cell-to-cell communication signaling associated with therapeutic resistance.
a Differentially expressed genes (NR vs. R) in CD4+ and CD8+ T-cells pre- and post-ibrutinib treatment, respectively. Filled circle sizes are proportional to the Log2-scaled fold changes of each gene. Upregulated genes are shown in red; downregulated genes are shown in blue. Pre: pre-treatment; Post: post-treatment. b Representative genes are shown in violin plots. c Alterations (NR vs. R) of ligand-receptor-based cell-to-cell communication networks based in pre- and post-treatment samples. d Flow cytometry validation of upregulated CD69 and CXCR4 expression in ibrutinib nonresponders in comparison to the responders in additional patient cohorts (n = 65 samples collected from 22 patients). The line in the box is the median value. The bottom and top of the box are the 25th and 75th percentiles of the sample. The bottom and top of the whiskers are the minimum and maximum values of the sample. p Values from the two-side Wilcoxon Signed-rank Test are shown. e Reverse correlation between the proportion of PRF1+ CD8 T cells (cytotoxic) and the expression of CXCR4 using scRNA-seq. The bounds of shape correspond to 95% confidence band for the regression line. The Pearson correlation coefficient (r) is shown. p Value corresponds to F test of linear regression model.

References

    1. Argatoff, L. H., Connors, J. M., Klasa, R. J., Horsman, D. E. & Gascoyne, R. D. Mantle cell lymphoma: a clinicopathologic study of 80 cases. Blood89, 2067–2078 (1997). - PubMed
    1. Bea, S. et al. Landscape of somatic mutations and clonal evolution in mantle cell lymphoma. Proc. Natl Acad. Sci. USA110, 18250–18255 (2013). - PMC - PubMed
    1. Gujral, S. et al. A clinicopathologic study of mantle cell lymphoma in a single center study in India. Indian J. Pathol. Microbiol.51, 315–322 (2008). - PubMed
    1. Hankin, R. C. & Hunter, S. V. Mantle cell lymphoma. Arch. Pathol. Lab. Med.123, 1182–1188 (1999). - PubMed
    1. Kauh, J., Baidas, S. M., Ozdemirli, M. & Cheson, B. D. Mantle cell lymphoma: clinicopathologic features and treatments. Oncology17, 879–891 (2003). 896; discussion 896–878. - PubMed

Publication types

MeSH terms