. 2021 May 17;12(1):2885.
doi: 10.1038/s41467-021-23005-2.

TRPM7 kinase-mediated immunomodulation in macrophage plays a central role in magnesium ion-induced bone regeneration

Affiliations

TRPM7 kinase-mediated immunomodulation in macrophage plays a central role in magnesium ion-induced bone regeneration

Wei Qiao et al. Nat Commun. .

Abstract

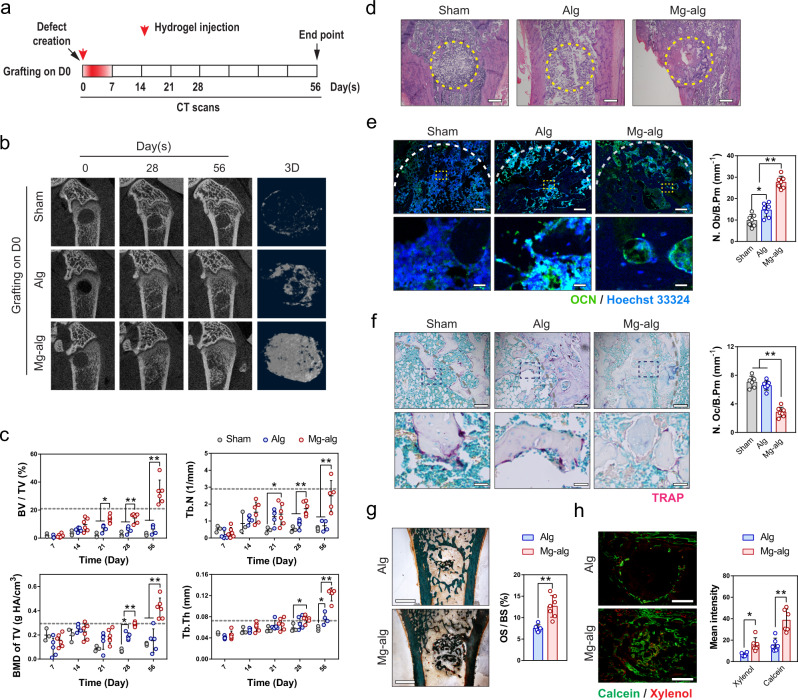
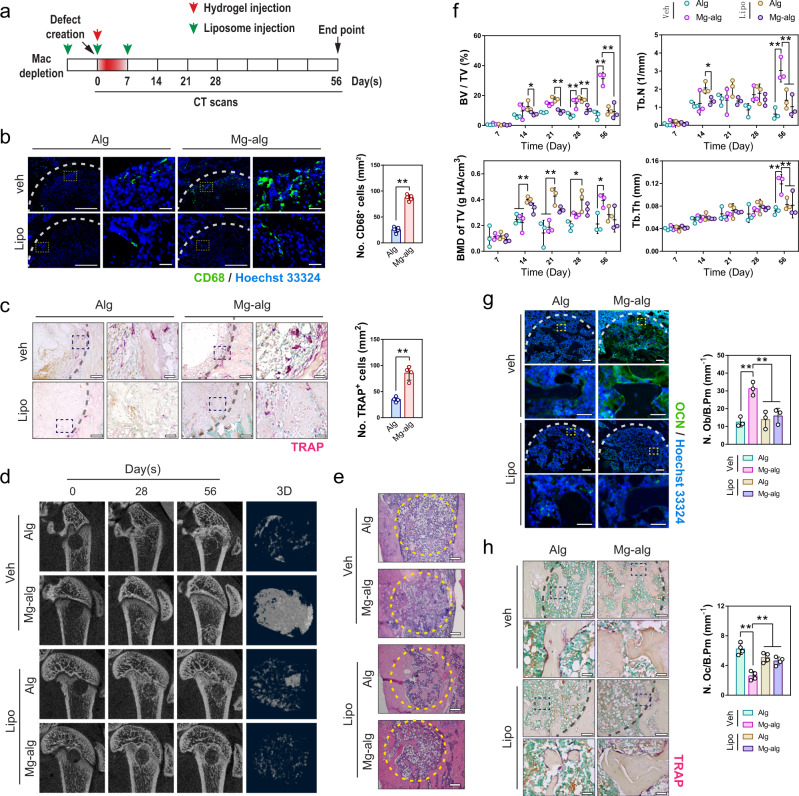
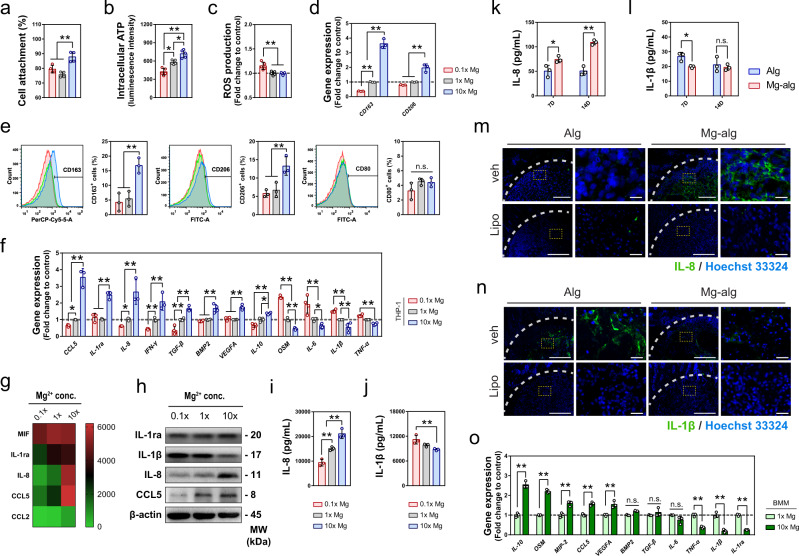
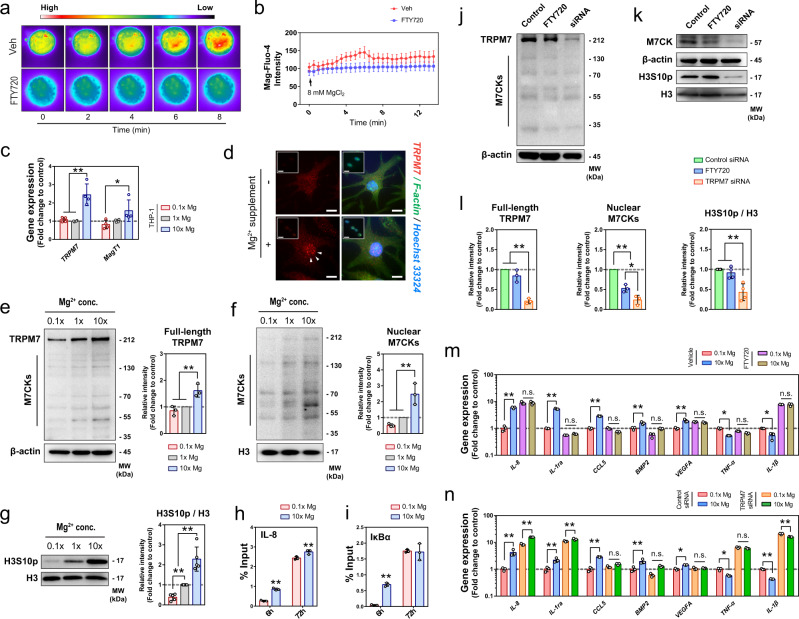
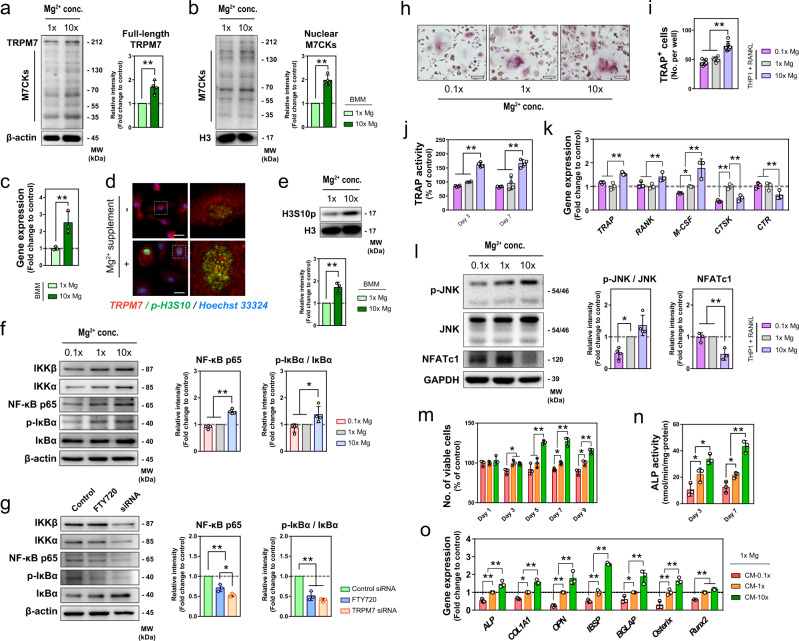
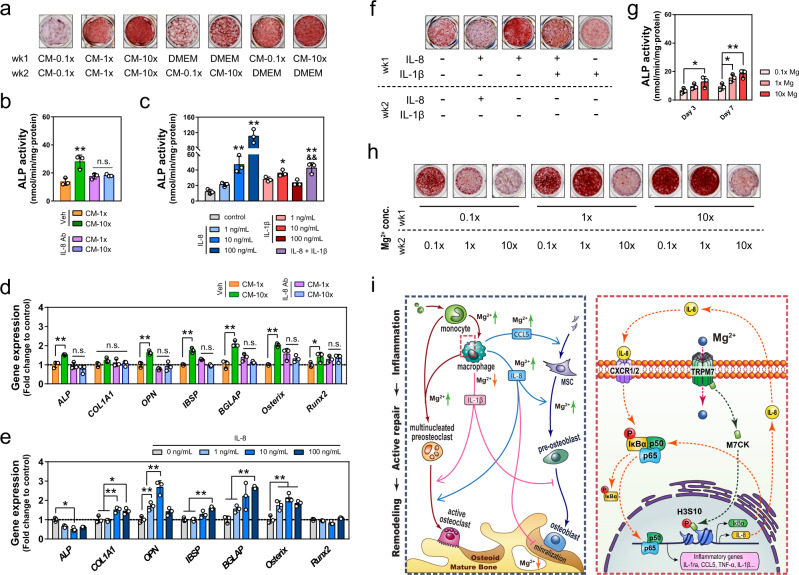
Despite the widespread observations on the osteogenic effects of magnesium ion (Mg2+), the diverse roles of Mg2+ during bone healing have not been systematically dissected. Here, we reveal a previously unknown, biphasic mode of action of Mg2+ in bone repair. During the early inflammation phase, Mg2+ contributes to an upregulated expression of transient receptor potential cation channel member 7 (TRPM7), and a TRPM7-dependent influx of Mg2+ in the monocyte-macrophage lineage, resulting in the cleavage and nuclear accumulation of TRPM7-cleaved kinase fragments (M7CKs). This then triggers the phosphorylation of Histone H3 at serine 10, in a TRPM7-dependent manner at the promoters of inflammatory cytokines, leading to the formation of a pro-osteogenic immune microenvironment. In the later remodeling phase, however, the continued exposure of Mg2+ not only lead to the over-activation of NF-κB signaling in macrophages and increased number of osteoclastic-like cells but also decelerates bone maturation through the suppression of hydroxyapatite precipitation. Thus, the negative effects of Mg2+ on osteogenesis can override the initial pro-osteogenic benefits of Mg2+. Taken together, this study establishes a paradigm shift in the understanding of the diverse and multifaceted roles of Mg2+ in bone healing.


Conflict of interest statement

The authors declare no competing interests.

Figures

Fig. 1
Fig. 1. Mg2+ releasing alginate promoted bone healing of defects in the rat femur.
a Mg2+-crosslinked alginate was injected into the femur defect in rats right after the injury, hence the release of Mg2+ was limited to the first week of the injury. b Representative micro-CT images and reconstructed 3D images of the defects in rat femora without grafting (Sham, n = 3), grafted with pure alginate (Alg, n = 5) or Mg2+ releasing alginate (Mg-Alg, n = 6). c Corresponding measurements of trabecular bone fraction (BV/TV), trabecular number (Tb.N), bone mineral density (BMD of TV), and trabecular thickness (Tb.Th) showing the healing process of rat femoral defects. Sham, n = 3; Alg, n = 5; Mg-alg, n = 6. The dashed line shows the mean value of each bone parameter at the defect area before the operation. d Representative H&E staining images of the grafted defects in the rat femora, scale bars = 500 µm. e Representative immunofluorescent images and quantification showing the presence of osteoblasts (N.Ob/B.Pm, n = 6) in the grafted defects in the rat femora on day 56. Lower images (scale bars = 50 µm) are high-resolution versions of the boxed regions in the upper images (scale bars = 500 µm). f Representative TRAP staining images showing the presence of osteoclasts in the grafted defects in the rat femora, and histomorphological analysis of osteoclast numbers (N.Oc/B.Pm, n = 6) in the defects of femora on day 56. Lower images (scale bars = 40 µm) are high-resolution versions of the boxed regions in the upper images (scale bars = 200 µm). g Representative Goldner’s trichrome staining of the grafted defects on day 56, scale bars = 1 mm, and quantitative analysis of osteoid surface per bone surface (OS/BS, n = 6) in the grafted femoral defects. h Representative images of calcein/xylenol labeling for bone regeneration in the rat femoral defects grafted with alginate or Mg2+ releasing alginate, scale bars = 1 mm, and quantitative analysis of fluorescence intensity of calcein/xylenol (n = 6). Data are mean ± s.d. n.s. P > 0.05, *P < 0.05, **P < 0.01 by two-way ANOVA with Tukey’s post hoc test (c), one-way ANOVA with Tukey’s post hoc test (e, f), or Student’s T-test (g, h).
Fig. 2
Fig. 2. Delayed or prolonged delivery of Mg2+ compromised its effects on bone healing.
a Mg2+-crosslinked alginate was injected into the femur defect on the seventh day after the injury to exclude the effects of Mg2+ on early phrase inflammation. b Representative micro-CT and reconstructed 3D images of the defects in rat femur on day 56 when the grafting was delayed. c Corresponding measurements of BV/TV, Tb.N, BMD of TV, and Tb.Th showing the healing process of rat femoral defects. Alg, n = 4; Mg-alg, n = 3. d Representative H&E staining images of the grafted defects in the rat femora, scale bars = 500 µm. e Representative immunofluorescent images and quantification showing the presence of osteoblast in the grafted defects in the rat femora on day 56, scale bars = 500 µm. f Representative TRAP staining images and quantification showing the presence of osteoclasts in the grafted defects in the rat femora on day 56 (n = 4), scale bars = 200 µm. g Mg-crosslinked alginate was injected into the femur defect in rats at both the first and seventh days after the injury to allow sustained release of Mg2+ in the first two weeks of injury. h Representative micro-CT and reconstructed 3D images of the defects in rat femur on day 56 when the grafting was repeated (n = 4). i Corresponding measurements of BV/TV, Tb.N, BMD of TV and Tb.Th showing the healing process of rat femoral. Alg, n = 4; Mg-alg, n = 3. Data are mean ± s.d. j Representative H&E staining images of the grafted defects in the rat femora on day 56, scale bars = 500 µm. k Representative immunofluorescent images and quantification showing the presence of osteoblast in the grafted defects in the rat femora on day 56 (n = 4), scale bars = 500 µm. l Representative TRAP staining images showing the presence of osteoclasts in the grafted defects in the rat femora on day 56 (n = 4), scale bars = 200 µm. Data are mean ± s.d. n.s. P > 0.05, *P < 0.05, **P < 0.01 by two-way ANOVA with Tukey’s post hoc test (c, i) or Student’s T-test (e, f, k, l).
Fig. 3
Fig. 3. The key role of macrophages in Mg2+-induced new bone formation.
a Mg-crosslinked alginate was injected into the femur defect in rats when their macrophages were selectively depleted by intraperitoneal administrations of liposome-encapsulated clodronate. b Representative immunofluorescent images showing the infiltration of CD68+ macrophages on day 7 in the grafted defects in the rat femora and corresponding quantification for the number of CD68+ macrophages (n = 3), right images (scale bars = 20 µm) are high-resolution versions of the boxed regions in the left images (scale bars = 200 µm). c Representative TRAP staining images showing the presence of TRAP+ cells in the grafted defects in the rat femora on day 7 and corresponding quantification for the number of TRAP+ cells (n = 3), right images (scale bars = 40 µm) are high-resolution versions of the boxed regions in the left images (scale bars = 200 µm). d Representative micro-CT and reconstructed 3D images of the defects in rat femur on day 56 (n = 3). e Representative H&E staining images of the grafted defects in the rat femora, scale bars = 500 µm. f Corresponding measurements of BV/TV, Tb.N, BMD of TV and Tb.Th showing the healing process of rat femoral defects (n = 3). g Representative immunofluorescent images showing the presence of osteoblasts in the grafted defects in the rat femora on day 56 (n = 3), lower images (scale bars = 100 µm) are high-resolution versions of the boxed regions in the upper images (scale bars = 500 µm). h Representative TRAP staining images showing the presence of osteoclasts in the grafted defects in the rat femora on day 56 (n = 3), lower images (scale bars = 40 µm) are high-resolution versions of the boxed regions in the upper images (scale bars = 200 µm). Data are mean ± s.d. n.s. P > 0.05, *P < 0.05, **P < 0.01 by Student’s T-test (b, c), two-way ANOVA with Tukey’s post hoc test (f), or one-way ANOVA with Tukey’s post hoc test (g, h).
Fig. 4
Fig. 4. Mg2+ regulated the inflammatory microenvironment through the immunomodulation of macrophages.
a, b, c The effects of different concentrations of Mg2+ on the cell attachment (a, n = 4), intracellular ATP level (b, n = 5), and ROS production (c, n = 4) of macrophages differentiated from suspension THP1 monocytes. The data for cell attachment was expressed as a percentage of initially seeded THP-1 cells. d The effect of different concentrations of Mg2+ on the gene expression of CD163 and CD206 in THP1-derived macrophages as evaluated by RT-qPCR (n = 3). e The effect of different concentrations of Mg2+ on the polarization of macrophages was evaluated by the expression of CD163, CD206, and CD80 using flow cytometry (n = 3). f The relative expression of inflammatory-related genes regulated by the stimulation of Mg2+ in THP1-derived macrophages (n = 3). g Major cytokines that respond to the stimulation of Mg2+ determined by cytokine arrays were shown in a heat map. h Representative western blots showing the expression of IL-1ra, IL-1β, IL-8, and CCL5 of THP1-derived macrophages cultured in a medium supplemented with different concentrations of Mg2+. i, j ELISA analysis showing the concentration-dependent effect of Mg2+ on the production of IL-8 (i) and IL-1β (j) in THP1-derived macrophages (n = 3). k, l ELISA analysis on IL-8 (k) and IL-1β (l) in the grafted defects in the rat femora on day 7 after the operation (n = 3). m, n Representative immunofluorescent images showing the expression of IL-8 (m) and IL-1β (n) on day 7 in the grafted defects in the rat femora, (n = 3), right images (scale bars = 20 µm) are high-resolution versions of the boxed regions in the left images (scale bars = 200 µm). o The inflammatory-related genes regulated by the stimulation of Mg2+ in mouse primary bone marrow macrophages (BMM, n = 3). Data are mean ± s.d. n.s. P > 0.05, *P < 0.05, **P < 0.01 by one-way ANOVA with Tukey’s post hoc test (ae, i, j) or two-way ANOVA with Tukey’s post hoc test (f, k, l, o).
Fig. 5
Fig. 5. The involvement of TRPM7 in Mg2+-induced immunomodulation in macrophages.
a, b Representative fluorescence images (a) showing the influx of Mg2+ into THP1-derived macrophages after the addition of 8 mM MgCl2. Color scale bar from low (black to blue) to high (red to white) indicates the level of Mg2+. b Time-course changes in intracellular Mg2+ quantified by measuring the intensity of fluorescence (n = 5). c The gene expression of TRPM7 and MagT1 in THP1-derived macrophages upon the stimulation of different concentrations of Mg2+ determined by RT-qPCR (n = 4). d Representative fluorescence images showing the nuclear accumulation of TRPM7 in THP1-derived macrophages after the stimulation of Mg2+. Inserts showed the staining with the cell permeabilization before the fixation to better demonstrate the nucleus bound TRPM7. Scale bars = 5 µm. e Representative western blots and the corresponding quantification showing the effects of Mg2+ on the expression of TRPM7 and its cleaved kinase fragments (M7CKs) in THP-1 derived macrophages (n = 3). f, g Western blots of nuclear proteins probed with anti-TRPM7 and the corresponding quantification showing the stimulation of Mg2+ contributed to an increased nuclear fraction of M7CK (n = 3) (f) and upregulated phosphorylation of Histone H3S10 (n = 5) (g). h, i CHIP assay showing the detection of promoters of IκBα (h) and IL-8 (i) in the immunoprecipitates of H3S10p was upregulated by the stimulation of Mg2+. (jl) Representative western blots showing the effects of FTY720 and TRPM7 siRNA on the expression of TRPM7 (j, n = 3), its nuclear M7CKs (k, n = 3), and the phosphorylation of Histone H3S10 (k, n = 4) in THP1-derived macrophages, as well as corresponding quantifications (l). m, n The effects of FTY720 (m) and TRPM7 siRNA (n) on the inflammatory gene expression in THP1-derived macrophages (n = 3). Data are mean ± s.d. n.s. P > 0.05, *P < 0.05, **P < 0.01 by two-way ANOVA with Tukey’s post hoc test. (c, h, m, n) or one-way ANOVA with Tukey’s post hoc test (eg, l).
Fig. 6
Fig. 6. The effects of Mg2+ on macrophages and resulting impacts on osteoclastogenesis and osteogenesis.
a, b Representative western blots and the corresponding quantification showing the effects of Mg2+ on the expression of TRPM7 (a, n = 4) and its nuclear M7CKs (b, n = 4) in mouse BMM. c The gene expression of TRPM7 in mouse BMM upon the stimulation of 10× Mg2+ determined by RT-qPCR (n = 3). d Representative fluorescence images showing the nuclear accumulation of TRPM7 and phosphorylation of Histone H3S10 in mouse BMM after the stimulation of Mg2+. Scale bars = 5 µm. right images are high-resolution versions of the boxed regions in the left images (scale bars = 20 µm). e Representative western blots and corresponding quantification showing Mg2+ upregulated the phosphorylation of Histone H3S10 in mouse BMM (n = 3). f, g Representative western blots and the corresponding quantification showing the concentration-dependent effect of Mg2+ (g) and the influence of FTY720 or TRPM7 siRNA on the activation of NF-κB signaling in THP1-derived macrophages (n = 4). h, i Representative microscopy images (h) and quantitative data (i) showing the effect of Mg2+ on the formation of multi-nuclear TRAP+ cells from THP1-derived macrophages stimulated by RANKL and M-CSF (n = 6). j, k The effect of Mg2+ on the extracellular TRAP activity (j, n = 4) and osteoclastic-related gene expression (k, n = 3) in THP1-derived macrophages stimulated by RANKL and M-CSF. l Representative western blots and the corresponding quantification showing the effects of Mg2+ on the phosphorylation of JNK (n = 4) and the expression of NFATc1 (n = 3). m, n, o The number of viable cells (m, n = 3), ALP activity (n, n = 3), and osteogenic related gene expression (o, n = 3) of MSC cultured in conditional medium from macrophages stimulated with different concentrations of Mg2+. Data are mean ± s.d. n.s. P > 0.05, *P < 0.05, **P < 0.01 by Student’s T-test (ac, e), one-way ANOVA with Tukey’s post hoc test (f, g, i, l), or two-way ANOVA with Tukey’s post hoc test (j, k, m, n, o).
Fig. 7
Fig. 7. The effects of Mg2+ and its modulated inflammatory microenvironment on osteogenesis.
a Alizarin Red staining of mineralized nodules of MSC treated with conditional medium from Mg2+-treated macrophages at either early or late stage of osteogenic induction. b The ALP activity of MSC cultured in conditional medium from macrophages with or without the addition of IL-8 neutralizing antibody (n = 3). c The ALP activity of MSC cultured in medium supplemented with recombinant human IL-8 or IL-1β (n = 3). d The osteogenic-related gene expression of MSC cultured in conditional medium from macrophages with or without the addition of IL-8 neutralizing antibody (n = 3). e The osteogenic-related gene expression of MSC cultured in medium supplemented with different concentrations of recombinant human IL-8 (n = 3). f Alizarin Red staining of mineralized nodules of MSC treated with recombinant human IL-8 or IL-1β. g The ALP activity of MSC cultured in DMEM supplemented with different concentrations of Mg2+ (n = 3). h Alizarin Red staining showing the mineralization of MSC treated with different concentrations of Mg2+ at either early or late stage of osteogenic induction. i The schematic shows the mechanism in which Mg2+ modulates both macrophages and mesenchymal stem cells in the bone healing process. Data are mean ± s.d. n.s. P > 0.05, *P < 0.05, **P < 0.01 by one-way ANOVA with Tukey’s post hoc test (b, c) or two-way ANOVA with Tukey’s post hoc test (d, e, g).

Similar articles

Cited by

References

    1. Gong T, et al. Nanomaterials and bone regeneration. Bone Res. 2015;3:15029. doi: 10.1038/boneres.2015.29. - DOI - PMC - PubMed
    1. Rude RK, Gruber HE, Wei LY, Frausto A, Mills BG. Magnesium deficiency: effect on bone and mineral metabolism in the mouse. Calcif. Tissue Int. 2003;72:32–41. doi: 10.1007/s00223-001-1091-1. - DOI - PubMed
    1. Salimi MH, Heughebaert JC, Nancollas GH. Crystal-growth of calcium phosphates in the presence of magnesium-ions. Langmuir. 1985;1:119–122. doi: 10.1021/la00061a019. - DOI
    1. Kenney MA, McCoy H, Williams L. Effects of magnesium deficiency on strength, mass, and composition of rat femur. Calcif. Tissue Int. 1994;54:44–49. doi: 10.1007/BF00316289. - DOI - PubMed
    1. Boskey AL, et al. Effect of short-term hypomagnesemia on the chemical and mechanical properties of rat bone. J. Orthop. Res. 1992;10:774–783. doi: 10.1002/jor.1100100605. - DOI - PubMed

Publication types

MeSH terms

LinkOut - more resources