. 2021 May 17;12(1):2881.
doi: 10.1038/s41467-021-23156-2.

Net decrease in spine-surface GluA1-containing AMPA receptors after post-learning sleep in the adult mouse cortex

Affiliations

Net decrease in spine-surface GluA1-containing AMPA receptors after post-learning sleep in the adult mouse cortex

Daisuke Miyamoto et al. Nat Commun. .

Abstract

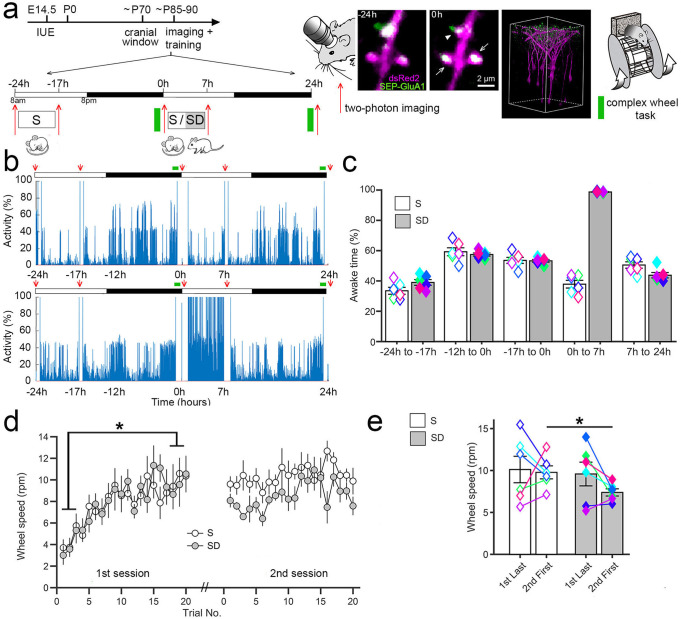
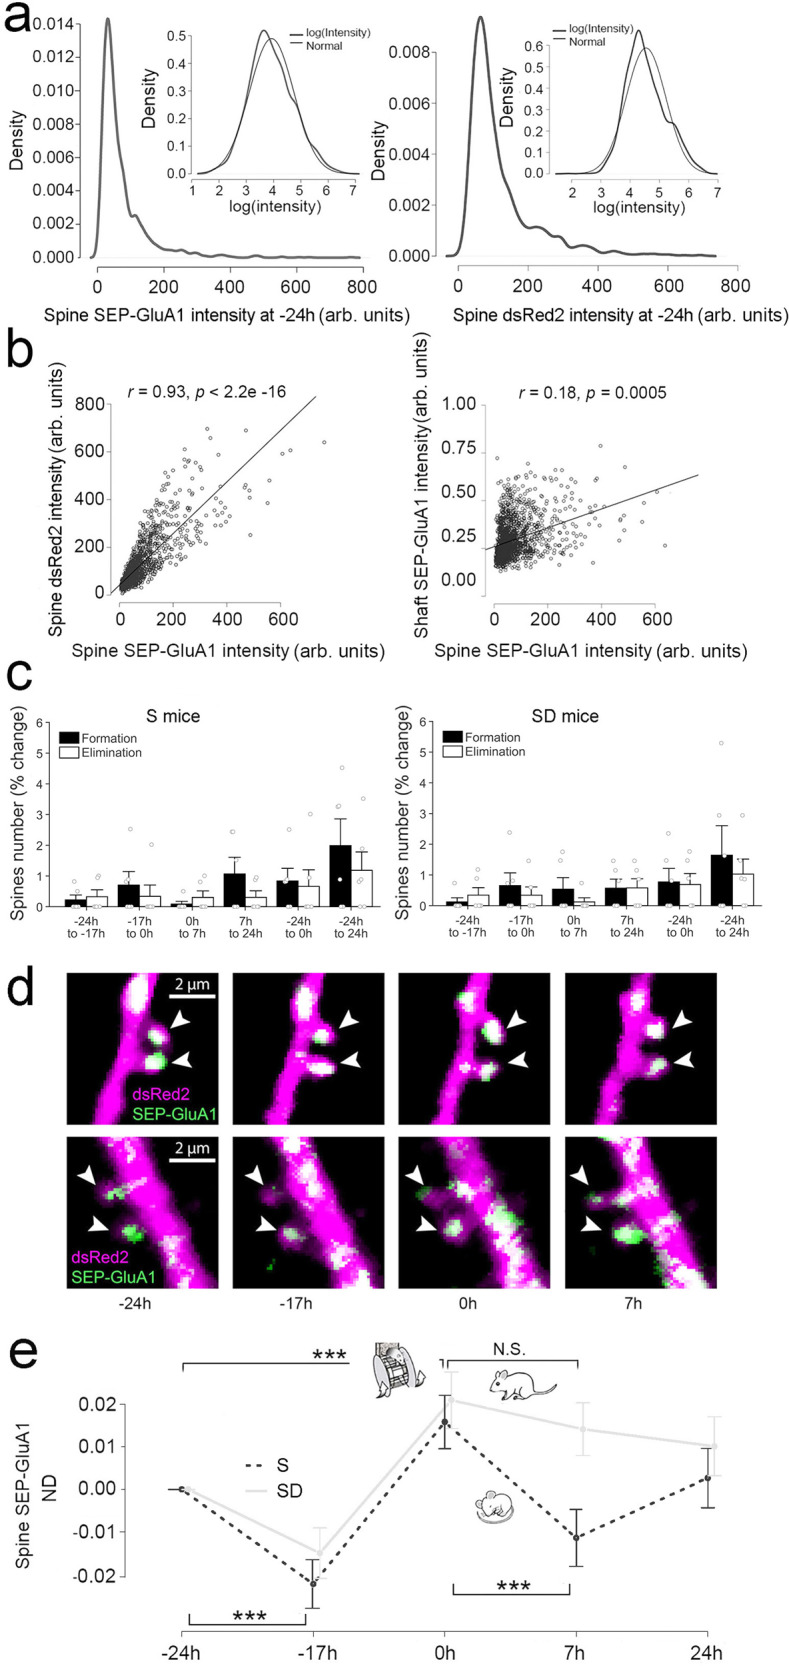
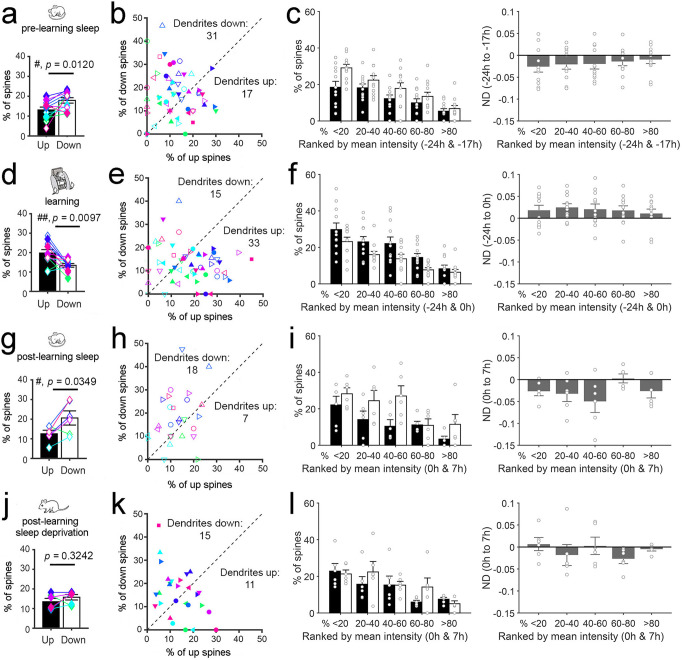
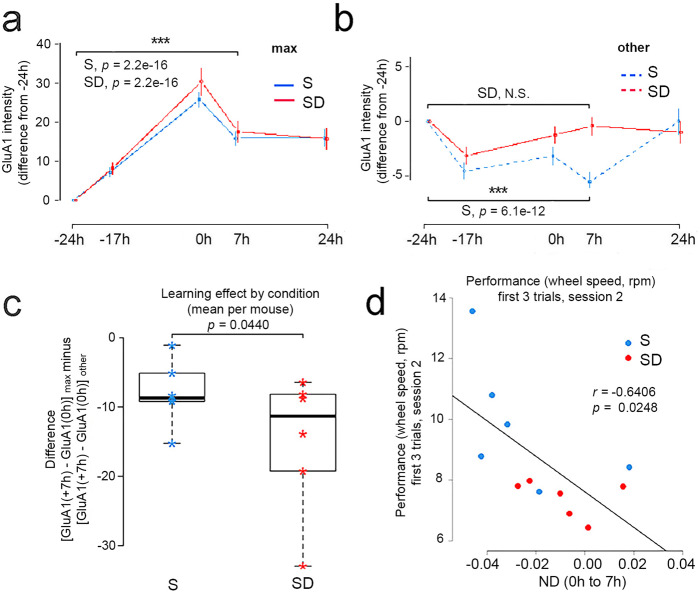
The mechanisms by which sleep benefits learning and memory remain unclear. Sleep may further strengthen the synapses potentiated by learning or promote broad synaptic weakening while protecting the newly potentiated synapses. We tested these ideas by combining a motor task whose consolidation is sleep-dependent, a marker of synaptic AMPA receptor plasticity, and repeated two-photon imaging to track hundreds of spines in vivo with single spine resolution. In mouse motor cortex, sleep leads to an overall net decrease in spine-surface GluA1-containing AMPA receptors, both before and after learning. Molecular changes in single spines during post-learning sleep are correlated with changes in performance after sleep. The spines in which learning leads to the largest increase in GluA1 expression have a relative advantage after post-learning sleep compared to sleep deprivation, because sleep weakens all remaining spines. These results are obtained in adult mice, showing that sleep-dependent synaptic down-selection also benefits the mature brain.


Conflict of interest statement

The authors declare no competing interests.

Figures

Fig. 1
Fig. 1. Sleep/waking behavior and motor learning.
a Left, experimental design. White and black bars indicate the light and dark periods, respectively. IUE, in utero electroporation. E and P indicate embryonic and postnatal age, respectively, in days. S, sleep; SD, sleep deprivation. Right, representative examples of time-lapse in vivo two-photon images of layer 2/3 pyramidal cell apical dendrites, representative 3D reconstruction showing sparse labeling in layer 2/3 (X, Y = 200 μm, Z = 300 μm; 12 mice in total), and schematic of the complex wheel used for motor training. SEP-GluA1 (green), dsRed2 (red), overlap (white). b Representative examples of rest/activity patterns in one S and one SD mouse during the 2 consecutive days when repeated two-photon imaging and motor training occurred (red arrows). c Time spent awake (% of total time; mean ± SEM; 6 S, 6 SD mice) during the indicated time intervals (−24 h to −17 h = 36.3 ± 1.7; −12 h to −0 h = 61.7 ± 1.3; −17 h to −0 h = 56.8 ± 1.0; 0 h to 7 h, S mice = 37.9 ± 2.8; SD mice = 98.7 ± 0.2; 7 h to 24 h, S mice = 50.5 ± 2.3; SD mice = 43.8 ± 2.0). Colored symbols indicate individual animals. d Performance in the complex wheel task for each trial, averaged (± SEM) across the 6 mice of each group. Performance in the first session (first 3 trials vs. last 3 trials): *, two-sided paired t test, p = 0.0004 (n = 12 mice). e Offline consolidation measured by comparing the first 3 trials of session 2 between S and SD mice (mean ± SEM); *, two-sided Student’s t test, p = 0.0236. Colored symbols indicate individual animals. Source data are provided as a Source data file.
Fig. 2
Fig. 2. Mean changes in spine number and spine-surface expression of GluA1 after sleep/waking and motor training.
a Log-normal distributions of the intensities of spine SEP-GluA1 (left) and spine dsRed2 (right) before sleep (−24 h; 12 mice; 1530 spines; 104–192 spines/mouse). Insets, same on a log scale. SEP-GluA1 and dsRed2 intensities were calculated as detailed in Supplementary Fig. 2. b Correlations between the intensities of spine SEP-GluA1 and spine dsRed2 (r = 0.93, p < 2.2e−16) or shaft SEP-GluA1 (r = 0.18, p = 0.0005) before sleep (−24 h). arb. units = arbitrary units. Mean correlation per mouse, significance tested using two-sided one-sample t test. c Spines newly formed and eliminated during the indicated time intervals (mean ± SEM). White circles indicate individual mice (6 S mice, 6 SD mice). S, sleep; SD, sleep deprivation. d Two representative examples (from 12 mice in total) of repeated in vivo two-photon imaging of layer 2/3 pyramidal cell apical dendrites and their spines (arrowheads). SEP-GluA1 (green), dsRed2 (red), overlap (white). e Normalized difference (ND, mean ± SEM) of spine SEP-GluA1 expression relative to −24 h (12 mice; 1530 spines). We show ND instead of the SEP-GluA1 expression because these are the relevant error bars for statistical testing. Two-sided likelihood ratio test followed by two-sided post-hoc comparisons: pre-learning sleep ***p = 0.00003 (n = 12); motor learning ***p = 0.00004 (n = 12); post-learning sleep ***p < 2.2e−6 (n = 6); post-learning sleep deprivation, p = 0.202 (n = 6). Source data are provided as a Source data file.
Fig. 3
Fig. 3. Single spine analysis of changes in SEP-GluA1 expression after sleep/wake and motor training.
a, b Percentage of up (ND > 0.15) and down (ND < −0.15) spines (a) and up and down dendrites (b) after pre-learning sleep. In a colored symbols indicate individual animals (n = 12 mice; mean ± SEM). c Left, percentage of up spines (black bars) and down spines (white bars) in each quintile; right, ND (normalized difference; mean ± SEM) in spine SEP-GluA1 expression in each quintile. Spines were subdivided in quintiles and ranked in strength based on the mean SEP-GluA1 expression of the two time points indicated on the x axis. White circles indicate individual animals (n = 12 mice). df Same as (ac) for motor learning (n = 12 mice). gi Same as (ac) for post-learning sleep (n = 6 mice). jl Same as (ac) for post-learning sleep deprivation (n = 6 mice). In a, d, g, j the p values are computed using a two-sided paired sample t test. In b, e, h, k the percentage of up/same/down spines in each dendritic branch is as follows (mean ± std, in %): pre-learning sleep (−24 h to −17 h, all mice): up 12.3 ± 8.16, same 70.3 ± 12.2, down 17.4 ± 9.9; learning (−24 h to 0 h, all mice): up 17.9 ± 10.9, same 68.7 ± 11.9, down 13.4 ± 7.62; post-learning sleep (0 h to 7 h, 6 mice): up 12.4 ± 6.7, same 68.7 ± 15.4, down 18.9 ± 12.3; post-learning SD (0 h to 7 h, 6 mice): up 13.8 ± 7.31, same 70.5 ± 9.7, down 15.7 ± 10.4. Source data are provided as a Source data file.
Fig. 4
Fig. 4. Post-training changes in max and other spines.
a SEP-GluA1 intensity in max spines (difference from −24 h) across all time points (mean ± SEM). The max spines are defined as those that showed the largest increase from −24 h to 0 h (max spines as % of all spines = 13.5 ± 4.1%, 207/1530; mean ± sd; range per mouse = 6.3–20%; see also Supplementary Fig. 6). These spines maintain high SEP-GluA1 levels at later times (7 h vs −24 h; p = 2.2e−16 in both groups). S, sleep (n = 6 mice); SD, sleep deprivation (n = 6 mice). b SEP-GluA1 intensity in the other spines (difference from −24 h) across all time points (mean ± SEM). Note the different scale of the Y axes in (a, b). During the 7 h after the first training session, the other spines of S mice show a decrease at 7 h vs −24 h (p = 6.1e−12), while the other spines of SD mice do not (7 h vs −24 h, N.S.). In a, b statistical analysis was performed using linear mixed effect models, with session as a categorical fixed effect, and spine, dendrite and mouse as random effects. A likelihood ratio test was used to check for an effect of session. S, sleep (6 mice); SD, sleep deprivation (6 mice). c The difference between the change in SEP-GluA1 from 0 h to 7 h in the max spines and the change in SEP-GluA1 from 0 h to 7 h in all other spines. There is a significant effect of group (S or SD; likelihood ratio test, p = 0.0440), indicating an advantage for the max spines and a penalization of all other spines in the S group (6 mice) relative to the SD group (6 mice). Center line indicates the median, the box boundaries indicate the first and third quartiles and the whiskers indicate the minimum and maximum values. d Negative correlation between performance at the onset of session 2 (first 3 trials) and ND (normalized difference; mean ± SEM) in spine SEP-GluA1 expression in each mouse between 7 h (after S or SD) and 0 h (after training). All spines (r = −0.6406; two-sided Fisher’s z transformation, p = 0.0248). Negative ND values (net decrease in SEP-GluA1 expression) are associated with better performance. S, sleep (6 mice); SD, sleep deprivation (6 mice). Rpm, revolutions per minute. Source data are provided as a Source data file.

Similar articles

Cited by

References

    1. Goel N, Rao H, Durmer JS, Dinges DF. Neurocognitive consequences of sleep deprivation. Semin. Neurol. 2009;29:320–339. doi: 10.1055/s-0029-1237117. - DOI - PMC - PubMed
    1. Krause AJ, et al. The sleep-deprived human brain. Nat. Rev. Neurosci. 2017;18:404–418. doi: 10.1038/nrn.2017.55. - DOI - PMC - PubMed
    1. Della Monica C, Johnsen S, Atzori G, Groeger JA, Dijk DJ. Rapid eye movement sleep, sleep continuity and slow wave sleep as predictors of cognition, mood, and subjective sleep quality in healthy men and women, aged 20-84 years. Front. Psychiatry. 2018;9:255. doi: 10.3389/fpsyt.2018.00255. - DOI - PMC - PubMed
    1. Lowe CJ, Safati A, Hall PA. The neurocognitive consequences of sleep restriction: a meta-analytic review. Neurosci. Biobehav. Rev. 2017;80:586–604. doi: 10.1016/j.neubiorev.2017.07.010. - DOI - PubMed
    1. Rasch B, Born J. About sleep’s role in memory. Physiol. Rev. 2013;93:681–766. doi: 10.1152/physrev.00032.2012. - DOI - PMC - PubMed

Publication types

Substances

LinkOut - more resources