. 2021 May 17;12(1):2866.
doi: 10.1038/s41467-021-23189-7.

IL-21 and IFNα therapy rescues terminally differentiated NK cells and limits SIV reservoir in ART-treated macaques

Affiliations

IL-21 and IFNα therapy rescues terminally differentiated NK cells and limits SIV reservoir in ART-treated macaques

Justin Harper et al. Nat Commun. .

Abstract

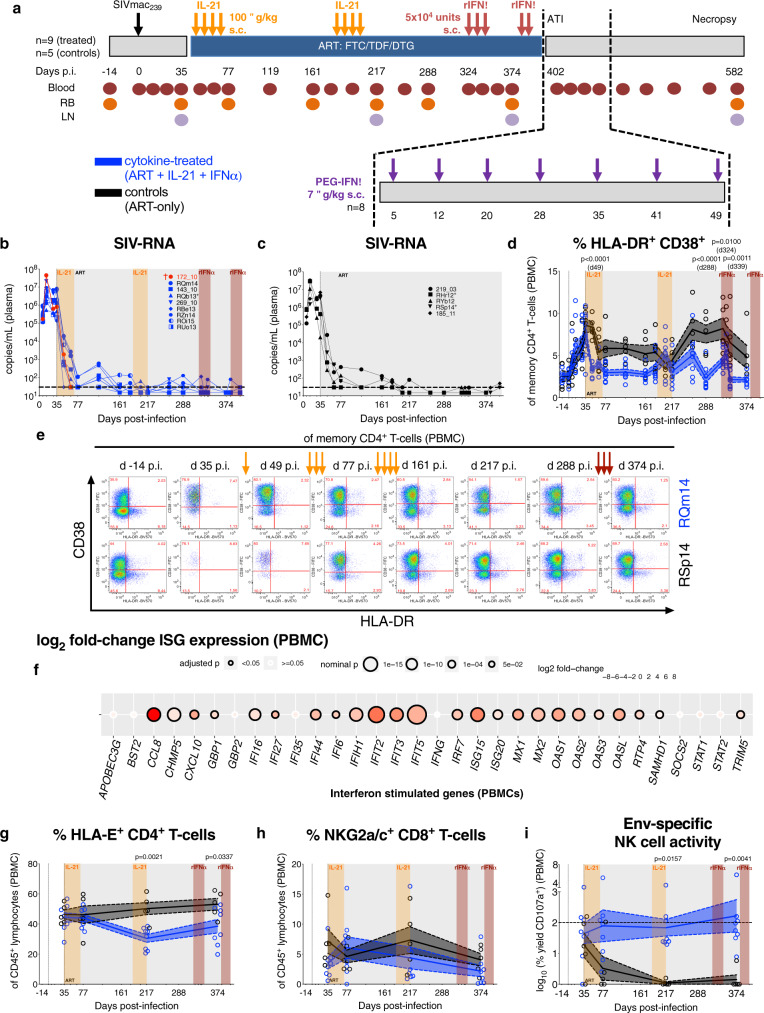
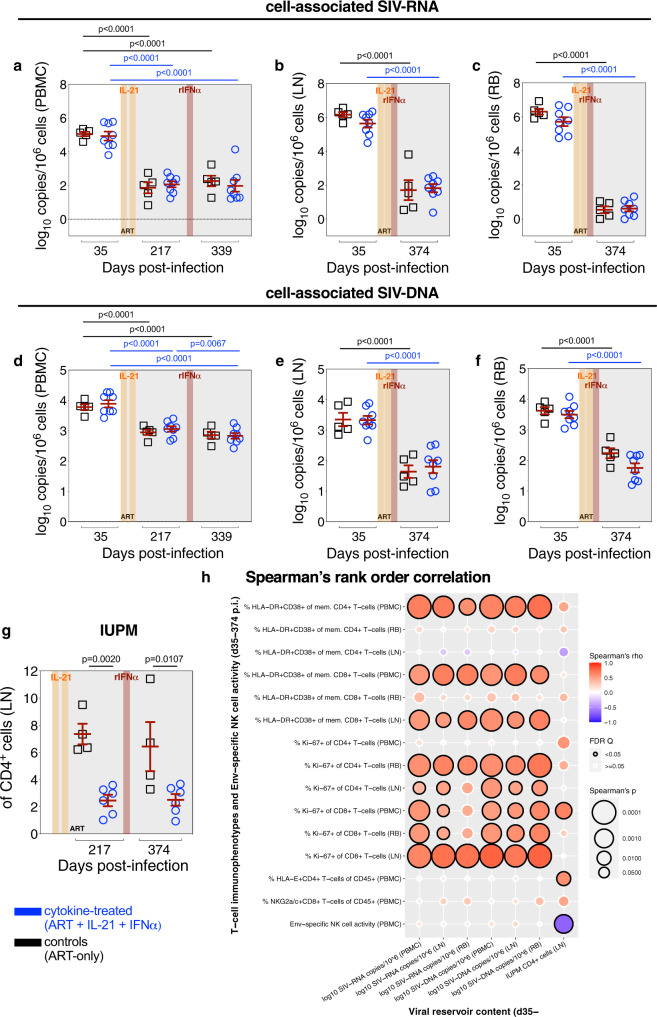
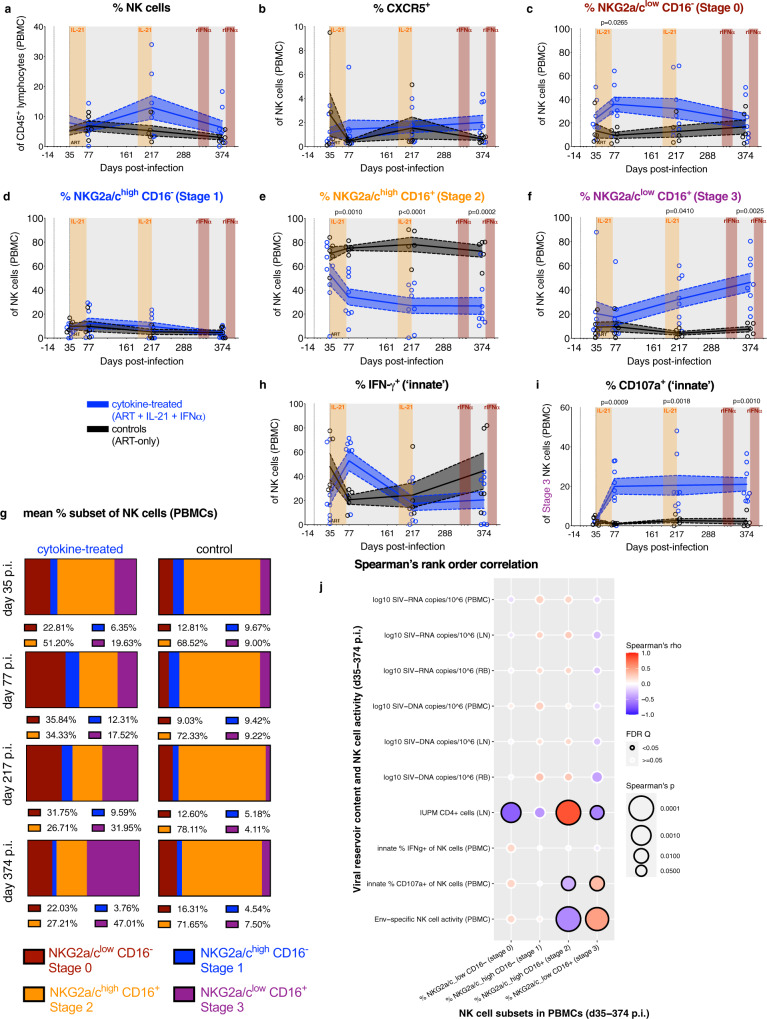
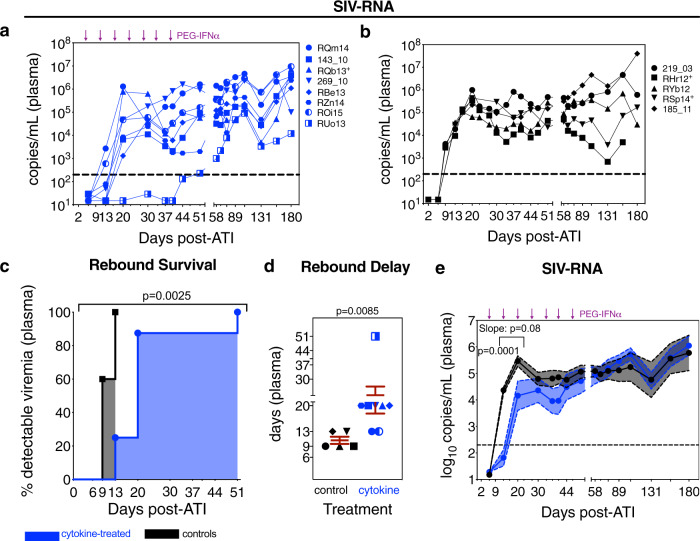
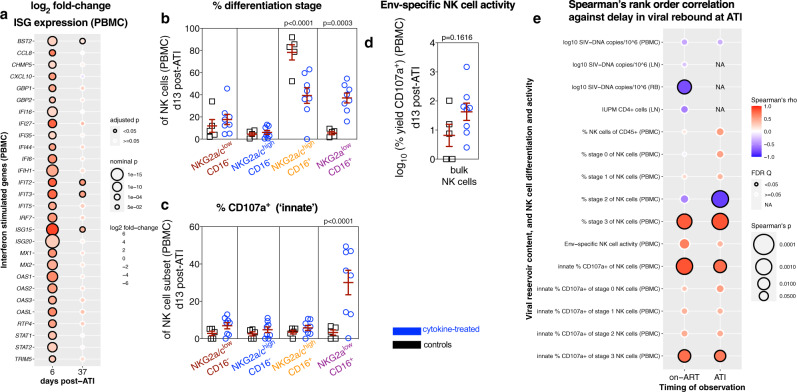
Unlike HIV infection, which progresses to AIDS absent suppressive anti-retroviral therapy, nonpathogenic infections in natural hosts, such African green monkeys, are characterized by a lack of gut microbial translocation and robust secondary lymphoid natural killer cell responses resulting in an absence of chronic inflammation and limited SIV dissemination in lymph node B-cell follicles. Here we report, using the pathogenic model of antiretroviral therapy-treated, SIV-infected rhesus macaques that sequential interleukin-21 and interferon alpha therapy generate terminally differentiated blood natural killer cells (NKG2a/clowCD16+) with potent human leukocyte antigen-E-restricted activity in response to SIV envelope peptides. This is in contrast to control macaques, where less differentiated, interferon gamma-producing natural killer cells predominate. The frequency and activity of terminally differentiated NKG2a/clowCD16+ natural killer cells correlates with a reduction of replication-competent SIV in lymph node during antiretroviral therapy and time to viral rebound following analytical treatment interruption. These data demonstrate that African green monkey-like natural killer cell differentiation profiles can be rescued in rhesus macaques to promote viral clearance in tissues.


Conflict of interest statement

The authors declare no competing interests.

Figures

Fig. 1
Fig. 1. IL-21 and rIFNα immunotherapies are biologically active in SIV-infected, ART-treated RMs.
a Cartoon schematic of study design as detailed in the Results and Methods. Plasma viral loads (SIV-RNA copies/mL) were longitudinally measured by qRT-PCR with individual b cytokine-treated (ART + IL-21 + IFNα; blue; n = 9 RMs) and c control (ART-only; black; n = 5 RMs) RMs represented by distinct shapes. The dashed horizontal line represents the assay’s limit of detection (30 copies/mL) with undetectable events plotted as 15 copies/mL. d The frequency of immune activation (HLA-DR+CD38+) was quantified in memory (CD95+) CD4+ T-cells in PBMCs and e representative flow cytometry plots are given at critical time points (as indicated above) for a cytokine-treated (RQm14) and control RMs (RSp14; 16 of 260 single-replicate stains). f The expression of IFN-stimulated genes (ISGs) was measured by RNA-seq in PBMCs at 2 h post-rIFNα and was calculated as a log2 fold-change between rIFNα-treated (n = 6) and control RMs (n = 5), which is represented as a double-gradient heatmap. The size of each data point corresponds inversely to the log10-transformed nominal p value with significant (p < 0.05) adjusted p values indicated by a black border. Using DESeq2, data were analyzed with a two-sided (95% CI) Wald test using the Benjamini–Hochberg method for multiple comparisons. By flow cytometry, the frequency of g HLA-E+ CD4+ T-cells and h NKG2a/c+ CD8+ T-cells was quantified of CD45+ lymphocytes in PBMCs. i NK cells isolated from PBMCs were cultured alone or the presence of K562-HLA-E*0101 cells either unloaded or loaded with SIVmac239/251 Env peptides. The SIV-Env-specific, HLA-E-restricted activity was calculated as the log10-transformed percent yield of CD107a surface expression on NK cells by flow cytometry and the horizontal dashed line represents 100% activity. bd, gi Treatment phases are indicated with the following background shading: IL-21 (orange), rIFNα (red), and ART (gray). d, gi Data from individual RMs (staggered open circles) are overlaid against the mean (solid line) ± SEM (shaded region within the dashed lines): control (black; n = 5) and cytokine-treated (blue; n = 8). Data were analyzed with a d, gi two-sided (95% CI), two-way ANOVA with Bonferroni’s correction for multiple comparisons with cross-sectional comparisons relative to controls.
Fig. 2
Fig. 2. Cytokine therapy reduces replication competent virus in lymphoid tissue, which is uniquely correlated with Env-specific NK cell activity.
The content of cell-associated SIV-RNA (log10 copies per 106 cells) was determined by qRT-PCR in snap frozen pellets of a PBMCs, b LN, and c RB prior to ART initiation (d35 p.i.), following two IL-21 cycles (d217 p.i.), and after one subsequent rIFNα cycle amid ongoing ART (d339 p.i. or d374 p.i.), as was cell-associated SIV-DNA (log10 copies per 106 cells) in d PBMCs, e LN, and f RB. af Data from individual RMs are overlaid against the mean ± SEM (in red): control (ART-only, black square; n = 5 RMs) and cytokine-treated (ART + IL-21 + IFNα, blue circle; n = 8 RMs). g From cryo-preserved, magnetically isolated LN CD4+ cells, the number of infectious units per million (IUPM) cells were measured with a limiting dilution quantitative viral outgrowth assay (QVOA; 3 serial dilutions plated in triplicate) in control (n = 4) and cytokine-treated RMs (n = 6). ag Treatment phases are indicated with the following background shading: IL-21 (orange), rIFNα (red), and ART (gray). Data were analyzed with two-sided (95%), two-way ANOVA with Bonferroni’s correction with comparisons relative to controls and time. h The SIV reservoir contents in tissue (as indicated below) were correlated against phenotypes of activation (HLA-DR+CD38+) and proliferation (Ki-67+) in CD4+ and CD8+ T-cells; the frequency of HLA-E+ CD4+ T-cells and NKG2a/c+ CD8+ T-cells; and the Env-specific NK cell activity (as indicated at left) in all RMs (n = 13; days 35, 217, and 339/374 p.i. as matched data are available). Per each correlation the two-tailed (95% CI) Spearman’s rank correlation coefficient (rho) is represented as a double-gradient heatmap and the size of each data point corresponds inversely to the log10-transformed Spearman’s p value. The false discovery rates (FDR) were calculated using SAS and significant values (Q < 0.05) are represented by a black border.
Fig. 3
Fig. 3. Cytokine therapy promotes the maturation of NKG2a/clowCD16+ NK cells with enhanced ex vivo innate activity, which correlates with the content of lymphoid replication competent virus.
a The frequency of NK cells (CD45+CD20CD3NKG2a/c+) of PBMC CD45+ lymphocytes was longitudinally measured by flow cytometry, b as was their CXCR5 expression. The frequency of each differentiation stage of NK cells was determined based on the following definition: c Stage 0 (red, NKG2a/clowCD16), d Stage 1 (blue, NKG2a/chighCD16), e Stage 2 (orange, NKG2a/chighCD16+), and f Stage 3 (purple, NKG2a/clowCD16+). g The mean frequency of each NK cell differentiation stage from above was also re-visualized as a color-coded (as annotated below), parts-of-whole stacked bar plot for the cytokine-treated (n = 8; at left) and control RMs (n = 5; at right) over time (indicated at left). Flow cytometry was used to quantify the ex vivo innate frequency of h IFN-γ+ (intracellular) NK cells and i CD107a+ (surface) stage 3 (NKG2a/clowCD16+) NK cells. ai Data from individual RMs (staggered open circles) are overlaid against the mean (solid line) ± SEM (shaded region within the dashed lines): control (ART-only, black; n = 5) and cytokine-treated (ART + IL-21 + IFNα, blue; n = 8). Treatment phases are indicated with the following background shading: IL-21 (orange), rIFNα (red), and ART (gray). Data were analyzed with two-sided (95% CI), two-way ANOVA with Bonferroni’s correction with cross-sectional comparisons relative to controls. j The frequencies of each differentiation stage of NK cells in PBMCs (as indicated below) were correlated against levels of cell-associated and replication competent SIV content in tissue, and the ex vivo innate and Env-specific NK cell activities in PBMCs (as indicated at left) in all RMs (n = 13; days 35, 77, 217, and 374 p.i. as matched data are available). Per each correlation the two-tailed (95% CI) Spearman’s rank correlation coefficient (rho) is represented as a double-gradient heatmap and the size of each data point corresponds inversely to the log10-transformed Spearman’s p value. The false discovery rates (FDR) were calculated using SAS and significant values (Q < 0.05) are represented by a black border.
Fig. 4
Fig. 4. Cytokine therapy delays the rebound of plasma viremia following ATI.
Following ART analytical treatment interruption (ATI), the plasma SIV-RNA copies/mL were measured by qRT-PCR in each a cytokine-treated (PEG-IFNα with prior ART + IL-21 + rIFNα, blue; n = 8 RMs) and b control RMs (prior ART-only, black; n = 5 RMs). The horizontal dashed line (200 copies/mL) represents the threshold for virologic rebound and PEG-IFNα treatments are indicated by the purple arrows above. These kinetics of plasma viremia following ATI were then re-visualized as follows: c The delay in rebound of plasma viremia was represented as a treatment-stratified survival curve, which was analyzed with a Log-rank Mantel–Cox test. d The delay in viral rebound, in days, per each RM was represented as a color and shape-coded symbol overlaid against the mean ± SEM (red), which was analyzed with a two-sided (95% CI) Mann–Whitney U test. e The log10 SIV-RNA copies/mL are given as a longitudinal mean (solid line with closed circles) ± SEM (color-coded shaded region within the dashed lines), which was analyzed with a two-sided (95% CI), two-way ANOVA with Bonferroni’s correction for multiple comparisons across treatments (d13 p = 0.0001), and a mixed-effects linear model was used to analyze the slope between d13 and d20 post ATI (as indicated by the bracket; p = 0.08).
Fig. 5
Fig. 5. The formation and activity of NKG2alowCD16+ NK cells correlate with viral recrudescence following ATI.
a From PBMCs taken 24 h following the first (d6 post ATI) and the fifth PEG-IFNα dose (d37 post ATI), the expression of interferon-stimulated genes was calculated as a cross-sectional log2 fold-change between cytokine-treated (n = 8) and control (n = 5) RMs, which is represented as a double-gradient heatmap. The size of each data point corresponds inversely to the log10-transformed nominal p value with significant (p < 0.05) adjusted p values indicated by a black border. Using DESeq2, data were analyzed with a two-sided (95% CI) Wald test using the Benjamini–Hochberg method for multiple comparisons. b In PBMCs at d13 post ATI, the distribution of the differentiation subsets was measured by flow cytometry as a frequency of NK cells: Stage 0 (red, NKG2a/clowCD16), Stage 1 (blue, NKG2a/chighCD16), Stage 2 (orange, NKG2a/chighCD16+), and Stage 3 (purple, NKG2a/clowCD16+). NK cells isolated from PBMCs at d13 post ATI were utilized to determine c the frequency of ex vivo innate activity (CD107a surface expression) or d the Env-specific activity upon co-culture with K562 cells expressing HLA-E loaded with SIVmac Env peptides. bd Data from individual cytokine-treated (PEG-IFNα with prior ART + IL-21 + rIFNα, blue; n = 8) and control (prior ART-only, black; n = 5) RMs (open symbols) are overlaid against the mean ± SEM (in red) and were analyzed with b, c two-sided (95% CI), two-way ANOVA with Bonferroni’s correction for cross-sectional comparisons relative to controls or d with a two-sided (95% CI) Mann–Whitney U test. e The delay in the rebound of plasma viremia was correlated against measures of SIV content, NK cell differentiation, and NK cell activity (as indicated at left; n = 13) from the final on-ART measurement (d339–374 p.i.) or during rebound following ATI (d6–13 post ATI). Per each correlation the two-tailed (95% CI) Spearman’s rank correlation coefficient (rho) is represented as a double-gradient heatmap and the size of each data point corresponds inversely to the log10-transformed Spearman’s p value. The false discovery rates (FDR) were calculated using SAS and significant values (Q < 0.05) are represented by a black border. Correlations for which data did not exist during that experimental phase are indicated as “NA”.

Similar articles

Cited by

References

    1. Kim S, et al. Licensing of natural killer cells by host major histocompatibility complex class I molecules. Nature. 2005;436:709–713. doi: 10.1038/nature03847. - DOI - PubMed
    1. Houchins JP, et al. Natural killer cell cytolytic activity is inhibited by NKG2-A and activated by NKG2-C. J. Immunol. 1997;158:3603–3609. - PubMed
    1. Carretero M, et al. The CD94 and NKG2-A C-type lectins covalently assemble to form a natural killer cell inhibitory receptor for HLA class I molecules. Eur. J. Immunol. 1997;27:563–567. doi: 10.1002/eji.1830270230. - DOI - PubMed
    1. Braud VM, et al. HLA-E binds to natural killer cell receptors CD94/NKG2A, B and C. Nature. 1998;391:795–799. doi: 10.1038/35869. - DOI - PubMed
    1. Ramsuran V, et al. Elevated HLA-A expression impairs HIV control through inhibition of NKG2A-expressing cells. Science. 2018;359:86–90. doi: 10.1126/science.aam8825. - DOI - PMC - PubMed

Publication types

MeSH terms