. 2021 May 17;12(1):2856.
doi: 10.1038/s41467-021-22973-9.

The neutrotime transcriptional signature defines a single continuum of neutrophils across biological compartments

Collaborators, Affiliations

The neutrotime transcriptional signature defines a single continuum of neutrophils across biological compartments

Ricardo Grieshaber-Bouyer et al. Nat Commun. .

Abstract

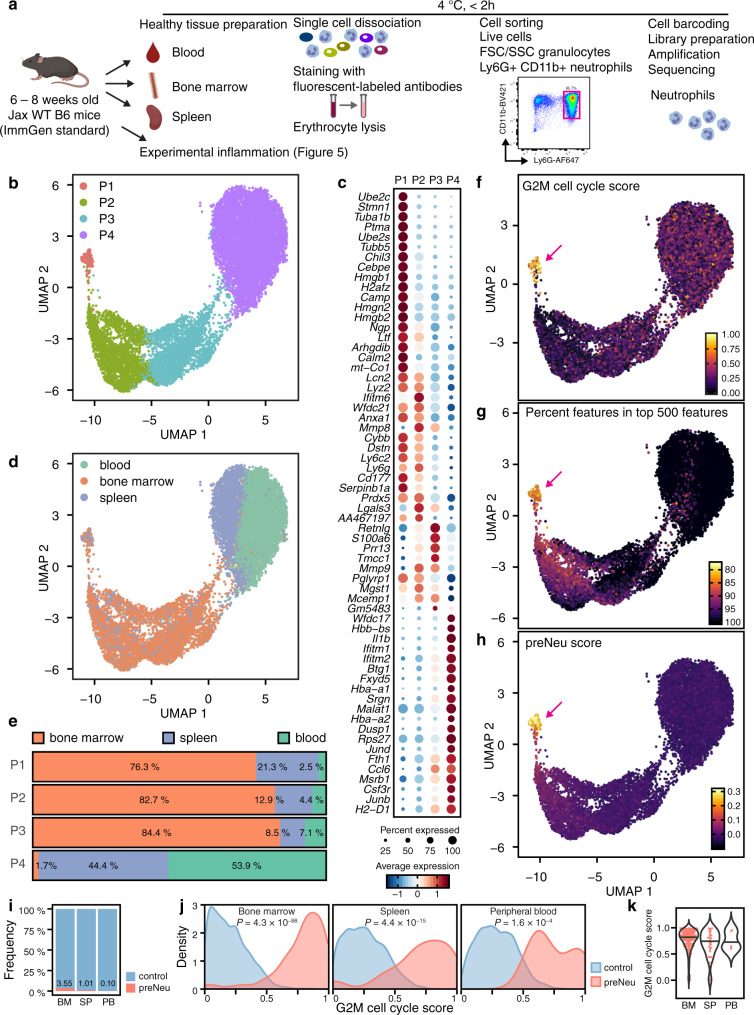
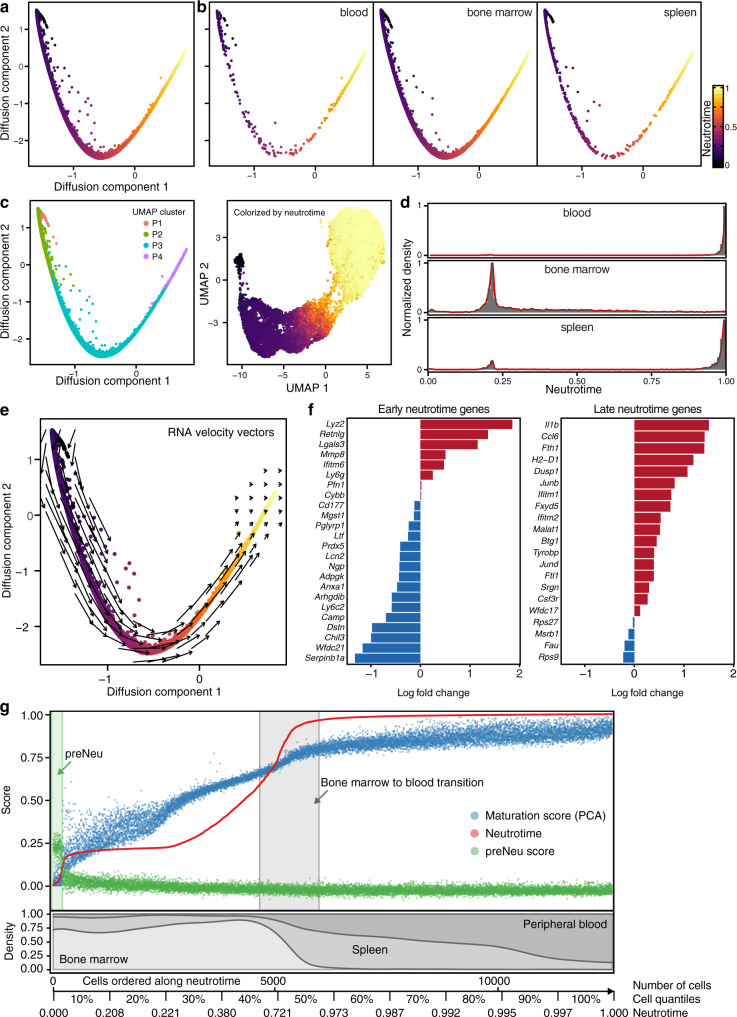
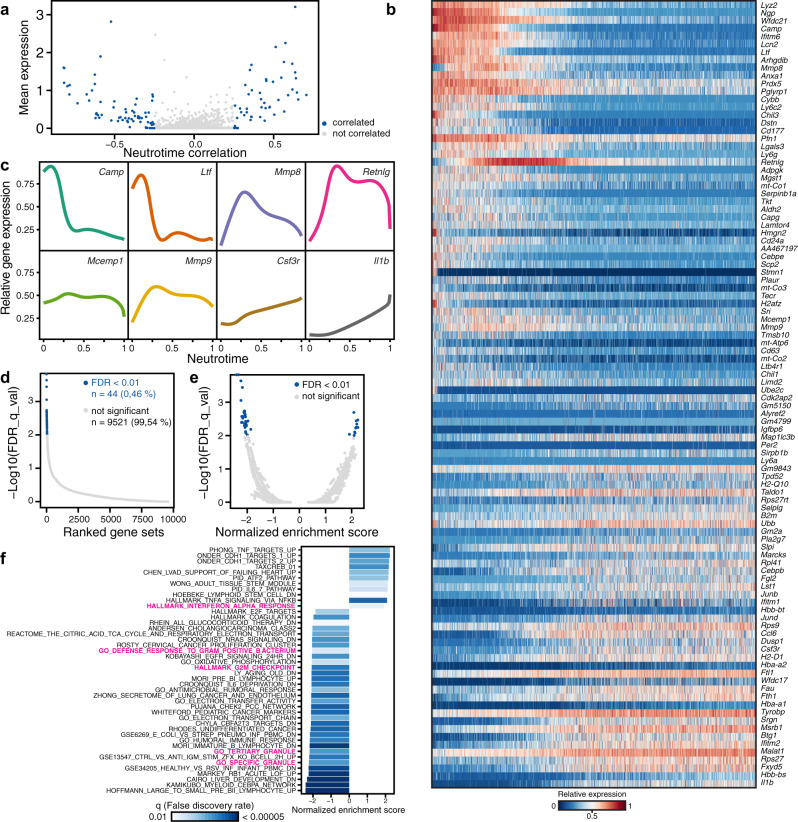
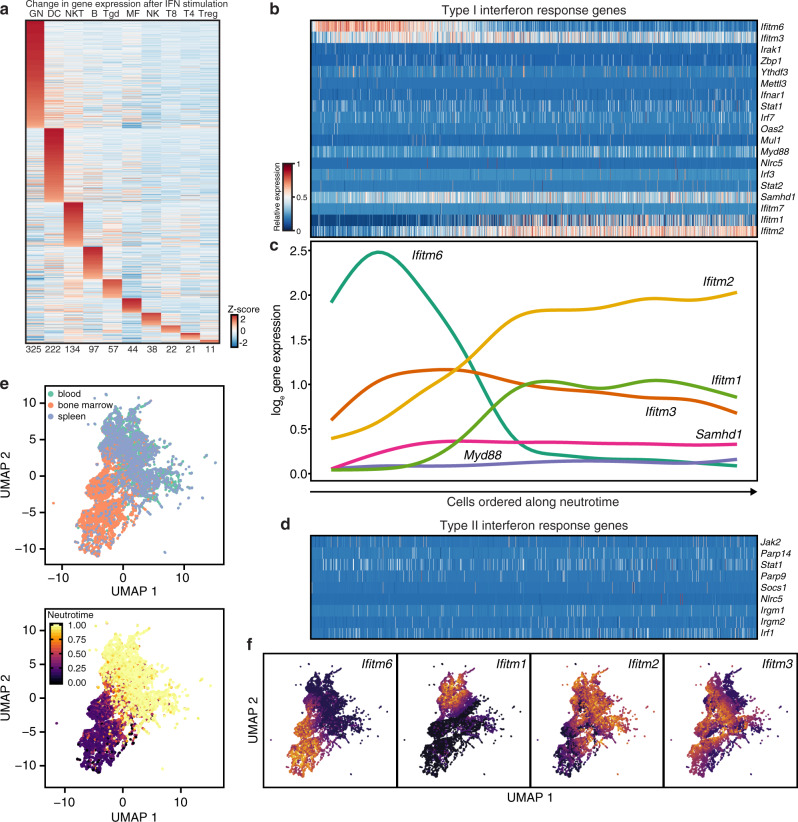
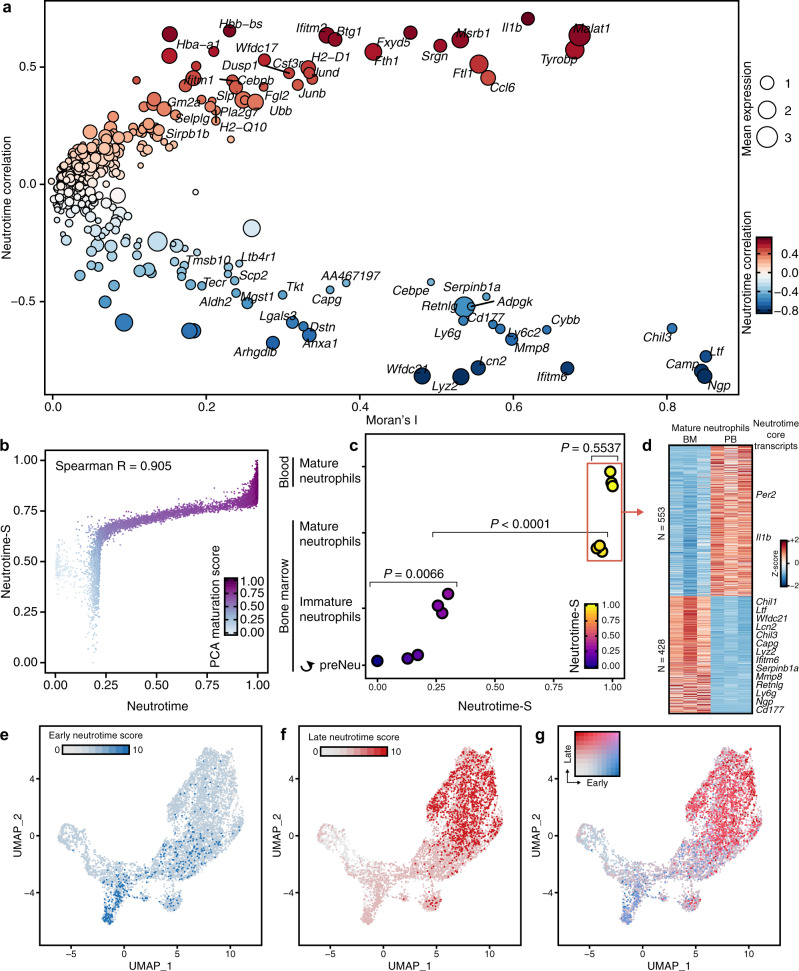
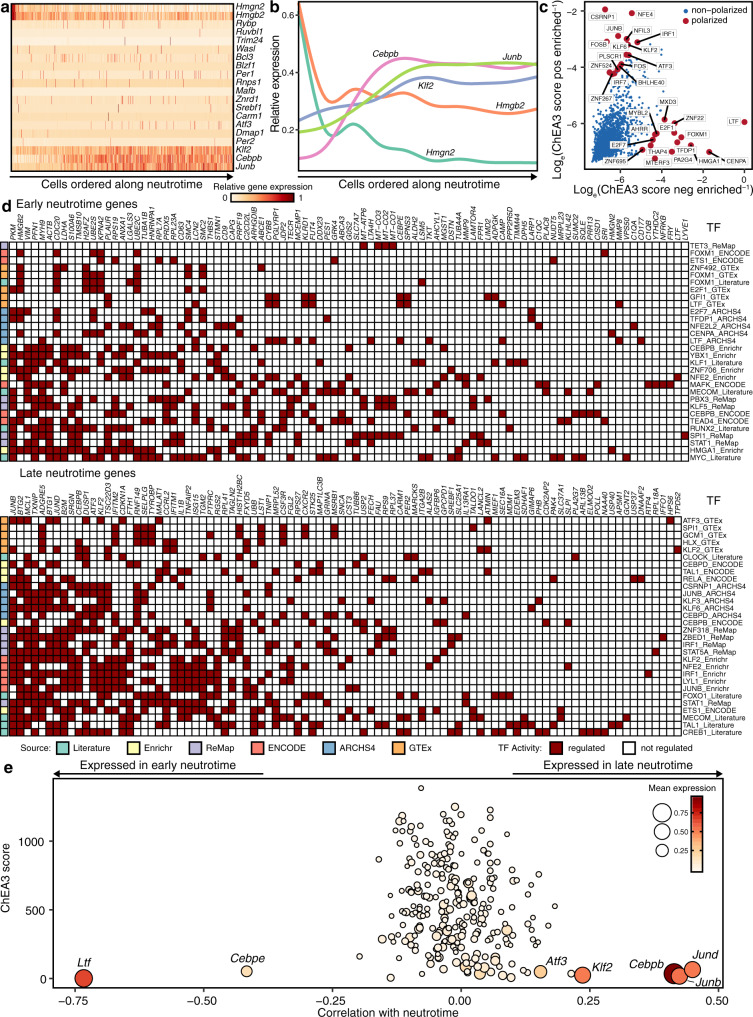
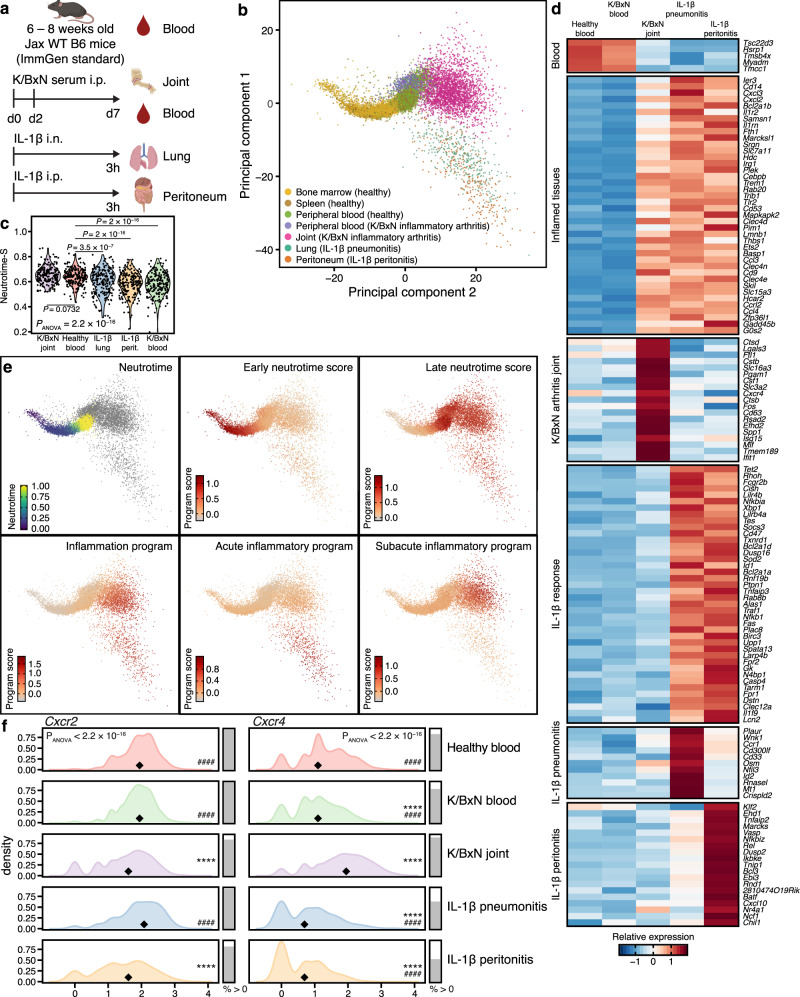
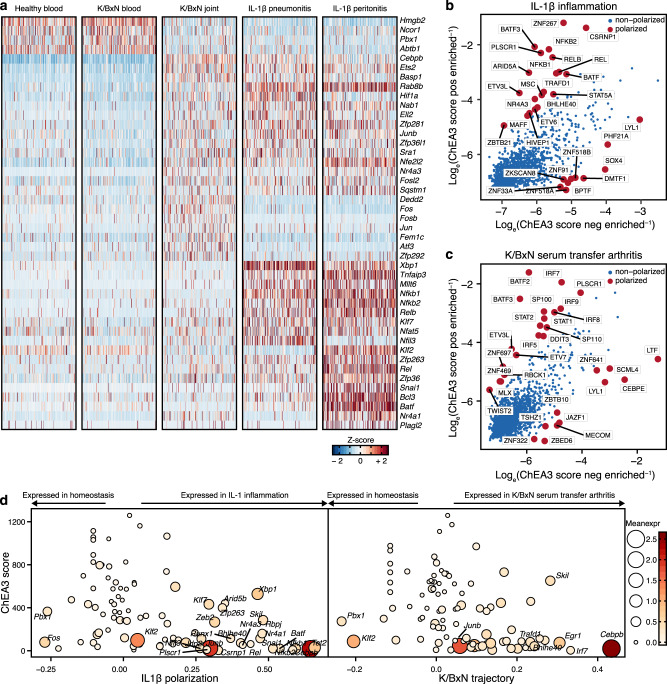
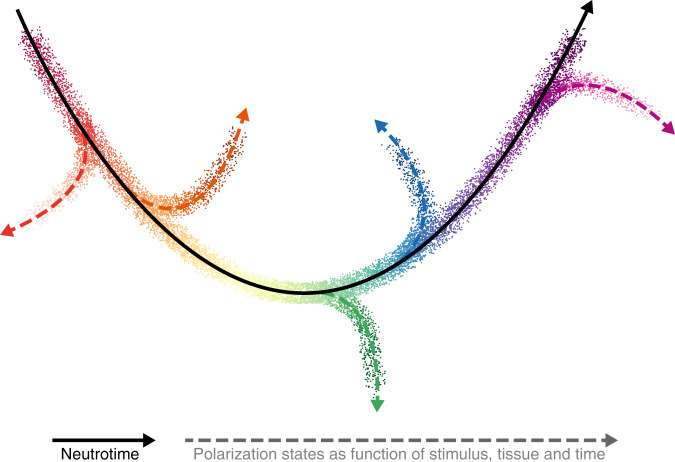
Neutrophils are implicated in multiple homeostatic and pathological processes, but whether functional diversity requires discrete neutrophil subsets is not known. Here, we apply single-cell RNA sequencing to neutrophils from normal and inflamed mouse tissues. Whereas conventional clustering yields multiple alternative organizational structures, diffusion mapping plus RNA velocity discloses a single developmental spectrum, ordered chronologically. Termed here neutrotime, this spectrum extends from immature pre-neutrophils, largely in bone marrow, to mature neutrophils predominantly in blood and spleen. The sharpest increments in neutrotime occur during the transitions from pre-neutrophils to immature neutrophils and from mature marrow neutrophils to those in blood. Human neutrophils exhibit a similar transcriptomic pattern. Neutrophils migrating into inflamed mouse lung, peritoneum and joint maintain the core mature neutrotime signature together with new transcriptional activity that varies with site and stimulus. Together, these data identify a single developmental spectrum as the dominant organizational theme of neutrophil heterogeneity.


Conflict of interest statement

The authors declare no competing interests.

Figures

Fig. 1
Fig. 1. Generating single-cell transcriptomes from neutrophils across multiple biological tissues.
a Overview of the experiment. Neutrophils were isolated from 6–8-week-old B6 mice from blood, bone marrow and spleen, stained for Ly6G and CD11b, and sorted, followed by droplet-based scRNA-seq using the 10X platform. Two independent experiments of healthy tissues were performed with N = 3 mice pooled for each tissue per experiment, totaling N = 12,619 cells, which were combined for analysis. b UMAP plot including all healthy neutrophils, partitioned exemplarily into four populations P1–P4. For smaller or larger numbers of populations, see Supplementary Fig. 3. c Marker gene expression in the 4-population model. Marker genes were identified by Wilcoxon Rank Sum test (two-tailed) using the Seurat function “FindAllMarkers” with standard settings; only genes with loge fold change ≥ 0.25 and Bonferroni adjusted p-value ≤ 0.05 are shown. d UMAP embedding of all cells colored by tissue of origin. e Abundance of populations across organs. Neutrophils colorized by: G2M cell cycle score (f), percentage of features in top 500 features (g) and preNeu score (h). i Frequency of preNeu across tissues. j G2M cell cycle score in preNeu and remaining cells in each tissue. Unpaired t-test (two-tailed) between preNeu and all other neutrophils within each tissue. k G2M cell cycle score of preNeu across tissues. ANOVA followed by unpaired t-test was used to compare the G2M cell cycle score between preNeu and other neutrophils in each tissue.
Fig. 2
Fig. 2. Derivation of a neutrotime signature across biological compartments.
a Low-dimensional embedding of neutrophils from bone marrow, blood and spleen in the same space using a diffusion map-based approach. b Diffusion map for each tissue. c Convergence between UMAP populations P1–P4 and diffusion map ordering, as well as neutrotime representation on the UMAP embedding. d Relative cell density along neutrotime in each organ. e RNA velocity vector field on the neutrotime embedding. f Validation of the neutrotime gene signature in developing HoxA9 cells (loge fold change at 96 h and 120 h of differentiation). g Distribution of neutrotime (derived from diffusion map), maturation score (derived from principal component analysis, see Supplementary Fig. 5a–c) and preNeu score in cells ordered along neutrotime. Lower panel indicates the rolling density of cells in each compartment along neutrotime. The scale indicated below also serves as legend for other figures in which cells are ordered along neutrotime on the x axis.
Fig. 3
Fig. 3. Gene expression along neutrotime.
a Gene expression correlation with neutrotime. Genes with Spearman correlation ≥ 0.25 (N = 48) and ≤ −0.25 (N = 66) are highlighted. b Gene expression heatmap of the top 50 positively and negatively correlated (Spearman) genes along neutrotime. c Gene expression profiles of select genes along neutrotime. d Ranked gene sets from Gene Set Enrichment Analysis (GSEA) versus false discovery rate. e Normalized enrichment score of GSEA gene sets versus false discovery rate. f Significantly enriched gene sets. Neutrophil-specific terms are highlighted in magenta. GSEA was performed as previously described. In short, a normalized enrichment score was calculated by going through a list of genes based on their Spearman correlation with neutrotime as a pre-ranked list and calculating a running-sum statistic, which was then normalized for differences in the sizes of the gene sets that were looked at (normalized enrichment score). To account for multiple hypothesis testing, an FDR approach was used to maintain a defined level of significance, values < 0.01 were considered.
Fig. 4
Fig. 4. Expression of interferon-related transcripts in neutrophils.
a Response of 10 ImmGen populations to in vivo interferon α administration highlights marked transcriptional shift in neutrophils. b, c Expression of transcripts associated with type I interferon response along neutrotime. Cells are ordered along the x axis as in Fig. 2g. d Expression of transcripts associated with type II interferon response along neutrotime. e UMAP clustering of neutrophils based exclusively on transcripts associated with type I interferon response. f Expression of transcripts associated with type I interferon response mapped onto the UMAP embedding.
Fig. 5
Fig. 5. Validation of the neutrotime model.
a Spatial autocorrelation (Moran’s I) of genes calculated from a separately obtained dimensionality reduction using Monocle 3 plotted versus genes correlated with neutrotime. b Calculation of a simplified version of neutrotime directly from gene expression space yields high convergence with neutrotime. R indicates the Spearman’s rank correlation coefficient. c Integration of bulk RNA-seq data from developing and mature neutrophils from Evrard et al. (GEO:GSE109467) onto neutrotime-S. One-way ANOVA (P < 0.0001) followed by Tukey’s multiple comparisons test. d Heatmap detailing differentially expressed genes between mature bone marrow neutrophils and blood neutrophils with Benjamin & Hochberg adjusted p-value (corresponding to FDR) ≤ 0.05 and log2 fold change ≥ 1. Several core neutrotime transcripts are highlighted. eg scRNA-Seq data were obtained from the Human Cell Atlas, and cells belonging to the neutrophil lineage (N = 7049) were clustered together. Expression of an early (e) and late (f) neutrotime signature in neutrophils. g combined representation of early and late neutrotime scores in the Human Cell Atlas confirms the trajectory.
Fig. 6
Fig. 6. Transcriptional regulation of neutrotime.
a, b Expression profiles of highly abundant transcription factors along neutrotime. c Inferred transcriptional regulators of early and late neutrotime via ChEA3. d Transcriptional orchestration of early and late neutrotime. e Inferred regulatory activity versus transcription factor expression along neutrotime. Cells are ordered along neutrotime in a and b with the same x axis scale as in Fig. 2g. As ChEA3 contains libraries from multiple species, only the corresponding human protein symbols are shown in c and d.
Fig. 7
Fig. 7. Neutrophils in acute and subacute inflammation.
a Overview of the experimental models. b Combined principal component analysis of healthy and inflamed neutrophils highlights a divergence between acute IL-1β-induced and subacute (K/BxN serum transfer arthritis) inflammation. N = 17,424 cells from N = 3 mice per inflamed condition total and N = 3 mice per healthy tissue and per experiment (two independent experiments). c Differences in neutrotime-S between inflamed compartments. ANOVA followed by Dunnett’s multiple comparison test (two-tailed) compared to healthy blood. d Heatmap summarizing shared and stimulus-specific gene expression changes in neutrophils. As for Fig. 1c, marker genes were identified by Wilcoxon Rank Sum test (two-tailed) using the Seurat function “FindAllMarkers” with standard settings; only genes with loge fold change ≥ 0.5 compared to healthy blood and Bonferroni adjusted p-value ≤ 0.05 were considered. For comparisons that examined changes between multiple groups compared to healthy blood (e.g. “Inflamed tissues”), as most conservative approach, the highest adjusted p-value was chosen for each gene. e Original neutrotime score in healthy cells, early and late neutrotime scores in healthy and inflamed cells highlights that the late neutrotime program stays active throughout inflammation. Lower panels highlight different inflammatory programs in inflamed cells. f Antagonistic expression of Cxcr2 and Cxcr4 in acute versus subacute inflammation: distribution of Cxcr2 and Cxcr4 expression (loge normalized expression) in healthy and inflamed tissues. Diamonds depict the median expression value and filled bars on the right illustrate the percentage of cells with non-zero expression. ANOVA was performed on the counts followed by Dunnett’s multiple comparison test (two-tailed). Percentage of cells with non-zero expression shown as descriptive statistic. ****P < 0.0001 compared to healthy blood; ####P < 0.0001 compared to K/BxN joint.
Fig. 8
Fig. 8. Transcriptional regulation of acute and subacute inflammation.
a Overview of differentially expressed transcription factors in healthy blood and inflamed compartments. As in Fig. 1c, marker genes for each condition were identified by Wilcoxon Rank Sum test (two-tailed) using the Seurat function “FindAllMarkers” with standard settings; only genes with loge fold change between conditions ≥ 0.25 and Bonferroni adjusted p value ≤ 0.05 were considered. The list of marker genes was subsetted to transcription factors to display differentially expressed transcription factors between conditions. Cells were randomly downsampled to 200 cells per condition for plotting only. b, c Inferred regulatory activity of TFs in IL-1β-induced and K/BxN-induced inflammation. As ChEA3 contains libraries from multiple species, only the corresponding human protein symbols are shown. d Inferred activity versus actual expression of TFs in IL-1β polarization and along the K/BxN trajectory in the diffusion map.
Fig. 9
Fig. 9. Proposed working model: neutrotime as the central organizing principle of neutrophil heterogeneity.
Healthy neutrophils are organized along one main sequence, termed neutrotime, from which they deviate as a function of time and environmental cues to reach different polarization states, orchestrated by shared and context-specific transcription factors. Experimental inflammation was found to recruit neutrophils predominantly near the mature pole of neutrotime; however, deviation from points earlier in the spectrum is also likely, reflected in arrows all along the neutrotime continuum. The colors of cells polarizing into different states illustrate that some features of the neutrotime sequence are maintained.

References

    1. Phillipson M, Kubes P. The healing power of neutrophils. Trends Immunol. 2019;40:635–647. doi: 10.1016/j.it.2019.05.001. - DOI - PubMed
    1. Giese MA, Hind LE, Huttenlocher A. Neutrophil plasticity in the tumor microenvironment. Blood. 2019;133:2159–2167. doi: 10.1182/blood-2018-11-844548. - DOI - PMC - PubMed
    1. Ng LG, Ostuni R, Hidalgo A. Heterogeneity of neutrophils. Nat. Rev. Immunol. 2019;19:255–265. doi: 10.1038/s41577-019-0141-8. - DOI - PubMed
    1. Wipke BT, Allen PM. Essential role of neutrophils in the initiation and progression of a murine model of rheumatoid arthritis. J. Immunol. 2001;167:1601–1608. doi: 10.4049/jimmunol.167.3.1601. - DOI - PubMed
    1. Wang J-X, et al. Ly6G ligation blocks recruitment of neutrophils via a β2-integrin-dependent mechanism. Blood. 2012;120:1489–1498. doi: 10.1182/blood-2012-01-404046. - DOI - PMC - PubMed

Publication types

MeSH terms