. 2021 May 17;12(1):2893.
doi: 10.1038/s41467-021-23173-1.

Heterologous vaccination regimens with self-amplifying RNA and adenoviral COVID vaccines induce robust immune responses in mice

Affiliations

Heterologous vaccination regimens with self-amplifying RNA and adenoviral COVID vaccines induce robust immune responses in mice

Alexandra J Spencer et al. Nat Commun. .

Abstract

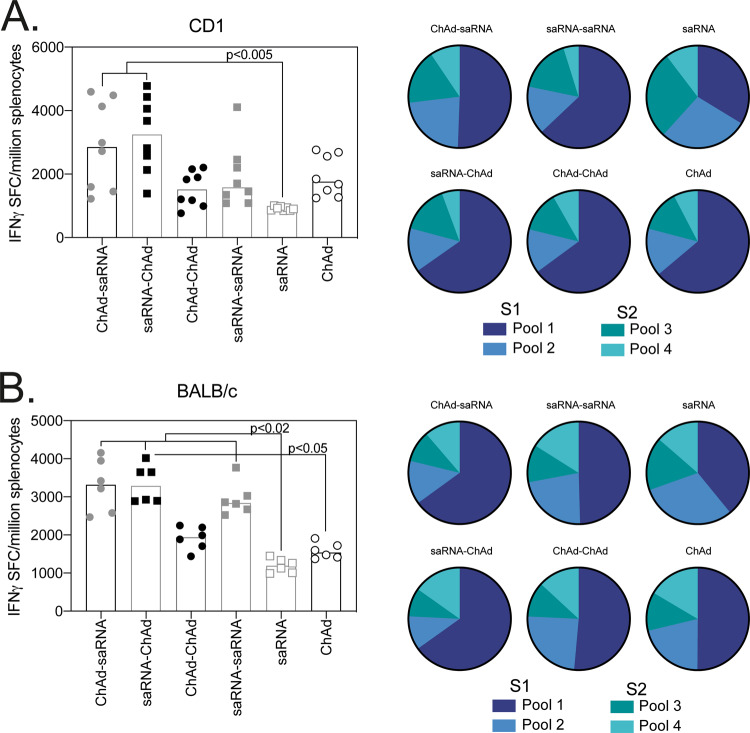
Several vaccines have demonstrated efficacy against SARS-CoV-2 mediated disease, yet there is limited data on the immune response induced by heterologous vaccination regimens using alternate vaccine modalities. Here, we present a detailed description of the immune response, in mice, following vaccination with a self-amplifying RNA (saRNA) vaccine and an adenoviral vectored vaccine (ChAdOx1 nCoV-19/AZD1222) against SARS-CoV-2. We demonstrate that antibody responses are higher in two-dose heterologous vaccination regimens than single-dose regimens. Neutralising titres after heterologous prime-boost were at least comparable or higher than the titres measured after homologous prime boost vaccination with viral vectors. Importantly, the cellular immune response after a heterologous regimen is dominated by cytotoxic T cells and Th1+ CD4 T cells, which is superior to the response induced in homologous vaccination regimens in mice. These results underpin the need for clinical trials to investigate the immunogenicity of heterologous regimens with alternate vaccine technologies.


Conflict of interest statement

S.C.G. is the co-founder and board member of Vaccitech (collaborators in the early development of this vaccine candidate), and is named as an inventor on a patent covering the use of ChAdOx1-vectored vaccines and a patent application covering this SARS-CoV-2 vaccine. T.L. is named as an inventor on a patent application covering this SARS-CoV-2 vaccine and was consultant to Vaccitech. P.M.K. and R.J.S. are co-founders and R.J.S. is a board member of VaxEquity and VacEquity, and are named inventors on a patent application covering the SARS-CoV-2 saRNA vaccine candidate.

Figures

Fig. 1
Fig. 1. Antibody responses following ChAd and saRNA vaccination.
Antibody responses were measured in the serum of CD1 (n = 8) and BALB/c (n = 6) mice collected 3 weeks after the final immunization. Graphs show SARS-CoV-2 spike-specific IgG (A), IgM and IgA (B), and IgG avidity (C) measured by ELISA, and SARS-CoV-2-pseudotyped virus neutralization (IC50) (D). Individual mice are represented by a single data point; bars represent the median response in each group (CD1 n = 8; BALB/c n = 6). Data in each graph were analysed with a one-way ANOVA Kruskal–Wallis test followed by post hoc Dunn’s multiple comparisons test to compare differences between vaccination groups; p-values indicate significant differences (p < 0.05) between groups.
Fig. 2
Fig. 2. SARS-CoV-2 spike-specific IgG subclasses following ChAd and saRNA vaccination.
For detection of IgG subclasses in the serum of CD1 (n = 8) and BALB/c (n = 6) mice, each sample was diluted to 1 IgG ELISA Unit. Graphs show optical density measured against each IgG subclass where individual data points were expressed as an OD and shown here as scatter dot plots with bars showing the median (A), followed by the heatmap summary representation with median response in each group to each IgG subclass (B). Individual mice are represented by a single data point, bars represent the median response in each group (CD1 n = 8; BALB/c n = 6) with serum collected 3 weeks after the final vaccination. Data in each graph was analysed with a one-way ANOVA Kruskal–Wallis followed by a post hoc Dunn’s multiple comparison test to compare differences between vaccination groups; p-values indicate significant difference (p < 0.05) between groups.
Fig. 3
Fig. 3. Breadth of T-cell response measured by ELISpot.
Graphs represent the total spike-specific IFNγ response (sum of peptide pools) measured in outbred CD1 (n = 8) (A) or inbred BALB/c (n = 6) (B) 3 weeks after the final vaccination. Pie charts represent the response to each peptide pool as a proportion of total response. Data points represent individual mice and bars represent the median response in each group. Data in each graph were analysed with a two-way ANOVA Friedman test and post hoc Dunn’s multiple comparison to compare between vaccination regimens, p-values indicate significant difference (p < 0.05) between groups.
Fig. 4
Fig. 4. Phenotype of the T-cell response following vaccination.
CD1 (n = 8) and BALB/c (n = 6) splenocytes collected 3 weeks after the final vaccination were stimulated for 6 h with pools of overlapping SARS-CoV-2 peptides prior to staining for effector and memory T cells markers and intracellular cytokines. A Graphs show the frequency of the spike-specific CD4+ T-cell responses (left) in CD1 (top panel) and BALB/c mice (bottom panel); heatmaps (middle) show the proportion of the response producing each cytokine and total number of antigen-specific cells of a T effector (Teff), T effector memory (Tem) or T central memory (Tcm) phenotype (right). B Graphs show the frequency of the spike-specific CD8+ T-cell responses (left) in CD1 (top panel) and BALB/c mice (bottom panel); heatmaps (middle) show the proportion of the response producing each cytokine and total number of antigen-specific cells of a T effector (Teff), T effector memory (Tem) or T central memory (Tcm) phenotype (right). Data points indicate individual mice; bars represent the median response in each group. Total numbers of each population are displayed in Supplementary Fig S3C. Data in each graph were analysed with a two-way ANOVA comparing the effect of vaccination regimen and cytokine production or T-cell phenotype, followed by a post hoc Tukey’s multiple comparison test to compare between vaccination regimens; p-values showing overall differences between vaccination groups (p < 0.05) are indicated on the graph.

References

    1. Tregoning JS, et al. Vaccines for COVID-19. Clin. Exp. Immunol. 2020;202:162–192. doi: 10.1111/cei.13517. - DOI - PMC - PubMed
    1. Blakney AK, et al. Big is beautiful: enhanced saRNA delivery and immunogenicity by a higher molecular weight, bioreducible, cationic polymer. ACS Nano. 2020;14:5711–5727. doi: 10.1021/acsnano.0c00326. - DOI - PMC - PubMed
    1. McKay PF, et al. Self-amplifying RNA SARS-CoV-2 lipid nanoparticle vaccine candidate induces high neutralizing antibody titers in mice. Nat. Commun. 2020;11:3523. doi: 10.1038/s41467-020-17409-9. - DOI - PMC - PubMed
    1. Ewer K, et al. Chimpanzee adenoviral vectors as vaccines for outbreak pathogens. Hum. Vaccin. Immunother. 2017;13:3020–3032. doi: 10.1080/21645515.2017.1383575. - DOI - PMC - PubMed
    1. Antrobus RD, et al. Clinical assessment of a novel recombinant simian adenovirus ChAdOx1 as a vectored vaccine expressing conserved Influenza A antigens. Mol. Ther. 2014;22:668–674. doi: 10.1038/mt.2013.284. - DOI - PMC - PubMed

Publication types

MeSH terms