. 2021 May 17;12(1):2863.
doi: 10.1038/s41467-021-23197-7.

Genetic fate-mapping reveals surface accumulation but not deep organ invasion of pleural and peritoneal cavity macrophages following injury

Affiliations

Genetic fate-mapping reveals surface accumulation but not deep organ invasion of pleural and peritoneal cavity macrophages following injury

Hengwei Jin et al. Nat Commun. .

Abstract

During injury, monocytes are recruited from the circulation to inflamed tissues and differentiate locally into mature macrophages, with prior reports showing that cavity macrophages of the peritoneum and pericardium invade deeply into the respective organs to promote repair. Here we report a dual recombinase-mediated genetic system designed to trace cavity macrophages in vivo by intersectional detection of two characteristic markers. Lineage tracing with this method shows accumulation of cavity macrophages during lung and liver injury on the surface of visceral organs without penetration into the parenchyma. Additional data suggest that these peritoneal or pleural cavity macrophages do not contribute to tissue repair and regeneration. Our in vivo genetic targeting approach thus provides a reliable method to identify and characterize cavity macrophages during their development and in tissue repair and regeneration, and distinguishes these cells from other lineages.


Conflict of interest statement

The authors declare no competing interests.

Figures

Fig. 1
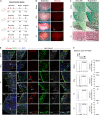
Fig. 1. Generation and characterization of a genetic system for specific targeting of cavity macrophages.
a Schematic figure showing CD45-Dre mediates Stop cassette removal from Gata6-iCreER and places CreER directly under Gata6 promoter. After tamoxifen (Tam), Cre-loxP recombination labels cells by tdTomato. b Intersectional genetics marks CD45+GATA6+ cells as tdTomato+. c Schematic figure showing experimental design using cavity macrophage tracing tool CD45-Dre;Gata6-iCreER (G6Mø-CreER). d Flow cytometric analysis of the percentage of tdTomato+ cells in macrophages from blood, pleural, and peritoneal cavity with or without Tam. e Immunostaining for tdTomato, CD11b, GATA6, F4/80 on dissociated cells from blood, pleural, or peritoneal cavity. Boxed regions are magnified. f Quantification of the percentage of tdTomato+ cells in GATA6+ or F4/80+ macrophages. Data are the mean ± SD; n = 5 mice per group. g Quantification of the percentage of GATA6+ or F4/80+ macrophages in tdTomato+ cells. Data are the mean ± SD; n = 5 mice per group. h FACS showing the percentage of tdTomato+ cells expressing F4/80. i Whole-mount epifluorescence images and immunostaining for CD45 and tdTomato shows no resident tdTomato+ macrophages in visceral organs. Each image is representative of 5 individual biological samples. Scale bars, yellow, 1 mm; white, 100 µm. Source data are provided as a Source Data file.
Fig. 2
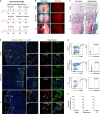
Fig. 2. Peritoneal macrophages do not invade deep into the liver parenchyma after CCl4, HI, or CI treatment.
a Schematic figure showing experimental strategy. HI heat injury, CI cryoinjury. b Whole-mount bright-field and fluorescent images of livers with different injury models. Arrowheads, injury site. Scale bars, 1 mm. c Sirius red staining of liver tissue sections from livers treated with CCl4, CI, HI, or sham operation. Boxed regions are magnified. Scale bars, 100 µm. d Immunostaining for tdTomato, GATA6, and F4/80 on the injured region of the liver section. m.l., mesothelial layer. Boxed regions are magnified. Scale bars, 100 µm. e FACS analysis and quantification of the percentage of F4/80+ macrophages expression tdTomato. Data are the mean ± SD; n = 5 mice per group. Each image is representative of five individual biological samples (bd). Source data are provided as a Source Data file.
Fig. 3
Fig. 3. Pleural macrophages do not invade deep into the lung parenchyma after bleomycin treatment or CI.
a Schematic figure showing experimental strategies. CI cryoinjury. b Whole-mount bright-field and fluorescent images of lungs after different injuries. Dotted line, CI region. Scale bars, 1 mm. c Sirius red staining of lung tissue sections after bleomycin or cryoinjury in lungs. Boxed regions are magnified. Scale bars, 100 µm. d Immunostaining for tdTomato, GATA6, and F4/80 on injured regions of lungs. m.l., mesothelial layer. Boxed regions are magnified. Scale bars, 100 µm. e, f FACS and quantification analysis of the percentage of macrophages expressing tdTomato from injury regions of the lung. Data are the mean ± SD; n = 5 mice per group. Each image is representative of five individual biological samples (bd). Source data are provided as a Source Data file.
Fig. 4
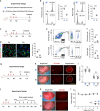
Fig. 4. Genetic ablation of cavity macrophages did not affect liver repair after injury.
a Schematic figure showing the experimental design. DT diphtheria toxin. b Flow cytometric and quantification analysis of the percentage of CD11b+F4/80+ macrophages expressing tdTomato from peritoneal cavity after PBS treatment (no DT). Data are the mean ± SD; n = 5 mice per group; ns nonsignificant. c Immunostaining for tdTomato and F4/80 on dissociated cells from the peritoneal or pleural cavity after DT treatment of the G6Mø-CreER;R26-tdTomato/iDTR mice. Quantification of the percentage of F4/80+ macrophages expressing tdTomato. Data are the mean ± SD; n = 5 mice per group; ****P < 0.0001. Each image is representative of five individual biological samples. d Flow cytometric and quantification analysis of the percentage of CD11b+F4/80+ macrophages expressing tdTomato in the pleural cavity, and peritoneal cavity, respectively. Data are the mean ± SD; n = 5 mice per group; ****P < 0.0001. e Schematic figure showing the experimental design. HI heat injury. f Whole-mount bright-field and fluorescence images of livers at 7 days after HI. Boxed regions are magnified; circles, heat injury site. Each image is representative of eight individual biological samples. g Quantification of injury size from 4 h to 7 days after heart injury. Data are the mean ± SD; n = 8 mice per group; ns nonsignificant. h Schematic figure showing the experimental design. i Whole-mount bright-field and fluorescence images of livers at 5 days after CCl4 treatment. Each image is representative of five individual biological samples. j, Quantification of body weight at different days after CCl4 treatment. Data are the mean ± SD; n = 5 mice per group; ns, non-significant. Scale bars: yellow, 1 mm; white, 100 µm. P value was calculated by unpaired two-sided Student’s t test (bd, g) or two-way ANOVA coupled with multiple comparisons (j). Source data are provided as a Source Data file.
Fig. 5
Fig. 5. Gata6 deletion in cavity macrophages did not affect injury repair in the liver.
a Schematic figure showing the experimental design. b Flow cytometric and quantification analysis of the percentage CD11b+F4/80+ macrophages expressing tdTomato from the pleural and peritoneal cavity. Data are the mean ± SD; n = 5 mice per group; ****P < 0.0001. c Schematic figure showing the experimental design. d Immunostaining for tdTomato and F4/80 on dissociated cells from peritoneal cavity at 9 weeks and 13 weeks after TAM. Data are the mean ± SD; n = 5 mice per group. ****P < 0.0001. Each image is representative of five individual biological samples. e, f Flow cytometric analysis and quantification of the percentage of CD11b+F4/80+ macrophages expressing tdTomato. Data are the mean ± SD; n = 5 mice per group; ****P < 0.0001. g Schematic figure showing the experimental design. HI heat injury. h Whole-mount bright-field and fluorescence images of livers collected at 7 days after heart injury. Boxed regions are magnified; circles, heat injury site. Each image is representative of eight individual biological samples. i Quantification of injury size at 4 h and 7 days post HI. Data are the mean ± SD; n = 8 mice per group; ns nonsignificant. j Schematic figure showing the experimental design. k Whole-mount bright-field and fluorescence images of livers collected at 5 days after injury. Each image is representative of five individual biological samples. l Quantification of body weight at different days after CCl4 treatment. Data are the mean ± SD; n = 5 mice per group; ns, non-significant. Scale bars: yellow, 1 mm; white, 100 µm. P value was calculated by unpaired two-sided Student’s t test (b, d, f, i) or two-way ANOVA coupled with multiple comparisons (l). Source data are provided as a Source Data file.
Fig. 6
Fig. 6. Generation and characterization of Gata6-iCreER2 for fate mapping of cavity macrophages.
a Schematic figure showing experimental strategy. Gata6-iCreER2 uses a knock-in strategy that maintains endogenous Gata6 gene expression. b Intersectional genetics marks CD45+GATA6+ cells as tdTomato. c Schematic figure showing experimental design using a second cavity macrophage CreER line (G6Mø-CreER2). d, e Flow cytometric analysis of the percentage of tdTomato+ cells in macrophages from the pleural and peritoneal cavity (left panel); and the percentage of F4/80+ macrophages in tdTomato+ cells from the pleural and peritoneal cavity (right panel). For pleural cells, data are the mean ± SD; n = 4 mice per group. For peritoneal cells, data are the mean ± SD; n = 5 mice per group. f Immunostaining for tdTomato, GATA6, and F4/80 on dissociated cells from the pleural or peritoneal cavity. Boxed regions are magnified. g Quantification of the percentage of F4/80+ macrophages expressing tdTomato, or the percentage of tdTomato+ cells expressing F4/80. Data are the mean ± SD; n = 5 mice per group. h Whole-mount epifluorescence images of the liver after CCl4 injury. The boxed region is magnified. i Immunostaining for tdTomato, GATA6, and F4/80 on the injured region of livers. Dotted lines indicate the surface of tissue sections. Boxed regions are magnified. Each image is representative of five individual biological samples (f, h, i). Scale bars, yellow, 1 mm; white, 100 µm. Source data are provided as a Source Data file.
Fig. 7
Fig. 7. GATA6+tdTomato cells in the CCl4-treated livers are mainly resident Kupffer cells.
a Schematic figure showing experimental strategy. b Immunostaining for tdTomato, GATA6, and CLEC4F on liver sections. c Schematic figure showing experimental strategy. d Immunostaining for tdTomato, GATA6, and F4/80 on the injured region of the liver section. e Schematic figure showing experimental strategy. f Immunostaining for tdTomato, GATA6, and CD11b on liver sections. g Schematic figure showing experimental strategy. h Immunostaining for tdTomato, GATA6, and CCR2 on liver sections. Scale bars, 100 µm. For b, d, f, h arrowheads indicate GATA6+ cells after injury. Boxed regions are magnified. Each image is representative of five individual samples.
Fig. 8
Fig. 8. Pleural and peritoneal cavity macrophages minimally invade visceral organs after injuries.
Gata6+ cavity macrophages are located in peritoneal and pleural cavities, which are separated by mesothelium that wraps visceral organs such as lung, and liver. After injuries, cavity macrophages are recruited to the surface of visceral organs, but they do not infiltrate into the parenchyma of organs. Nor do they play a functional role in tissue repair and regeneration.

References

    1. Geissmann F, et al. Development of monocytes, macrophages, and dendritic cells. Science. 2010;327:656–661. doi: 10.1126/science.1178331. - DOI - PMC - PubMed
    1. Wynn TA, Chawla A, Pollard JW. Macrophage biology in development, homeostasis and disease. Nature. 2013;496:445–455. doi: 10.1038/nature12034. - DOI - PMC - PubMed
    1. van Furth R, Cohn ZA. The origin and kinetics of mononuclear phagocytes. J. Exp. Med. 1968;128:415–435. doi: 10.1084/jem.128.3.415. - DOI - PMC - PubMed
    1. van Furth R, Diesselhoff-Den Dulk MM. The kinetics of promonocytes and monocytes in the bone marrow. J. Exp. Med. 1970;132:813–828. doi: 10.1084/jem.132.4.813. - DOI - PMC - PubMed
    1. Serhan CN, et al. Resolution of inflammation: state of the art, definitions and terms. FASEB J. 2007;21:325–332. doi: 10.1096/fj.06-7227rev. - DOI - PMC - PubMed

Publication types

MeSH terms