

End-tidal to arterial carbon dioxide gradient is associated with increased mortality in patients with traumatic brain injury: a retrospective observational study
- PMID: 34001982
- PMCID: PMC8129079
- DOI: 10.1038/s41598-021-89913-x
End-tidal to arterial carbon dioxide gradient is associated with increased mortality in patients with traumatic brain injury: a retrospective observational study
Abstract
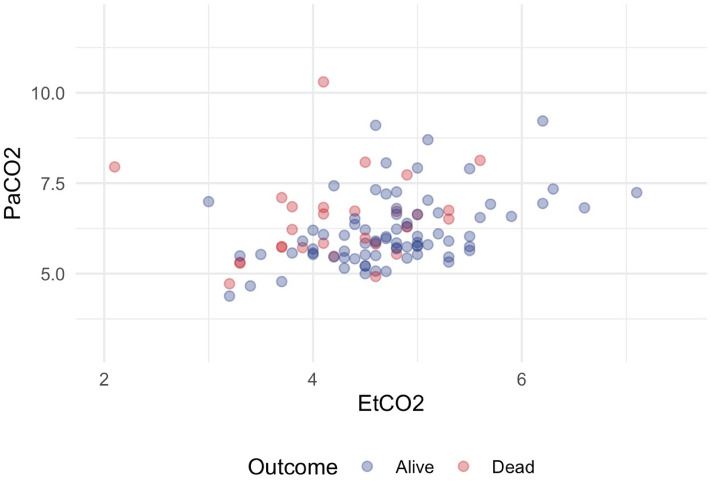
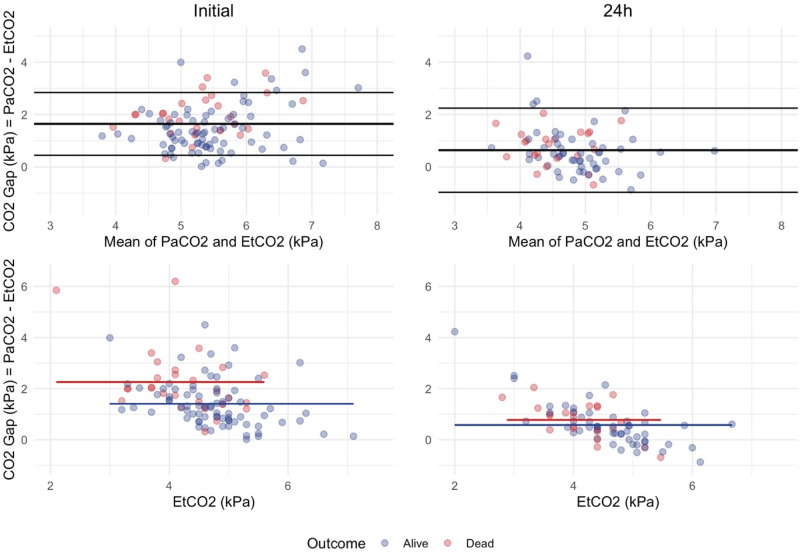
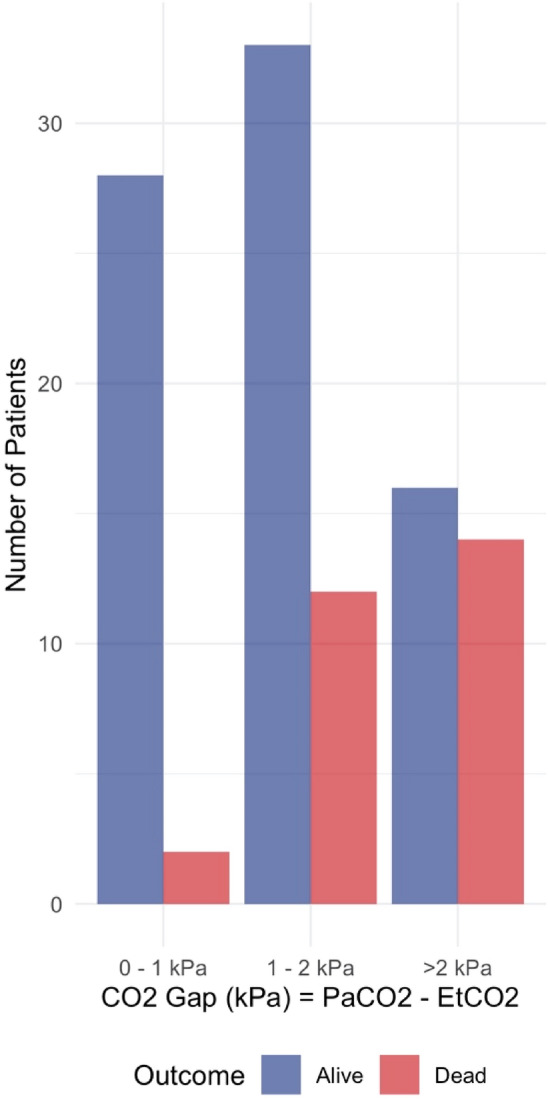
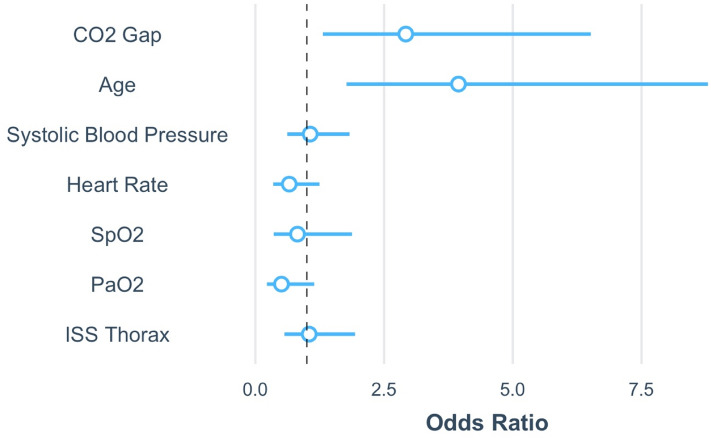
Early definitive airway protection and normoventilation are key principles in the treatment of severe traumatic brain injury. These are currently guided by end tidal CO2 as a proxy for PaCO2. We assessed whether the difference between end tidal CO2 and PaCO2 at hospital admission is associated with in-hospital mortality. We conducted a retrospective observational cohort study of consecutive patients with traumatic brain injury who were intubated and transported by Helicopter Emergency Medical Services to a Level 1 trauma center between January 2014 and December 2019. We assessed the association between the CO2 gap-defined as the difference between end tidal CO2 and PaCO2-and in-hospital mortality using multivariate logistic regression models. 105 patients were included in this study. The mean ± SD CO2 gap at admission was 1.64 ± 1.09 kPa and significantly greater in non-survivors than survivors (2.26 ± 1.30 kPa vs. 1.42 ± 0.92 kPa, p < .001). The correlation between EtCO2 and PaCO2 at admission was low (Pearson's r = .287). The mean CO2 gap after 24 h was only 0.64 ± 0.82 kPa, and no longer significantly different between non-survivors and survivors. The multivariate logistic regression model showed that the CO2 gap was independently associated with increased mortality in this cohort and associated with a 2.7-fold increased mortality for every 1 kPa increase in the CO2 gap (OR 2.692, 95% CI 1.293 to 5.646, p = .009). This study demonstrates that the difference between EtCO2 and PaCO2 is significantly associated with in-hospital mortality in patients with traumatic brain injury. EtCO2 was significantly lower than PaCO2, making it an unreliable proxy for PaCO2 when aiming for normocapnic ventilation. The CO2 gap can lead to iatrogenic hypoventilation when normocapnic ventilation is aimed and might thereby increase in-hospital mortality.
Conflict of interest statement
The authors declare no competing interests.
Figures
Similar articles
-
End-tidal carbon dioxide and arterial to end-tidal carbon dioxide gradient are associated with mortality in patients with neurological injuries.Sci Rep. 2024 Aug 19;14(1):19172. doi: 10.1038/s41598-024-69143-7. Sci Rep. 2024. PMID: 39160225 Free PMC article.
-
Agreement between arterial and end-tidal carbon dioxide in adult patients admitted with serious traumatic brain injury.PLoS One. 2024 Feb 2;19(2):e0297113. doi: 10.1371/journal.pone.0297113. eCollection 2024. PLoS One. 2024. PMID: 38306331 Free PMC article.
-
End-tidal and arterial carbon dioxide gradient in serious traumatic brain injury after prehospital emergency anaesthesia: a retrospective observational study.Emerg Med J. 2020 Nov;37(11):674-679. doi: 10.1136/emermed-2019-209077. Epub 2020 Sep 14. Emerg Med J. 2020. PMID: 32928874 Free PMC article.
-
Concordance of end-tidal carbon dioxide and arterial carbon dioxide in severe traumatic brain injury.J Trauma. 2009 Sep;67(3):526-30. doi: 10.1097/TA.0b013e3181866432. J Trauma. 2009. PMID: 19741395
-
Agreement Between Arterial Carbon Dioxide Levels With End-Tidal Carbon Dioxide Levels and Associated Factors in Children Hospitalized With Traumatic Brain Injury.JAMA Netw Open. 2019 Aug 2;2(8):e199448. doi: 10.1001/jamanetworkopen.2019.9448. JAMA Netw Open. 2019. PMID: 31418806 Free PMC article.
Cited by
-
End-tidal carbon dioxide and arterial to end-tidal carbon dioxide gradient are associated with mortality in patients with neurological injuries.Sci Rep. 2024 Aug 19;14(1):19172. doi: 10.1038/s41598-024-69143-7. Sci Rep. 2024. PMID: 39160225 Free PMC article.
-
Agreement between arterial and end-tidal carbon dioxide in adult patients admitted with serious traumatic brain injury.PLoS One. 2024 Feb 2;19(2):e0297113. doi: 10.1371/journal.pone.0297113. eCollection 2024. PLoS One. 2024. PMID: 38306331 Free PMC article.
-
End-tidal carbon dioxide tension is a reliable surrogate of arterial carbon dioxide tension across different oxygen, carbon dioxide and barometric pressures.ERJ Open Res. 2023 Apr 17;9(2):00507-2022. doi: 10.1183/23120541.00507-2022. eCollection 2023 Mar. ERJ Open Res. 2023. PMID: 37077546 Free PMC article.
-
Diagnostic Modalities in Critical Care: Point-of-Care Approach.Diagnostics (Basel). 2021 Nov 25;11(12):2202. doi: 10.3390/diagnostics11122202. Diagnostics (Basel). 2021. PMID: 34943438 Free PMC article. Review.
-
Airway management in a Helicopter Emergency Medical Service (HEMS): a retrospective observational study of 365 out-of-hospital intubations.BMC Emerg Med. 2022 Feb 8;22(1):23. doi: 10.1186/s12873-022-00579-8. BMC Emerg Med. 2022. PMID: 35135493 Free PMC article.
References
Publication types
MeSH terms
Substances
LinkOut - more resources
Full Text Sources
Other Literature Sources
Medical
Miscellaneous
