. 2021 May 17;11(1):10461.
doi: 10.1038/s41598-021-89933-7.

Therapeutically actionable signaling node to rescue AURKA driven loss of primary cilia in VHL-deficient cells

Affiliations

Therapeutically actionable signaling node to rescue AURKA driven loss of primary cilia in VHL-deficient cells

Pratim Chowdhury et al. Sci Rep. .

Erratum in

Abstract

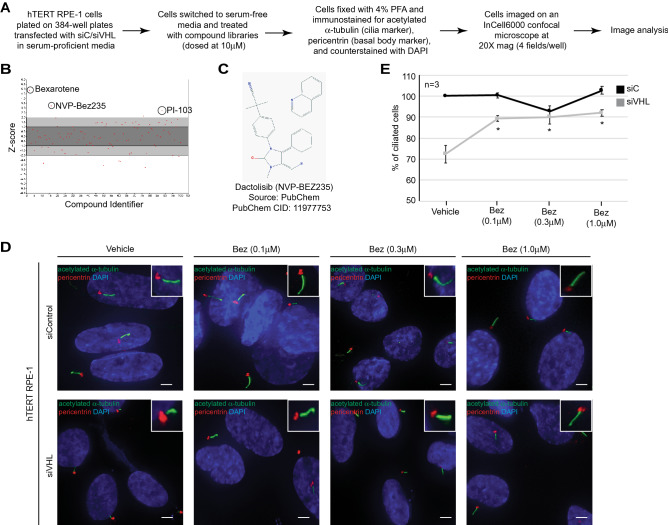
Loss of primary cilia in cells deficient for the tumor suppressor von Hippel Lindau (VHL) arise from elevated Aurora Kinase A (AURKA) levels. VHL in its role as an E3 ubiquitin ligase targets AURKA for degradation and in the absence of VHL, high levels of AURKA result in destabilization of the primary cilium. We identified NVP-BEZ235, a dual PI3K/AKT and mTOR inhibitor, in an image-based high throughput screen, as a small molecule that restored primary cilia in VHL-deficient cells. We identified the ability of AKT to modulate AURKA expression at the transcript and protein level. Independent modulation of AKT and mTOR signaling decreased AURKA expression in cells confirming AURKA as a new signaling node downstream of the PI3K cascade. Corroborating these data, a genetic knockdown of AKT in cells deficient for VHL rescued the ability of these cells to ciliate. Finally, inhibition of AKT/mTOR using NVP-BEZ235 was efficacious in reducing tumor burden in a 786-0 xenograft model of renal cell carcinoma. These data highlight a previously unappreciated signaling node downstream of the AKT/mTOR pathway via AURKA that can be targeted in VHL-null cells to restore ciliogenesis.


Conflict of interest statement

The authors declare no competing interests.

Figures

Figure 1
Figure 1
NVP-BEZ235 regulates ciliogenesis in VHL-deficient cells. (A) Workflow used for the image-based screening assay. (B) Graphical representation showing the Z-score of compounds used in the screen. The compounds annotated with names were identified as positive hits. (C) Chemical structure of NVP-BEZ235. (D) Representative images (60X magnification) of hTERT RPE-1 cells transfected with siC (scrambled control) or siVHL showing acetylated α-tubulin (cilia marker, green) and pericentrin (basal body marker, red). Nuclei are counterstained with DAPI in blue. Insets show a magnified image of a cilium for each of the treatment conditions. Scale bar, 10 μM. (E) Graphical representation of the percentage of ciliated cells treated with Vehicle or NVP-BEZ235 (Bez) at the indicated doses in VHL-proficient (siC, black line) and VHL-deficient (gray line) cells. *Statistical significance (Students t-test) compared to vehicle (DMSO) treated control (p < 0.01).
Figure 2
Figure 2
NVP-BEZ235 modulates AURKA expression in cells deficient for VHL. (A, C) VHL-proficient and VHL-deficient cells were treated with Vehicle or NVP-BEZ235 (Bez) as indicated and blotted for the antibodies shown. (B) Densitometric analysis graphed to show the ratio of phospho-AKT to total AKT. Black bars—siC (scrambled control) and gray bars—siVHL. #Statistical significance (Students t-test) compared to vehicle (DMSO) treated control (siC) (p < 0.001), **statistical significance (Students t-test) compared to vehicle treated siVHL (p-values as indicated). (D) Graphical representation of densitometric data showing fold-change in AURKA mRNA expression. Black bars—siC and gray bars—siVHL. #Statistical significance (Students t-test) compared to vehicle (DMSO) treated control (siC) (p < 0.001), **statistical significance (Students t-test) compared to vehicle treated siVHL (p-values as indicated). (E) Graphical representation of densitometric data showing fold-change in VHL mRNA expression. Black bars—siC and gray bars—siVHL. #Statistical significance (Students t-test) compared to siC for each of the treatment conditions (p < 0.05). (F) Three VHL-null RCC cells lines (786-0, 769-P, A-498) treated with Vehicle and NVP-BEZ235 (Bez) at the indicated doses and blotted as shown.
Figure 3
Figure 3
AKT and mTOR modulate AURKA. (A) hTERT RPE-1 cells proficient or deficient for AKT were blotted for the antibodies shown. (B) Graphical representation of densitometric data shows levels of AKT and AURKA normalized to 100. Black bars—siC (scrambled controls), gray bars—siAKT. (C) Graphical representation of AURKA mRNA transcript levels in hTERT RPE-1 cells transfected with siC (black bars) and siAKT (gray bars). **Statistical significance (Students t-test) with indicated p-values. (D) hTERT RPE-1 cells transfected with myristoylated (myr) AKT and blotted as indicated. (E, G) Whole cell extracts from hTERT RPE-1 cells proficient or deficient for VHL treated with LY294002 (10 μM) (E) or MK2206 (2 μM) (G) and blotted for the antibodies shown. (F, H) Densitometric values from immunoblots were graphed to show the normalized levels of AURKA protein levels in cells treated with LY294002 (F) or MK2206 (H). **,***Statistical significance (Students t-test) with p-values as indicated. (I) Whole cell extracts from hTERT RPE-1 cells proficient or deficient for VHL treated with rapamycin (200 nM) as indicated were blotted for the antibodies shown. (J) Graphical representation of AURKA mRNA transcript levels in hTERT RPE-1 cells transfected with siC (black bars) and siVHL (gray bars) and treated with rapamycin. #Statistical significance (Students t-test) compared to siC (p < 0.05), *statistical significance (Students t-test) with indicated p-value.
Figure 4
Figure 4
Co-deletion of AKT and VHL rescues ciliogenesis. (A) Representative images of hTERT RPE-1 cells (60X magnification) transfected with siC (scrambled control), siVHL or co-transfected with siVHL and siAKT showing acetylated α-tubulin (cilia marker, green) and pericentrin (basal body marker, red). Nuclei are counterstained with DAPI in blue. Insets show a magnified image of a cilium for each of the treatment conditions. Scale bar, 10 μM. (B) Graphical representation of the percentage of ciliated cells for each of the treatments as indicated in VHL-proficient (siC, black line) and VHL-deficient (gray line) cells. **Statistical significance (Students t-test) compared to vehicle (DMSO) treated controls with indicated p-values. (C) Whole cell extracts from hTERT RPE-1 cells transfected with siC, siVHL or co-transfected with siVHL and siAKT, immunoblotted using antibodies shown.
Figure 5
Figure 5
Combined inhibition of AKT/mTOR and AURKA signaling reduces tumor burden in a mouse xenograft model of RCC. (A) Schematic showing study design using a 786-0 mouse xenograft model treated with vehicle, and MLN8237. (B) Line chart plotted to show tumor volume (Week 1–Week 6). Vehicle (black circles), MLN8237 (red squares). (C) Scatter plot depicting the final tumor volume (mm3) from mice treated as indicated. *Statistical significance (Kolmogorov–Smirnov test) with p-value as indicated. (D) Schematic showing study design using a 786-0 mouse xenograft model treated with Vehicle, MLN8237, NVP-BEZ235 or a combination of MLN8237 and NVP-BEZ235. (E) Line chart plotted to show tumor volume (Week 1–Week 5, Week 4 the tumors were not measured and therefore not plotted). Vehicle (black circles), MLN8237 (blue squares), NVP-BEZ235 (BEZ235) (green triangle) and a combination of MLN8237 and NVP-BEZ235 (red line). (F, G) Scatter plot depicting the final tumor volume (mm3) (F) and final tumor weight (g) (G) from mice treated as indicated. *Statistical significance (Kolmogorov–Smirnov test) with p-values as indicated. (H, I) Representative images showing staining from tumor tissue for each of the treatments using Ki67 (H) and H&E (I) imaged at ×10 magnification. Scale bar, 500 μM.

Similar articles

Cited by

References

    1. Mitchell TJ, et al. Timing the landmark events in the evolution of clear cell renal cell cancer: TRACERx renal. Cell. 2018;173:611–623.e617. doi: 10.1016/j.cell.2018.02.020. - DOI - PMC - PubMed
    1. Ivan M, et al. HIFalpha targeted for VHL-mediated destruction by proline hydroxylation: Implications for O2 sensing. Science (New York, NY) 2001;292:464–468. doi: 10.1126/science.1059817. - DOI - PubMed
    1. Thoma CR, et al. VHL loss causes spindle misorientation and chromosome instability. Nat. Cell Biol. 2009;11:994–1001. doi: 10.1038/ncb1912. - DOI - PubMed
    1. Hell MP, Duda M, Weber TC, Moch H, Krek W. Tumor suppressor VHL functions in the control of mitotic fidelity. Cancer Res. 2014;74:2422–2431. doi: 10.1158/0008-5472.CAN-13-2040. - DOI - PubMed
    1. Lutz MS, Burk RD. Primary cilium formation requires von hippel-lindau gene function in renal-derived cells. Cancer Res. 2006;66:6903–6907. doi: 10.1158/0008-5472.CAN-06-0501. - DOI - PubMed

Publication types

MeSH terms