

Selection of metastasis competent subclones in the tumour interior
- PMID: 34002049
- PMCID: PMC7611703
- DOI: 10.1038/s41559-021-01456-6
Selection of metastasis competent subclones in the tumour interior
Abstract
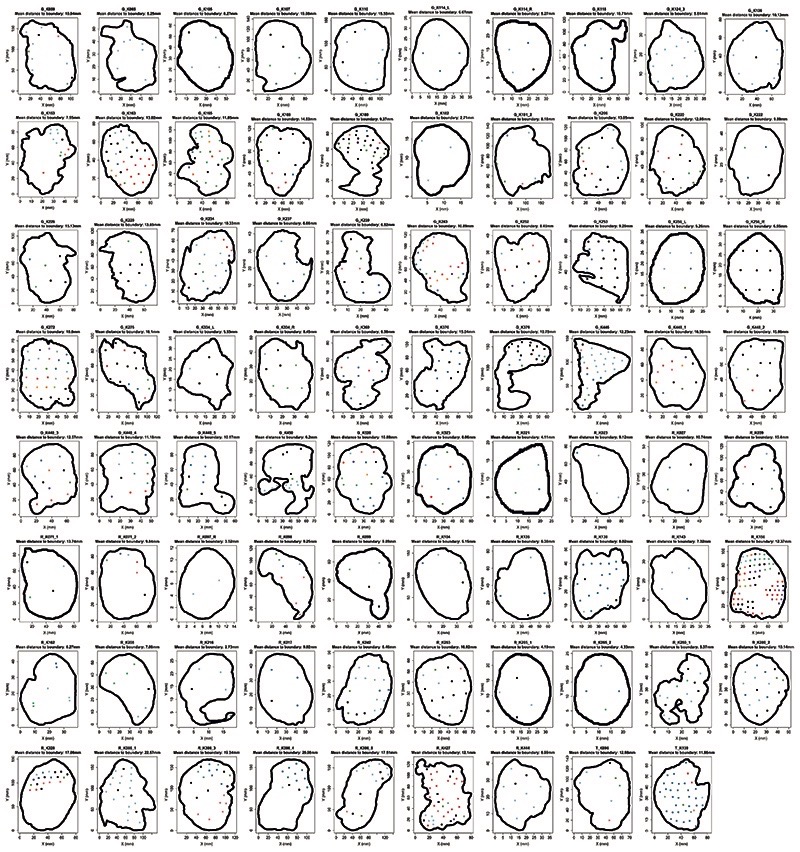
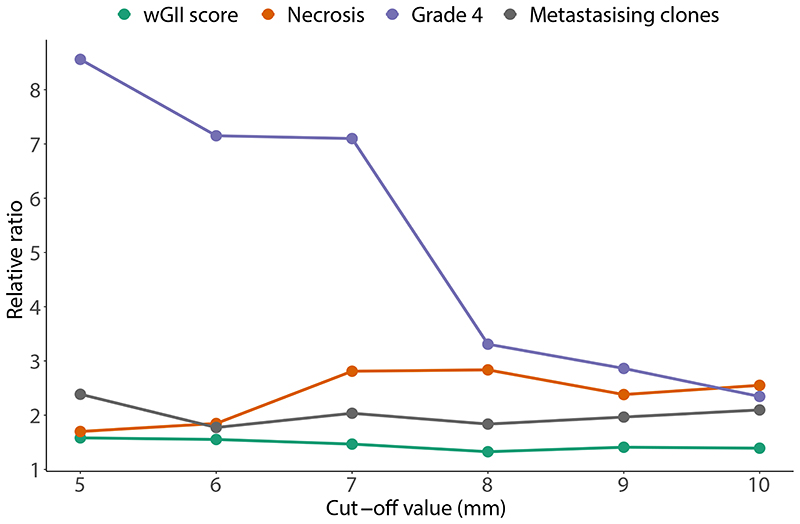
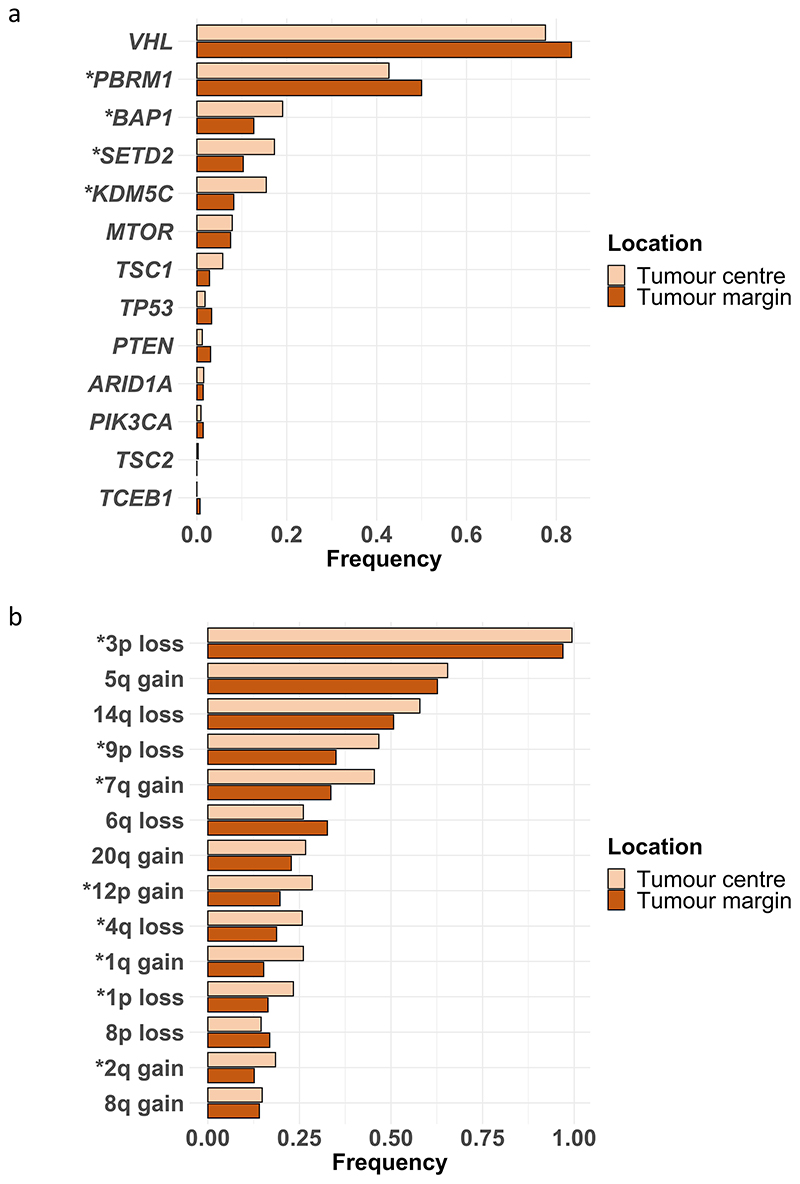
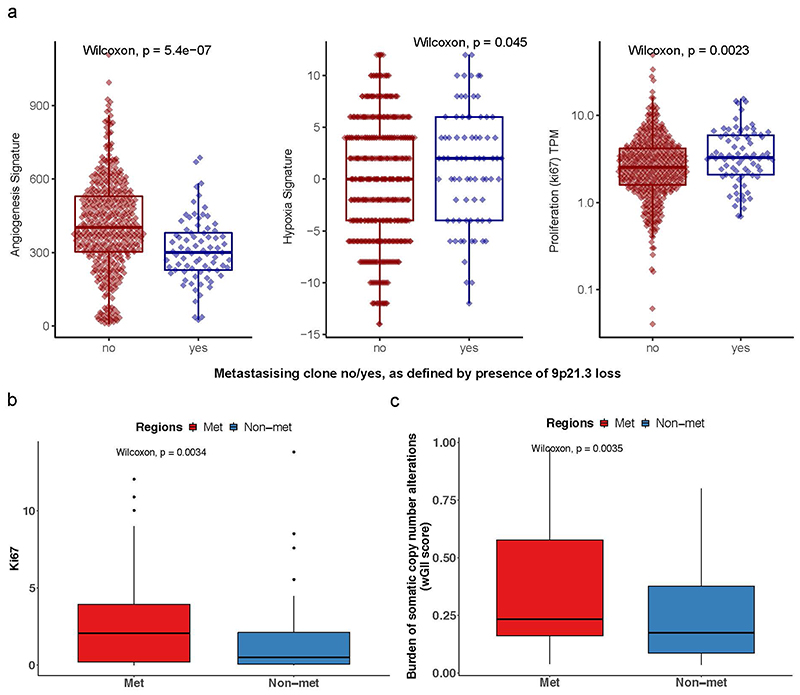
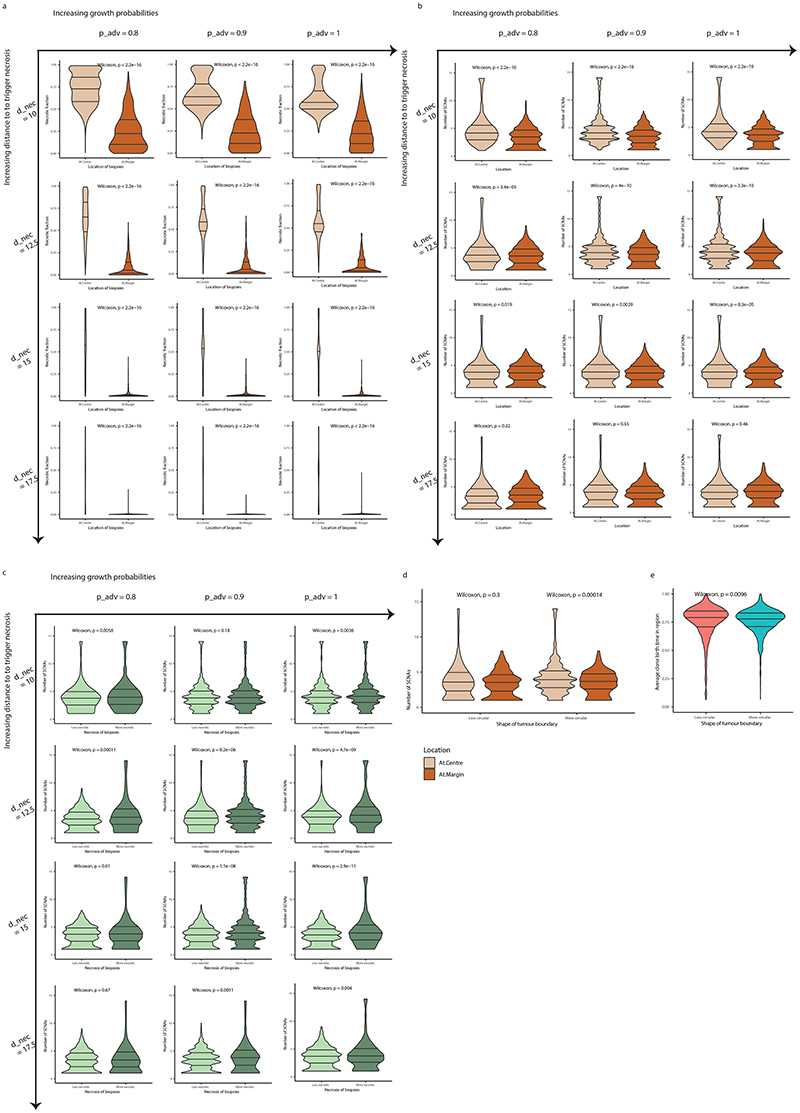
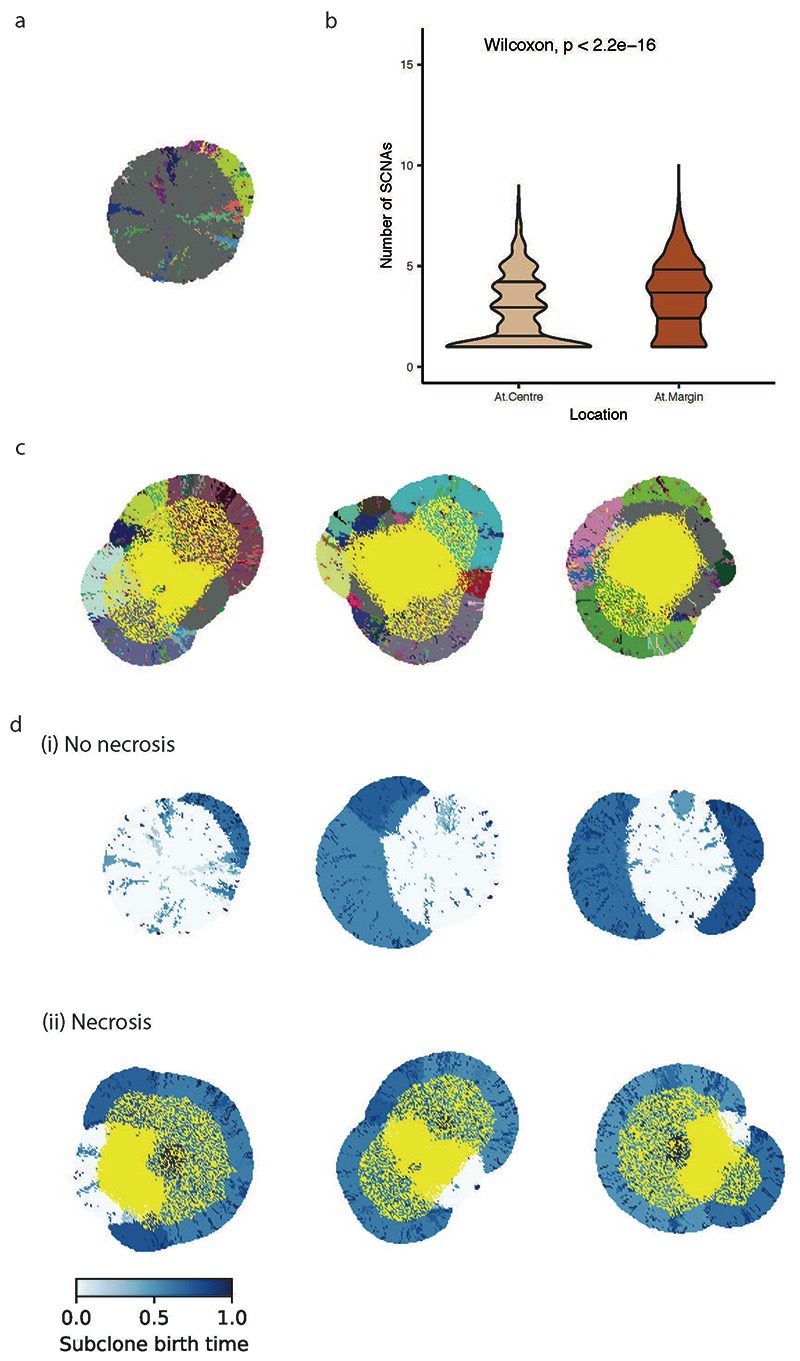
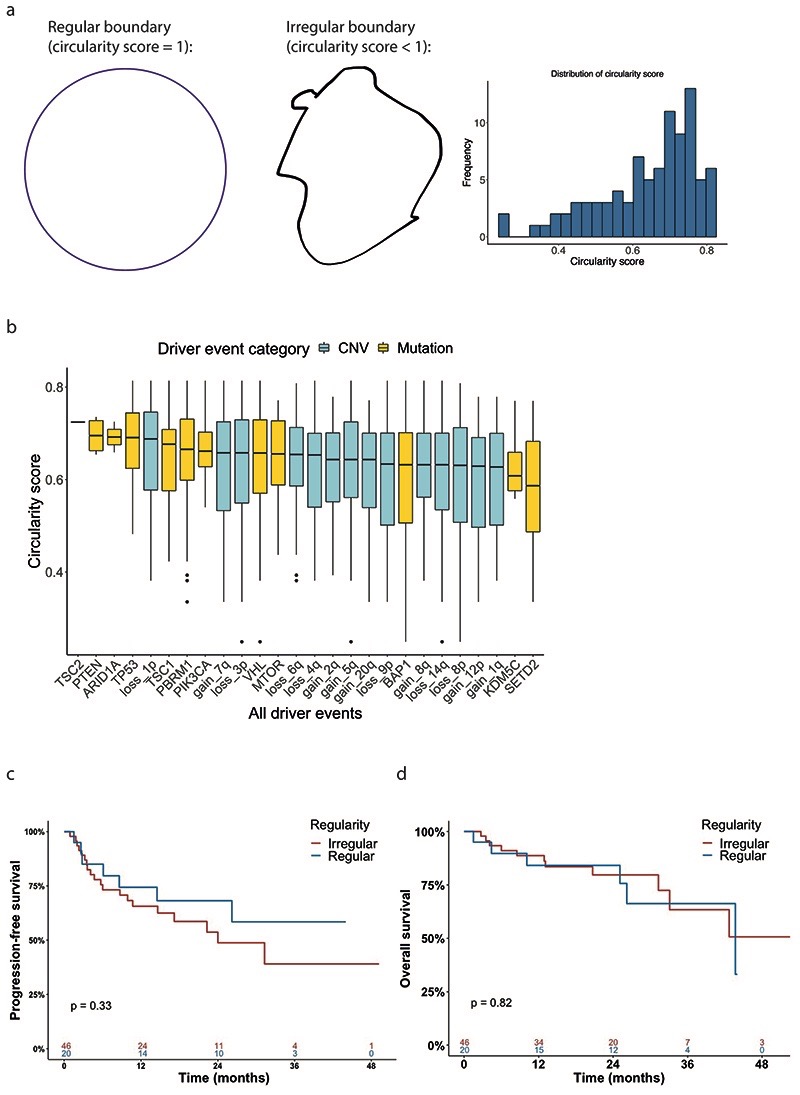
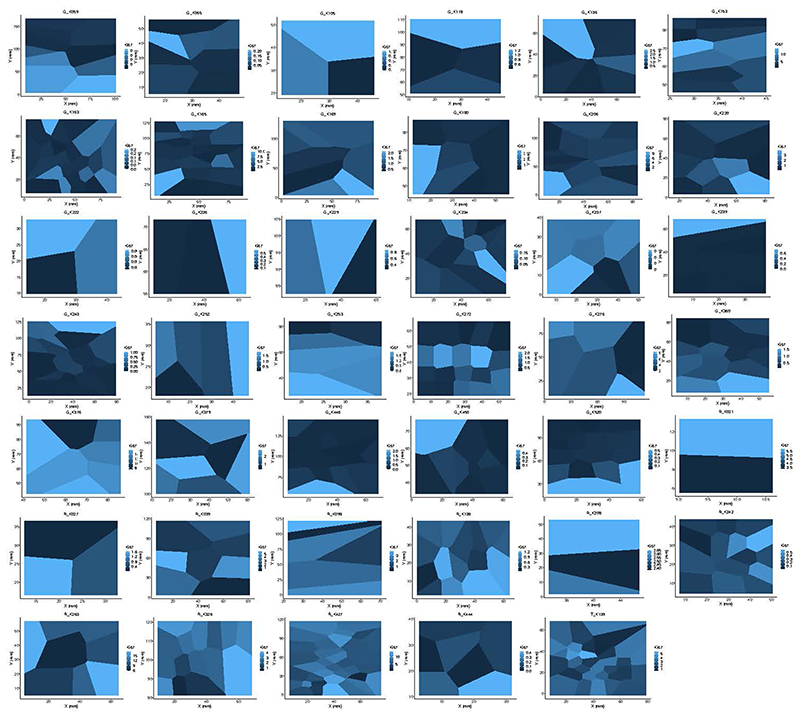
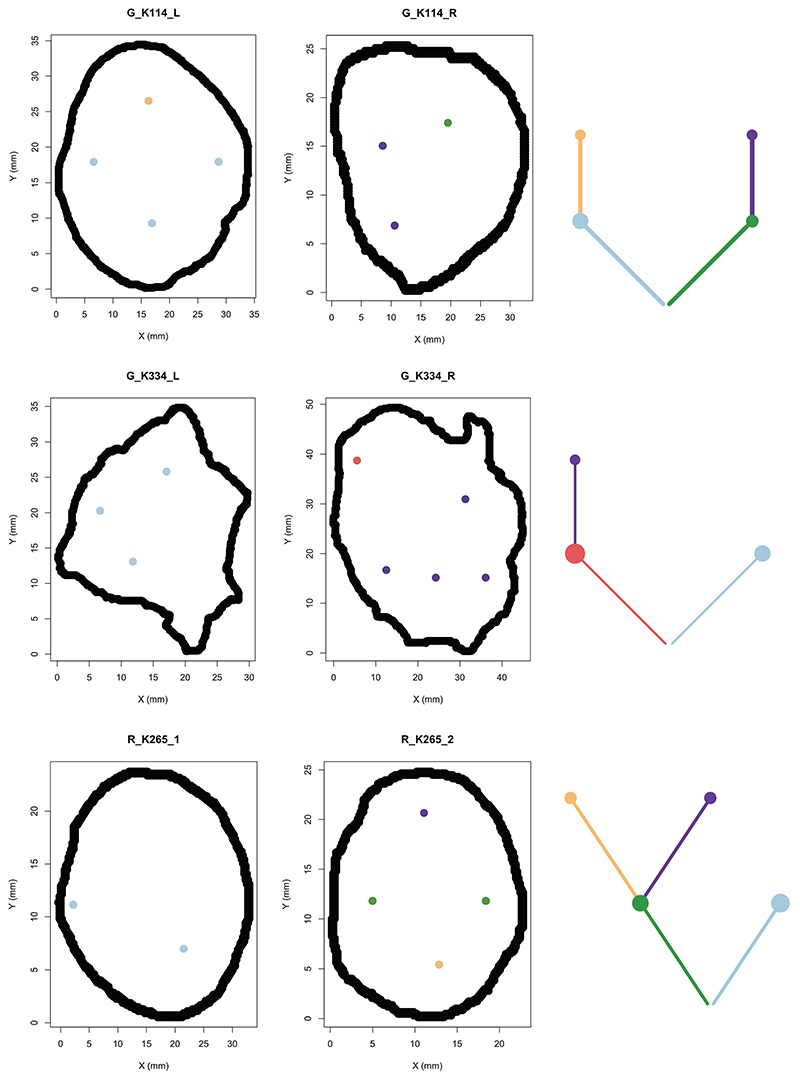
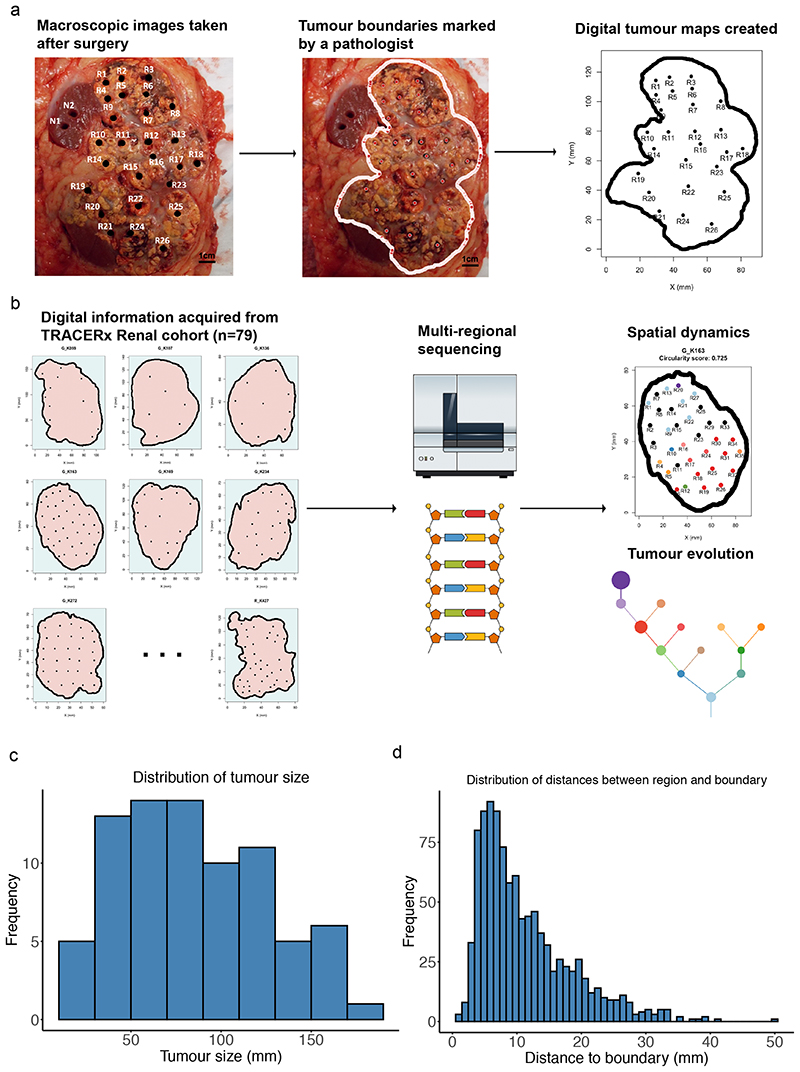
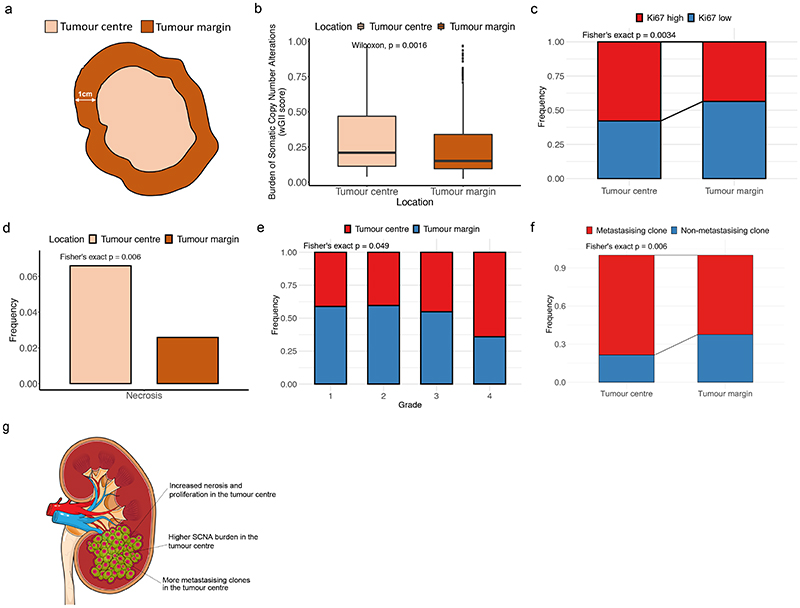
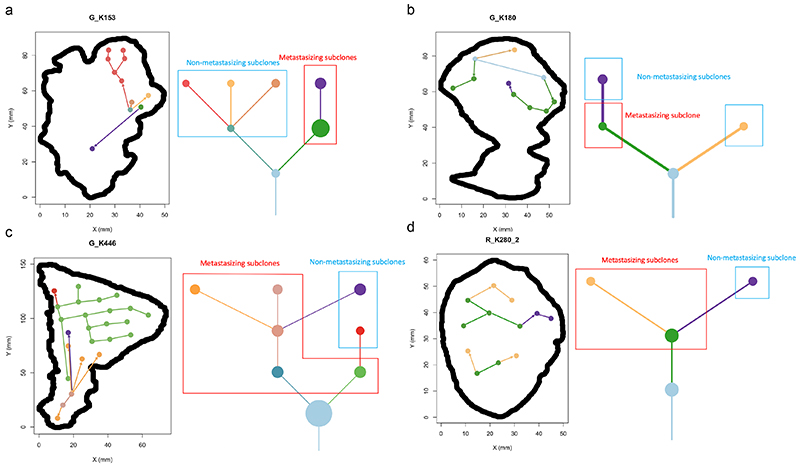
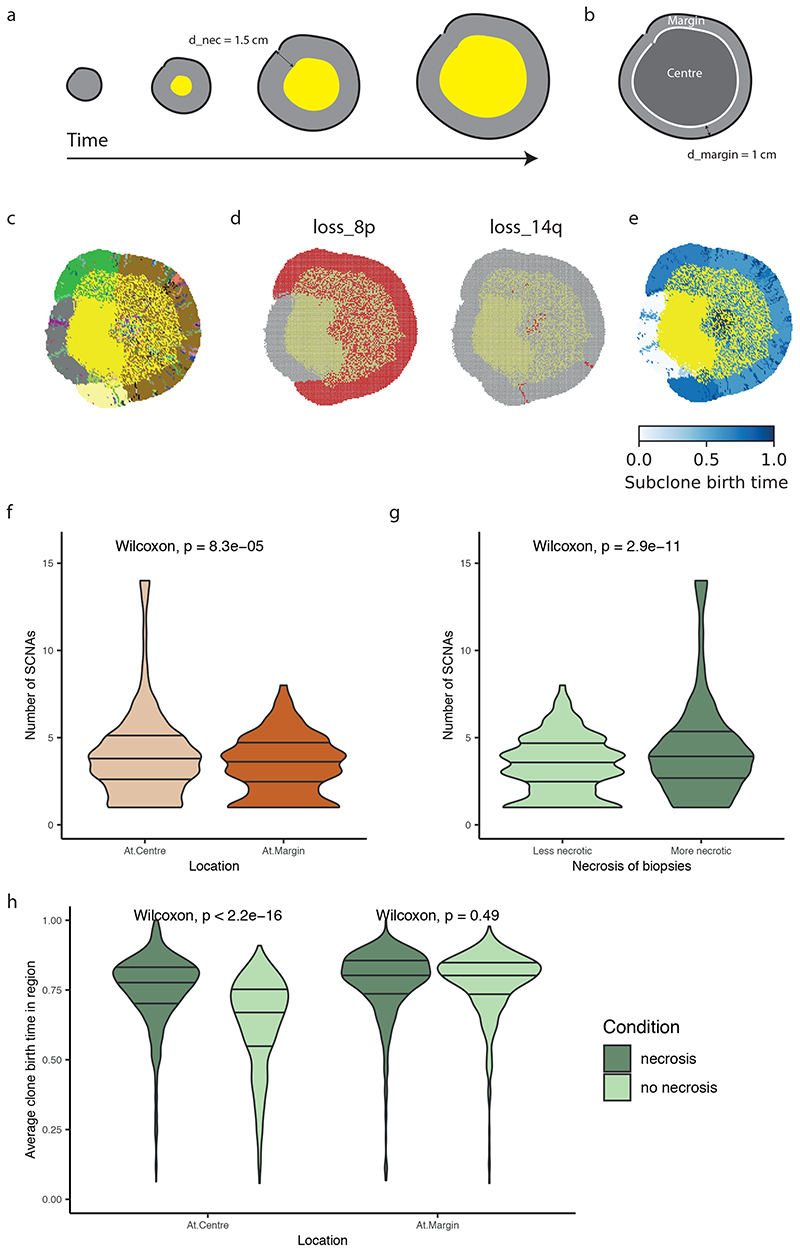
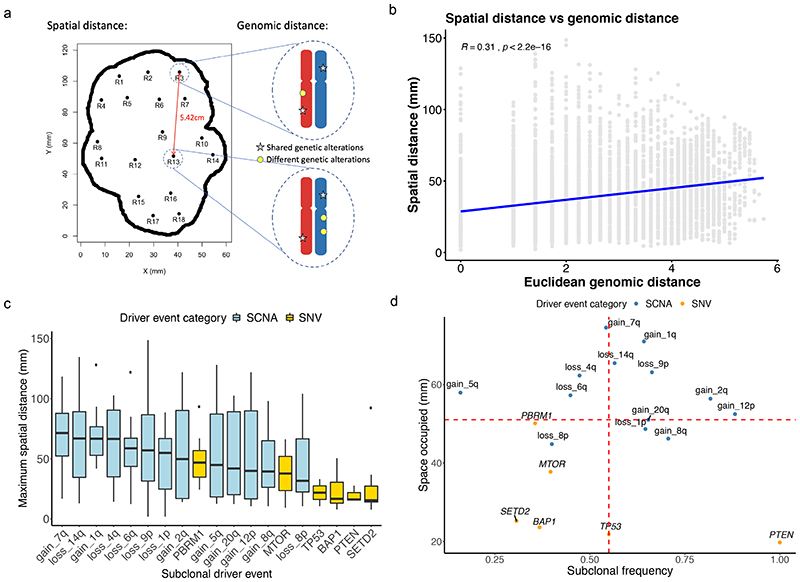
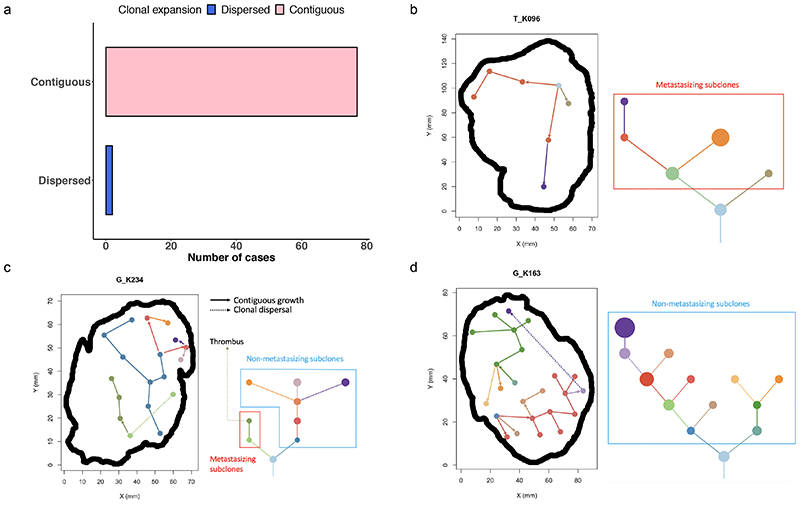
The genetic evolutionary features of solid tumour growth are becoming increasingly well described, but the spatial and physical nature of subclonal growth remains unclear. Here, we utilize 102 macroscopic whole-tumour images from clear cell renal cell carcinoma patients, with matched genetic and phenotypic data from 756 biopsies. Utilizing a digital image processing pipeline, a renal pathologist marked the boundaries between tumour and normal tissue and extracted positions of boundary line and biopsy regions to X and Y coordinates. We then integrated coordinates with genomic data to map exact spatial subclone locations, revealing how genetically distinct subclones grow and evolve spatially. We observed a phenotype of advanced and more aggressive subclonal growth in the tumour centre, characterized by an elevated burden of somatic copy number alterations and higher necrosis, proliferation rate and Fuhrman grade. Moreover, we found that metastasizing subclones preferentially originate from the tumour centre. Collectively, these observations suggest a model of accelerated evolution in the tumour interior, with harsh hypoxic environmental conditions leading to a greater opportunity for driver somatic copy number alterations to arise and expand due to selective advantage. Tumour subclone growth is predominantly spatially contiguous in nature. We found only two cases of subclone dispersal, one of which was associated with metastasis. The largest subclones spatially were dominated by driver somatic copy number alterations, suggesting that a large selective advantage can be conferred to subclones upon acquisition of these alterations. In conclusion, spatial dynamics is strongly associated with genomic alterations and plays an important role in tumour evolution.
Conflict of interest statement
S.T., and C.S. have a patent on indel burden and checkpoint inhibitor response pending, and a patent on targeting of frameshift neoantigens for personalised immunotherapy pending. K.L. has a patent on indel burden and CPI response pending and outside of the submitted work, speaker fees from Roche tissue diagnostics, research funding from CRUK TDL/Ono/LifeArc alliance, and a consulting role with Monopteros Therapeutics. S.T. has received speaking fees from Roche, Astra Zeneca, Novartis and Ipsen. S.T. has the following patents filed: Indel mutations as a therapeutic target and predictive biomarker PCTGB2018/051892 and PCTGB2018/051893 and Clear Cell Renal Cell Carcinoma Biomarkers P113326GB. C.S. acknowledges grant support from Pfizer, AstraZeneca, Bristol Myers Squibb, Roche-Ventana, Boehringer-Ingelheim, Archer Dx Inc (collaboration in minimal residual disease sequencing technologies) and Ono Pharmaceuticals. C.S is an AstraZeneca Advisory Board member and Chief Investigator for the MeRmaiD1 clinical trial, has consulted for Pfizer, Novartis, GlaxoSmithKline, MSD, Bristol Myers Squibb, Celgene, AstraZeneca, Illumina, Amgen, Genentech, Roche-Ventana, GRAIL, Medicxi, Bicycle Therapeutics, and the Sarah Cannon Research Institute, has stock options in Apogen Biotechnologies, Epic Bioscience, GRAIL, and has stock options and is co-founder of Achilles Therapeutics. C.S. holds patents relating to assay technology to detect tumour recurrence (PCT/GB2017/053289); to targeting neoantigens (PCT/EP2016/059401); identifying patent response to immune checkpoint blockade (PCT/EP2016/071471); determining whether HLA LOH is lost in a tumour (PCT/GB2018/052004); predicting survival rates of cancer patients (PCT/GB2020/050221); to treating cancer by targeting Insertion/deletion mutations (PCT/GB2018/051893); identifying insertion/deletion mutation targets (PCT/GB2018/051892); detecting tumor mutations (PCT/US2017/028013); and identifying responders to cancer treatment (PCT/GB2018/051912). E.S. receives research funding from Merck Sharp Dohme and Astrazeneca and is on the scientific advisory board of Phenomic.
We thank the TRACERx Renal trial team and the Skin and Renal Unit Research Team at The Royal Marsden NHS Foundation Trust, including Eleanor Carlyle, Lyra Del Rosario, Kim Edmonds, Karla Lingard, Mary Mangwende, Sarah Sarker, Charlotte Lewis, Fiona Williams, Hamid Ahmod, Tara Foley, Dilruba Kabir, Justine Korteweg, Aida Murra, Nahid Shaikh, Kema Peat, Sarah Vaughan and Lucy Holt. TRACERx Renal is funded by NIHR BRC at the Royal Marsden Hospital and Institute of Cancer Research (A109). The Francis Crick Institute, which receives its core funding from CRUK (FC010110), the UK Medical Research Council (FC010110), the Wellcome Trust (FC010110).
Figures
References
Publication types
MeSH terms
Grants and funding
- FC001144/WT_/Wellcome Trust/United Kingdom
- FC001003 /MRC_/Medical Research Council/United Kingdom
- FC010110/WT_/Wellcome Trust/United Kingdom
- 18176/CRUK_/Cancer Research UK/United Kingdom
- FC001988 /CRUK_/Cancer Research UK/United Kingdom
- FC001144 /WT_/Wellcome Trust/United Kingdom
- FC001144/CRUK_/Cancer Research UK/United Kingdom
- FC010110/MRC_/Medical Research Council/United Kingdom
- FC001003 /WT_/Wellcome Trust/United Kingdom
- FC001988 /WT_/Wellcome Trust/United Kingdom
- C50947/A18176/CRUK_/Cancer Research UK/United Kingdom
- FC001988/MRC_/Medical Research Council/United Kingdom
- 10748/CRUK_/Cancer Research UK/United Kingdom
- FC001169 /CRUK_/Cancer Research UK/United Kingdom
- FC001169 /MRC_/Medical Research Council/United Kingdom
- DH_/Department of Health/United Kingdom
- MR/V033077/1/MRC_/Medical Research Council/United Kingdom
- FC10988/CRUK_/Cancer Research UK/United Kingdom
- FC001003 /CRUK_/Cancer Research UK/United Kingdom
- FC001988/WT_/Wellcome Trust/United Kingdom
- FC001144 /CRUK_/Cancer Research UK/United Kingdom
- FC10988/WT_/Wellcome Trust/United Kingdom
- 29911/CRUK_/Cancer Research UK/United Kingdom
- MR/P014712/1/MRC_/Medical Research Council/United Kingdom
- FC001169 /WT_/Wellcome Trust/United Kingdom
- C69256/A30194/CRUK_/Cancer Research UK/United Kingdom
- FC001169/WT_/Wellcome Trust/United Kingdom
- FC001144 /MRC_/Medical Research Council/United Kingdom
- FC001003/WT_/Wellcome Trust/United Kingdom
- FC010110/CRUK_/Cancer Research UK/United Kingdom
- FC10988/MRC_/Medical Research Council/United Kingdom
LinkOut - more resources
Full Text Sources
Other Literature Sources
Medical
