. 2021 Jul;53(7):982-993.
doi: 10.1038/s41588-021-00868-1. Epub 2021 May 17.

An atlas of mitochondrial DNA genotype-phenotype associations in the UK Biobank

Affiliations

An atlas of mitochondrial DNA genotype-phenotype associations in the UK Biobank

Ekaterina Yonova-Doing et al. Nat Genet. 2021 Jul.

Abstract

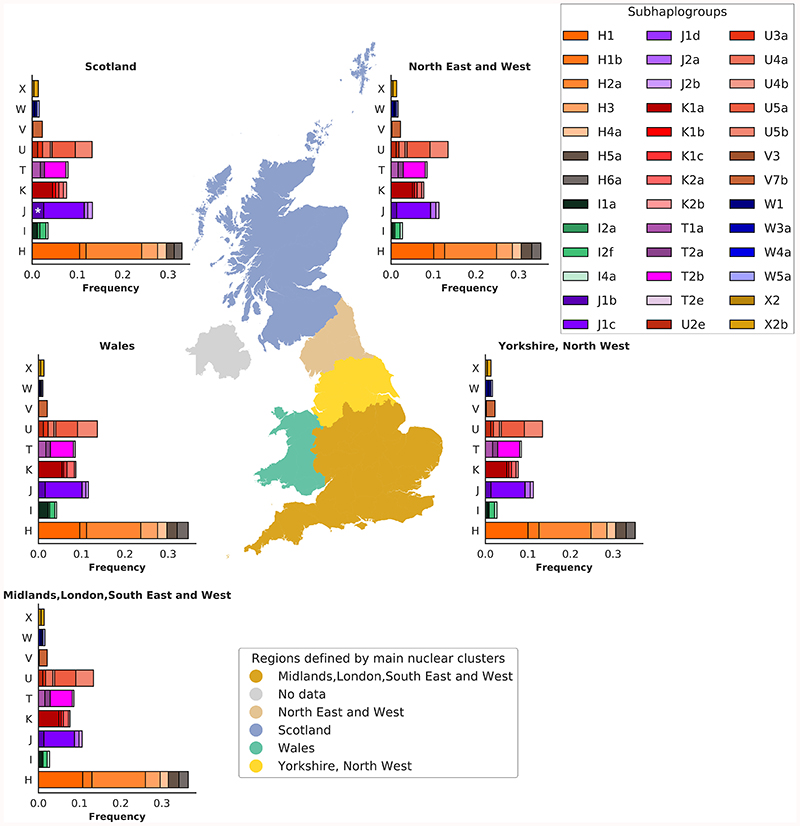
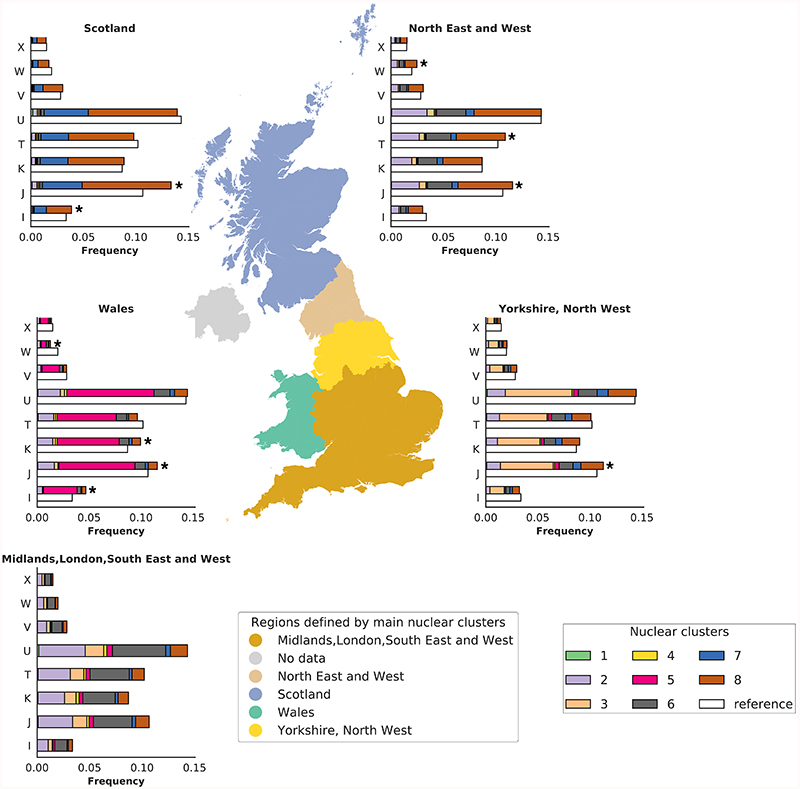
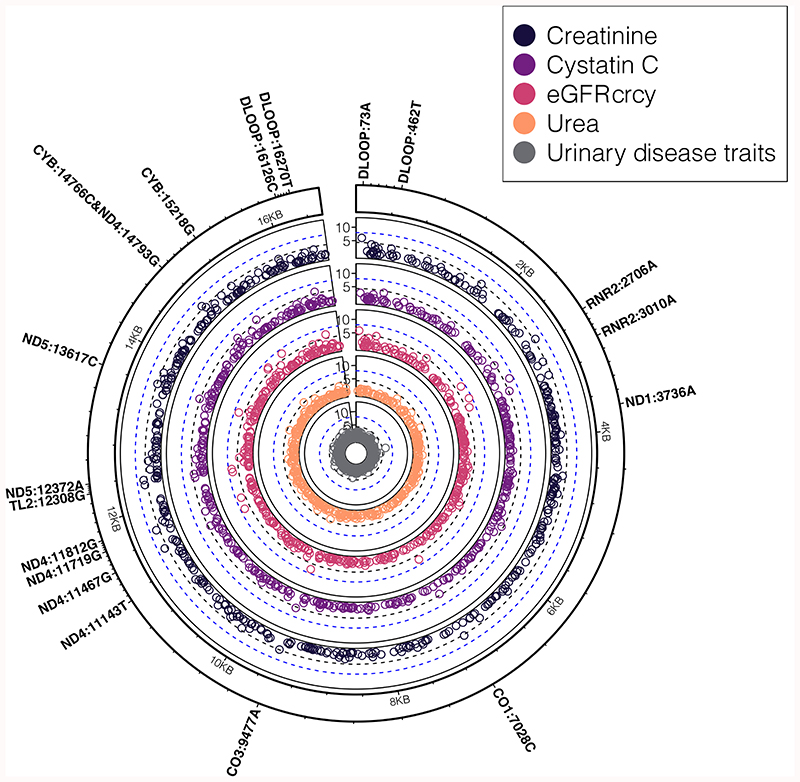
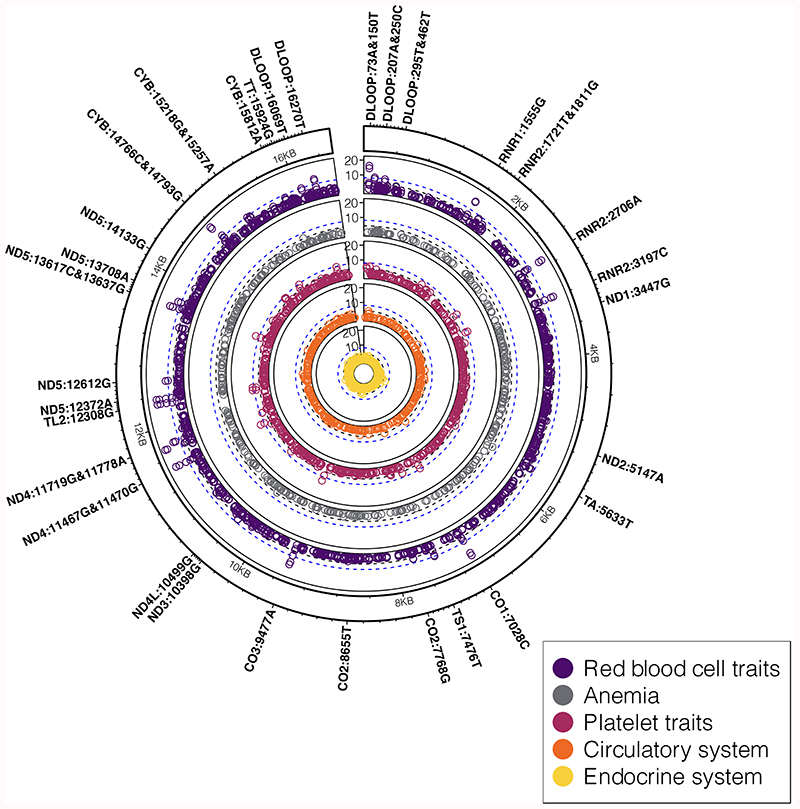
Mitochondrial DNA (mtDNA) variation in common diseases has been underexplored, partly due to a lack of genotype calling and quality-control procedures. Developing an at-scale workflow for mtDNA variant analyses, we show correlations between nuclear and mitochondrial genomic structures within subpopulations of Great Britain and establish a UK Biobank reference atlas of mtDNA-phenotype associations. A total of 260 mtDNA-phenotype associations were new (P < 1 × 10⁻⁵), including rs2853822 /m.8655 C>T (MT-ATP6) with type 2 diabetes, rs878966690 /m.13117 A>G (MT-ND5) with multiple sclerosis, 6 mtDNA associations with adult height, 24 mtDNA associations with 2 liver biomarkers and 16 mtDNA associations with parameters of renal function. Rare-variant gene-based tests implicated complex I genes modulating mean corpuscular volume and mean corpuscular hemoglobin. Seven traits had both rare and common mtDNA associations, where rare variants tended to have larger effects than common variants. Our work illustrates the value of studying mtDNA variants in common complex diseases and lays foundations for future large-scale mtDNA association studies.


Conflict of interest statement

Conflicts of interest

JMMH and EYD become full time employees of Novo Nordisk during the drafting of the manuscript. The remaining authors declare no conflicts of interest.

Figures

Extended Data Fig. 1
Extended Data Fig. 1. Distribution of mitochondrial sub-haplogroups across Great Britain
The European unrelated individuals with birth coordinates (N=327,665) were clustered based on the first 10 nucPCs, resulting in eight nuclear clusters. The map of Great Britain is colored according to the five regions identified by the most common clusters or combination of clusters in each region: 1) Scotland; 2) North of England (North East and West); 3) North of England (Yorkshire and the Humber, North West of England); 4) South of England (Midlands, London, South East and West of England); 5) Wales. No data were available for Northern Ireland. The stacked bar charts represent the frequency of unrelated individuals in each mitochondrial sub-haplogroups, in the five regions identified by the most common nuclear clusters or combination of nuclear clusters. The star indicates an over-representation (likelihood ratio test, two-sided P<5x10⁻⁵) of J1b sub-haplogroup in Scotland compared to the Midlands, London, South East and West region.
Extended Data Fig. 2
Extended Data Fig. 2. Relationship between population structure in the nuclear and mitochondrial genomes
The figure shows (a) circular Manhattan plots of the association between the first 10 nucPCs and mtSNVs. For each mtSNV, the association was tested using a linear regression model: Y~ β1 x X1 + β2 x X2 + β3 x X3 + β4 x X4 + β5 x X5 where Y is a vector containing the values of a nucPC, X1 is a vector of mtSNV dosages and X2-X5 are vectors containing covariate values (age, age squared, sex, and array) and β1-5 represent the effect of each variable on the mean of Y. Wald test two-sided P-values are presented. The nucPCs are ordered from PC1 to PC10 from outside to in and black dots represent (Wald test, two-sided) P <5x10⁻⁵; (b) 3D plots of the first three mtPCs; and (c) the relationship between the first three nuclear principal components (nucPCs, nucPC1 - left, nucPC2 - middle, nucPC3 - right) and the first two mitochondrial principal components (mtPCs). The latter were calculated using mtSNVs with MAF>0.01 and R2<0.2. The mtPCs in (a) and (b) were calculated using the following sets of genotyped mtSNV: (from left to right) all mtSNVs; mtSNVs with MAF>0.01 only; and mtSNVs with MAF>0.01 after LD-pruning at R2<0.2. N=the number of mtSNVs included in a given analysis. In (b) and (c) individuals are coloured according to macro-haplogroup carrier status.
Extended Data Fig. 3
Extended Data Fig. 3. Principal components analysis of the European set of UK Biobank participants in comparison to European participants in GenBank, 1000 genomes and WTCCC
Plots of the first three mitochondrial principal components (mtPCs) for individuals in: (a) the European set of UK Biobank (N=358,916), (b) GenBank reference set used for imputation (N=6,593), (c) 1000 Genomes individuals (N=498) and (d) WTCCC controls (N=747). For each of the three data sets, plots on the left-hand side show mtPCs calculated using pruned SNVs (R2<0.2 for UK Biobank and R2<0.1 for GenBank, 1000 Genomes and WTCCC) while the plots on the right were generated without LD-pruning. Individuals are colored according to macro-haplogroup carrier status. mtPCs were calculated using genotyped SNVs (MAF>0.01).
Figure 1
Figure 1. Mitochondrial genome PheWAS workflow
(a) Quality control (QC) workflow: the steps taken to assure genotype quality are listed. The stages were as follows: (1) pre-recalling QC, (2) manual re-calling, (3) post-re-calling QC, and (4) imputation of mtSNVs not genotyped on the arrays. (b) Examples of probe intensities cluster plots for a mtSNV (m.14869G>A) pre- and post-recalling genotyped in the “Full set” (N = 483,626 participants); color legend corresponds to genotype assignment with black dots indicate missing genotypes. (c) Scatterplot showing correlation of -log10 MAFs of the 241 recalled mtSNVs compared to UKBB genotyped mtSNVs. The long dashed lines indicate y=x and the short dashed lines the linear regression fit. The grey shaded area represents the 95% confidence interval of the regression fit. Spearman’s correlation, two-sided P-value (P = 1.8x10-205) and rho are provided. (d) Scatterplots showing correlation of -log10 MAFs of the genotyped mtSNVs post-recalling (left plot) and the imputed variants (right plot) in UKBB mtSNVs compared to GenBank mtSNVs (MAC≥30). Spearman’s correlation, two-sided P-value (P = 8.6x10-65 for genotyped SNVs; P = 1.8x10⁻²⁶ for imputed SNVs) and rho are provided. Color coding represents the population each mtSNV is tagging (green = African, blue = Asian, orange = European population). The UKBB individuals with nuclear-mitochondrial matched African (AFR, N=2012 participants), Asian (AS, N=888 participants) and European (EUR, N=358,916, unrelated participants) ancestries were compared to corresponding GenBank genomes (EUR, N=6,593, AFR, N = 704, AS, N = 3,587). (e) CONSORT-like diagram showing the breakdown of people and mtSNVs excluded at each step of the study. Colors correspond to the following steps: light yellow = pre-calling, peach = manual re-calling, light green = post re-calling, pink = imputation. INFO = IMPUTE2 score; MAC = minor allele count; BT = binary trait; QT = quantitative trait.
Figure 2
Figure 2. Distribution of the eight nuclear genome clusters and mtDNA haplogroups across Great Britain
The European unrelated individuals with birth coordinates (N=327,665 participants) were clustered based on the first 10 nucPCs, resulting in eight nuclear clusters. The map of Great Britain and Northern Ireland is colored according to the five regions identified by the most common clusters or combination of clusters in each region: 1) Scotland; 2) North of England (North East and West); 3) North of England (Yorkshire and the Humber, North West of England); 4) South of England (Midlands, London, South East and West of England); 5) Wales. No data was available for Northern Ireland as participants were not recruited to UKBB from Northern Ireland. The stacked bar charts represent the frequency of unrelated individuals in each of the eight identified nuclear clusters across eight European macro-haplogroups in each region (X, W, V, U, T, K, J, I). The macro-haplogroup H (the most common among European macro-haplogroups) was used as baseline in the multinomial regression analysis and has been omitted. The white bars indicate the frequencies of individuals in the region used as reference to compare macro-haplogroups distribution, i.e. the area corresponding to South of England. * denotes macro-haplogroups that are distributed differently (likelihood ratio test, two-sided, P<5x10⁻⁵) between South of England and the rest of the country. Colors in the ‘Nuclear clusters’ box refer to haplogroup frequency barcharts, while colors in the ‘Regions defined by the main nuclear clusters’ are used to mark the five regions of the country. The map was plot using the GeoPandas package (https://geopandas.org/) under python 2.7.
Figure 3
Figure 3. mtSNV associations with kidney related traits
Concentric circular Manhattan plots showing a summary of associations (two-sided, P<5x10⁻⁵) between mtSNVs and traits related to kidney function: creatinine (N=341,440 participants), cystatin C (N=341,197 participants), estimated glomerular filtration rate (eGFR) calculated using both creatinine and cystatin C (crcy, N=342,007 participants), urea (N=341,276 participants), kidney related disease traits (calculus of the kidney [ICD10:N20.0] (N=279,179 participants); polyuria [ICD10:R35], (N=279,179 participants); urinary tract infection/kidney infection [#20002:1196] (N = 271,331 participants); bladder problem (not cancer) [#20002:1201] (N=271,331 participants)). The first four traits are part of (or derived from) the serum biomarker kidney function panel. The black dashed line denotes the mitochondrial genome multiple testing adjusted significance threshold (two-sided, P=5x10⁻⁵) while the blue dashed line denotes the nuclear GWAS significance threshold (two-sided, P=5x10⁻⁸). mtSNVs passing the mitochondrial genome multiple testing threshold are annotated by their locus, position and effect allele.
Figure 4
Figure 4. PheWAS association results for blood cell and cardiometabolic traits
Circular concentric Manhattan plots showing a summary of associations (two-sided, P<5x10⁻⁵) between mtSNVs and traits related to cardio-metabolic health and endocrine traits, including red blood cell and platelet traits (quantitative traits, in up to N=325,670 participants), iron deficiency anemia (N=279,179 participants), and associated binary traits belonging to circulatory (N=279,179 participants) and endocrine systems (N=322,038 participants) according to ICD-10 codes (Table 1). The black dashed line denotes the mitochondrial genome multiple testing adjusted significance threshold (two-sided, P=5x10⁻⁵) while the blue dashed line denotes the nuclear genome significance threshold (two-sided, P=5x10⁻⁸). mtSNVs passing the mitochondrial genome multiple testing adjusted significance threshold are annotated by their locus, position and effect allele.

References

    1. Saraste M. Oxidative phosphorylation at the fin de siècle. Science. 1999;283:1488–1493. - PubMed
    1. Giles RE, Blanc H, Cann HM, Wallace DC. Maternal inheritance of human mitochondrial DNA. Proceedings of the National Academy of Sciences; 1980. pp. 6715–6719. - PMC - PubMed
    1. Elson JL, et al. Analysis of European mtDNAs for recombination. Am J Hum Genet. 2001;68:145–153. - PMC - PubMed
    1. Wallace DC. Mitochondrial DNA sequence variation in human evolution and disease. Proc Natl Acad Sci USA. 1994;91:8739–8746. - PMC - PubMed
    1. Wallace DC, Brown MD, Lott MT. Mitochondrial DNA variation in human evolution and disease. Gene. 1999;238:211–230. - PubMed

Publication types

Substances

LinkOut - more resources